106: Turbonomic Dashboard
1. Dashboard Home
To navigate to the Turbonomic dashboard:
- Select "Reports" in the dropdown (A)
- Start typing "Turbonomic" and select "turbonomic Performance Dashboard" (B)


The dashboard shows the entire organization's Host energy and emission details.
Reporting Period
Note: you can change the report period to show the data between the selected dates.

Left Panel
The left side panel shows the following for the entire organization.
Host Energyof Current Year (985.8K), Previous Year (1.0M) and variation (-5.2%)Carbon Emissionsof Current Year (315.3), Previous Year (342.5) and variation (-7.9%)Average Active hosts(32) andAverage Active VMs(509)
So there is a reduction in Host energy consumption and Carbon Emissions this year compared to previous year.
Center Panel
The center panel shows data centers marked in the map.
Right Panel
The right side panel shows the list of data centers ordered based on Host energy consumption.
1.1 Host Energy Consumption by Data Center
-
Click on any of the
data centerin the Map.The left side panel is updated with data center specific data.
-
Host Energyof Current Year (171.8K), Previous Year (243.8K) and variation (-29.5%) -
Carbon Emissionsof Current Year (39.7), Previous Year (51.1) and variation (-22.3%) -
Average Active hosts(47) andAverage Active VMs(961)The right side panel also highlights the selected data center.

-
Mouseover the
data centerin the map shows theHost energy Consumptiongraph comparing with the previous year.The graph shows that
energy consumptionis less than last year.

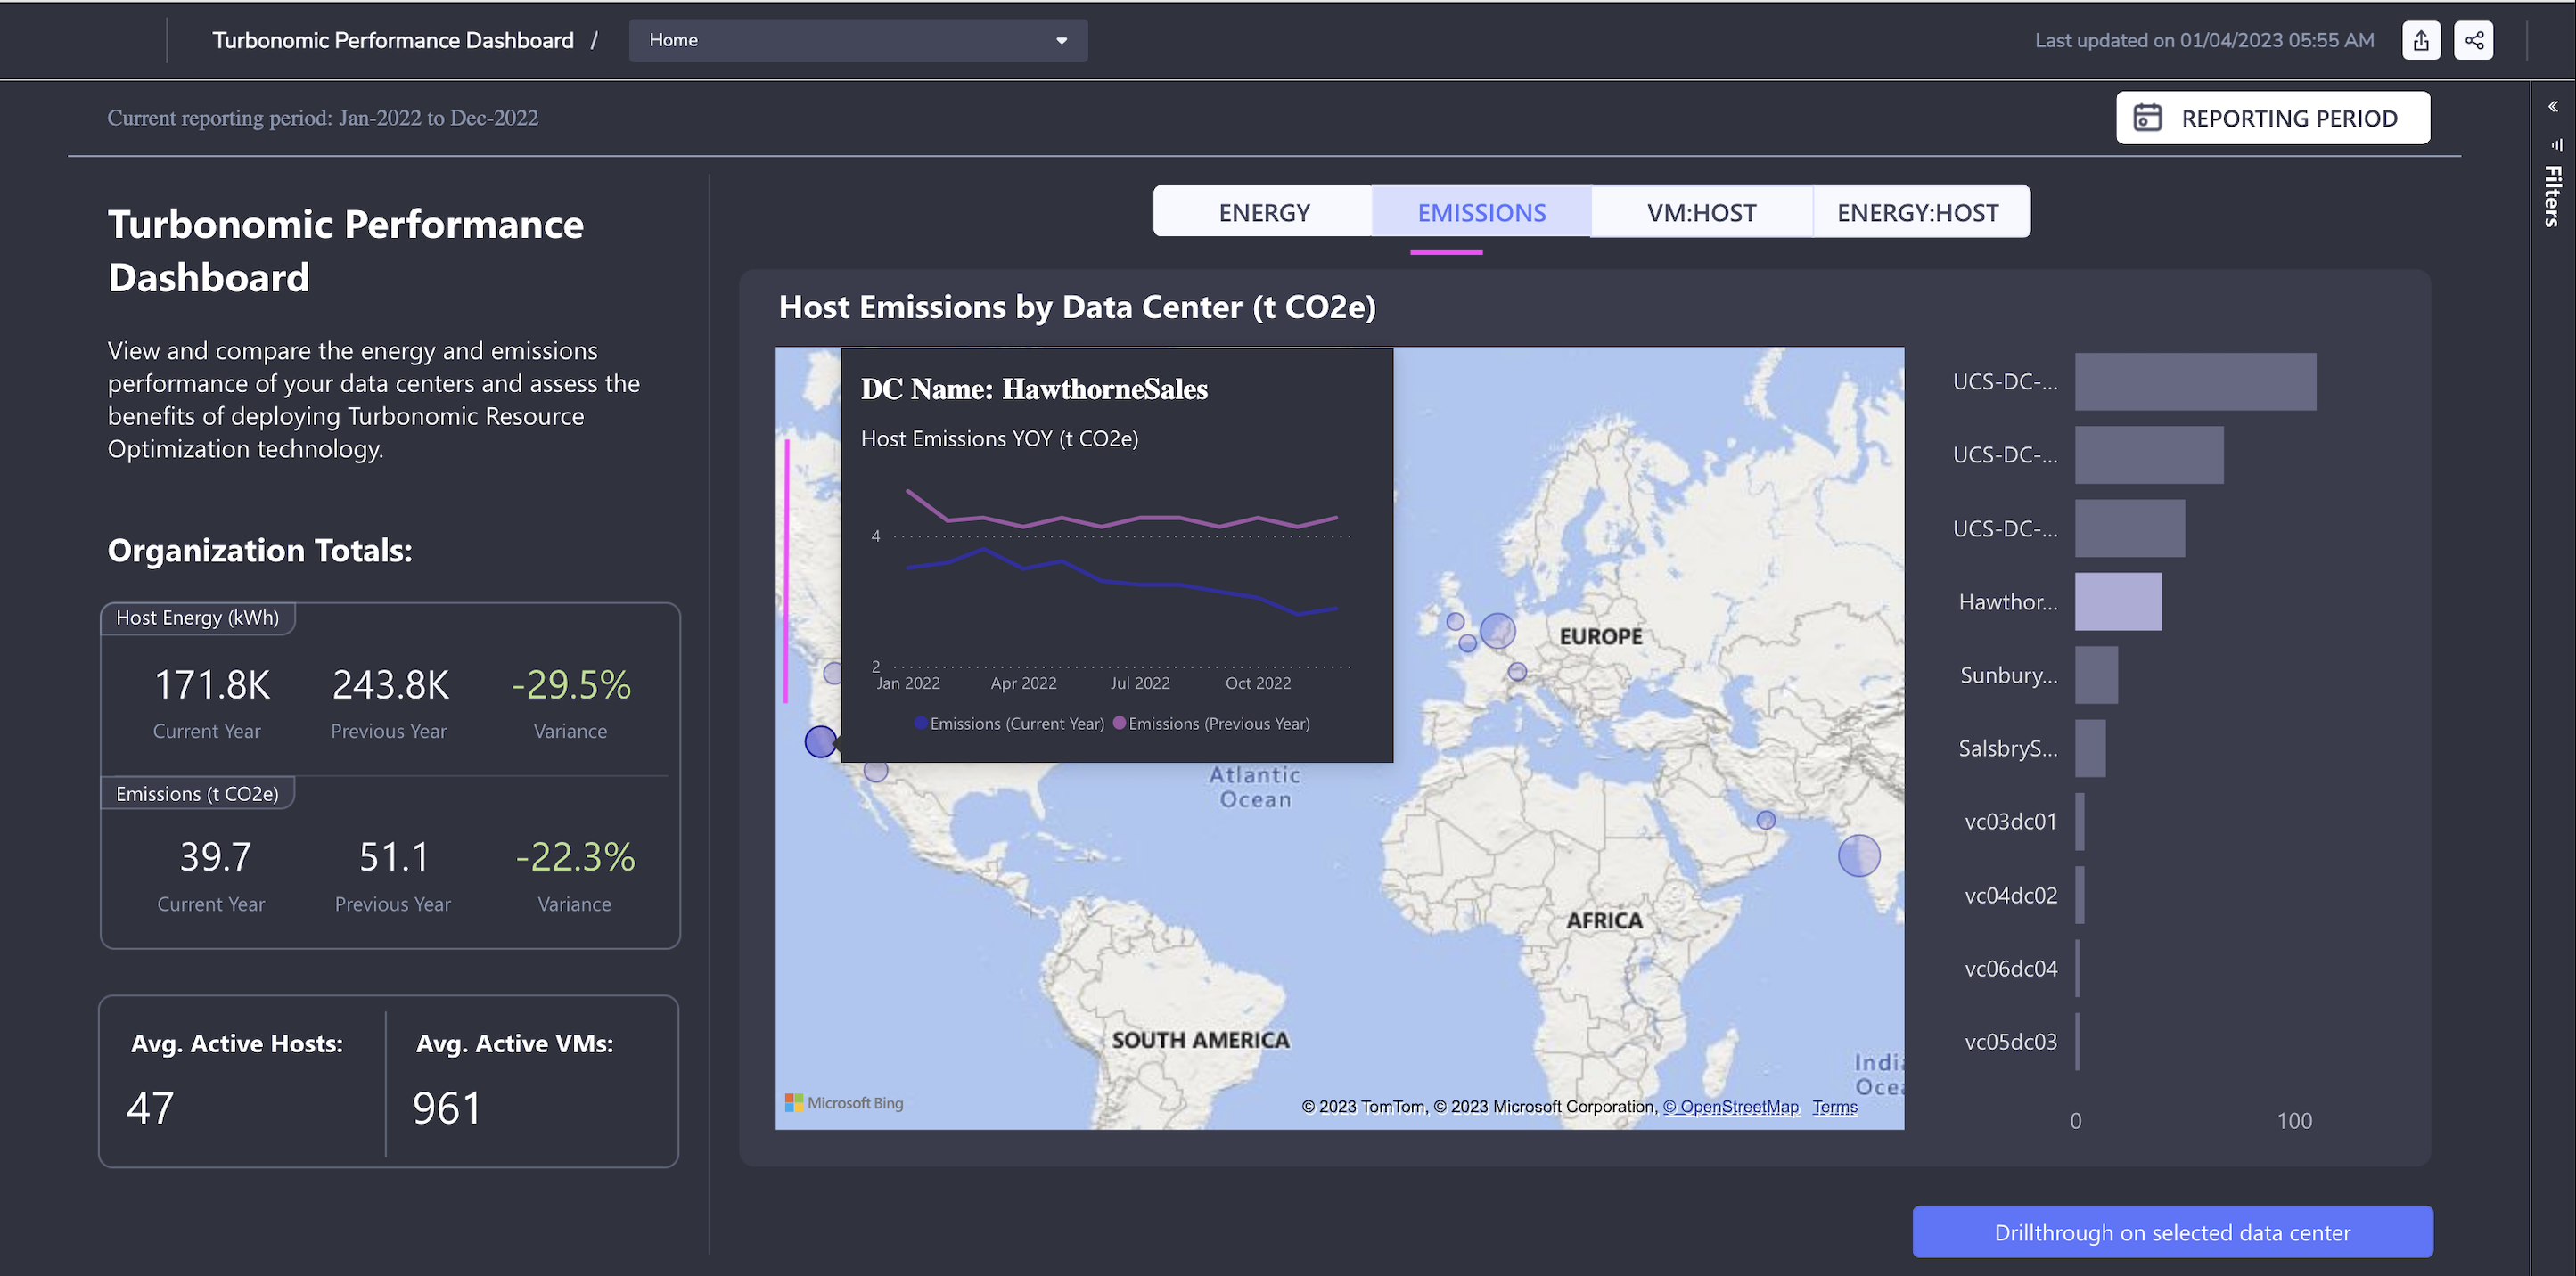
1.2 Host Emissions by Data Center
-
Click on the
Emissionstab in the Center panel.It refreshes the page with the Emissions details. There is no change to the left panel as it is already showing emission details.
-
Mouseover the
data centerin the map shows theEmissions graphcomparing with the previous year.The graph shows that emissions are less than last year.
1.3 VM:Host Density by Data Center
-
Click on
VM:HOSTtab and it showsVM and Host densityin the Data center.When more VMs are provisioned in a Host then it would be a effective utilization of the resources. Turbonomic helps to identify the scattered VMs and take appropriate actions.
-
Mouseover the data center in the map shows the
VM:Hostdensity comparing with the previous year.

1.4 Energy:Host Intensity by Data Center
-
Click on the
Energy:Hosttab in the Center panel. -
Mouseover on the data center in the map shows the Energy:Host Intensity comparing with the previous year.

2. Data Center Summary
Lets look at the data center summary report.
-
Click on any of the data center in the right panel.
-
Click on
Drillthrough on selected data centerbutton.
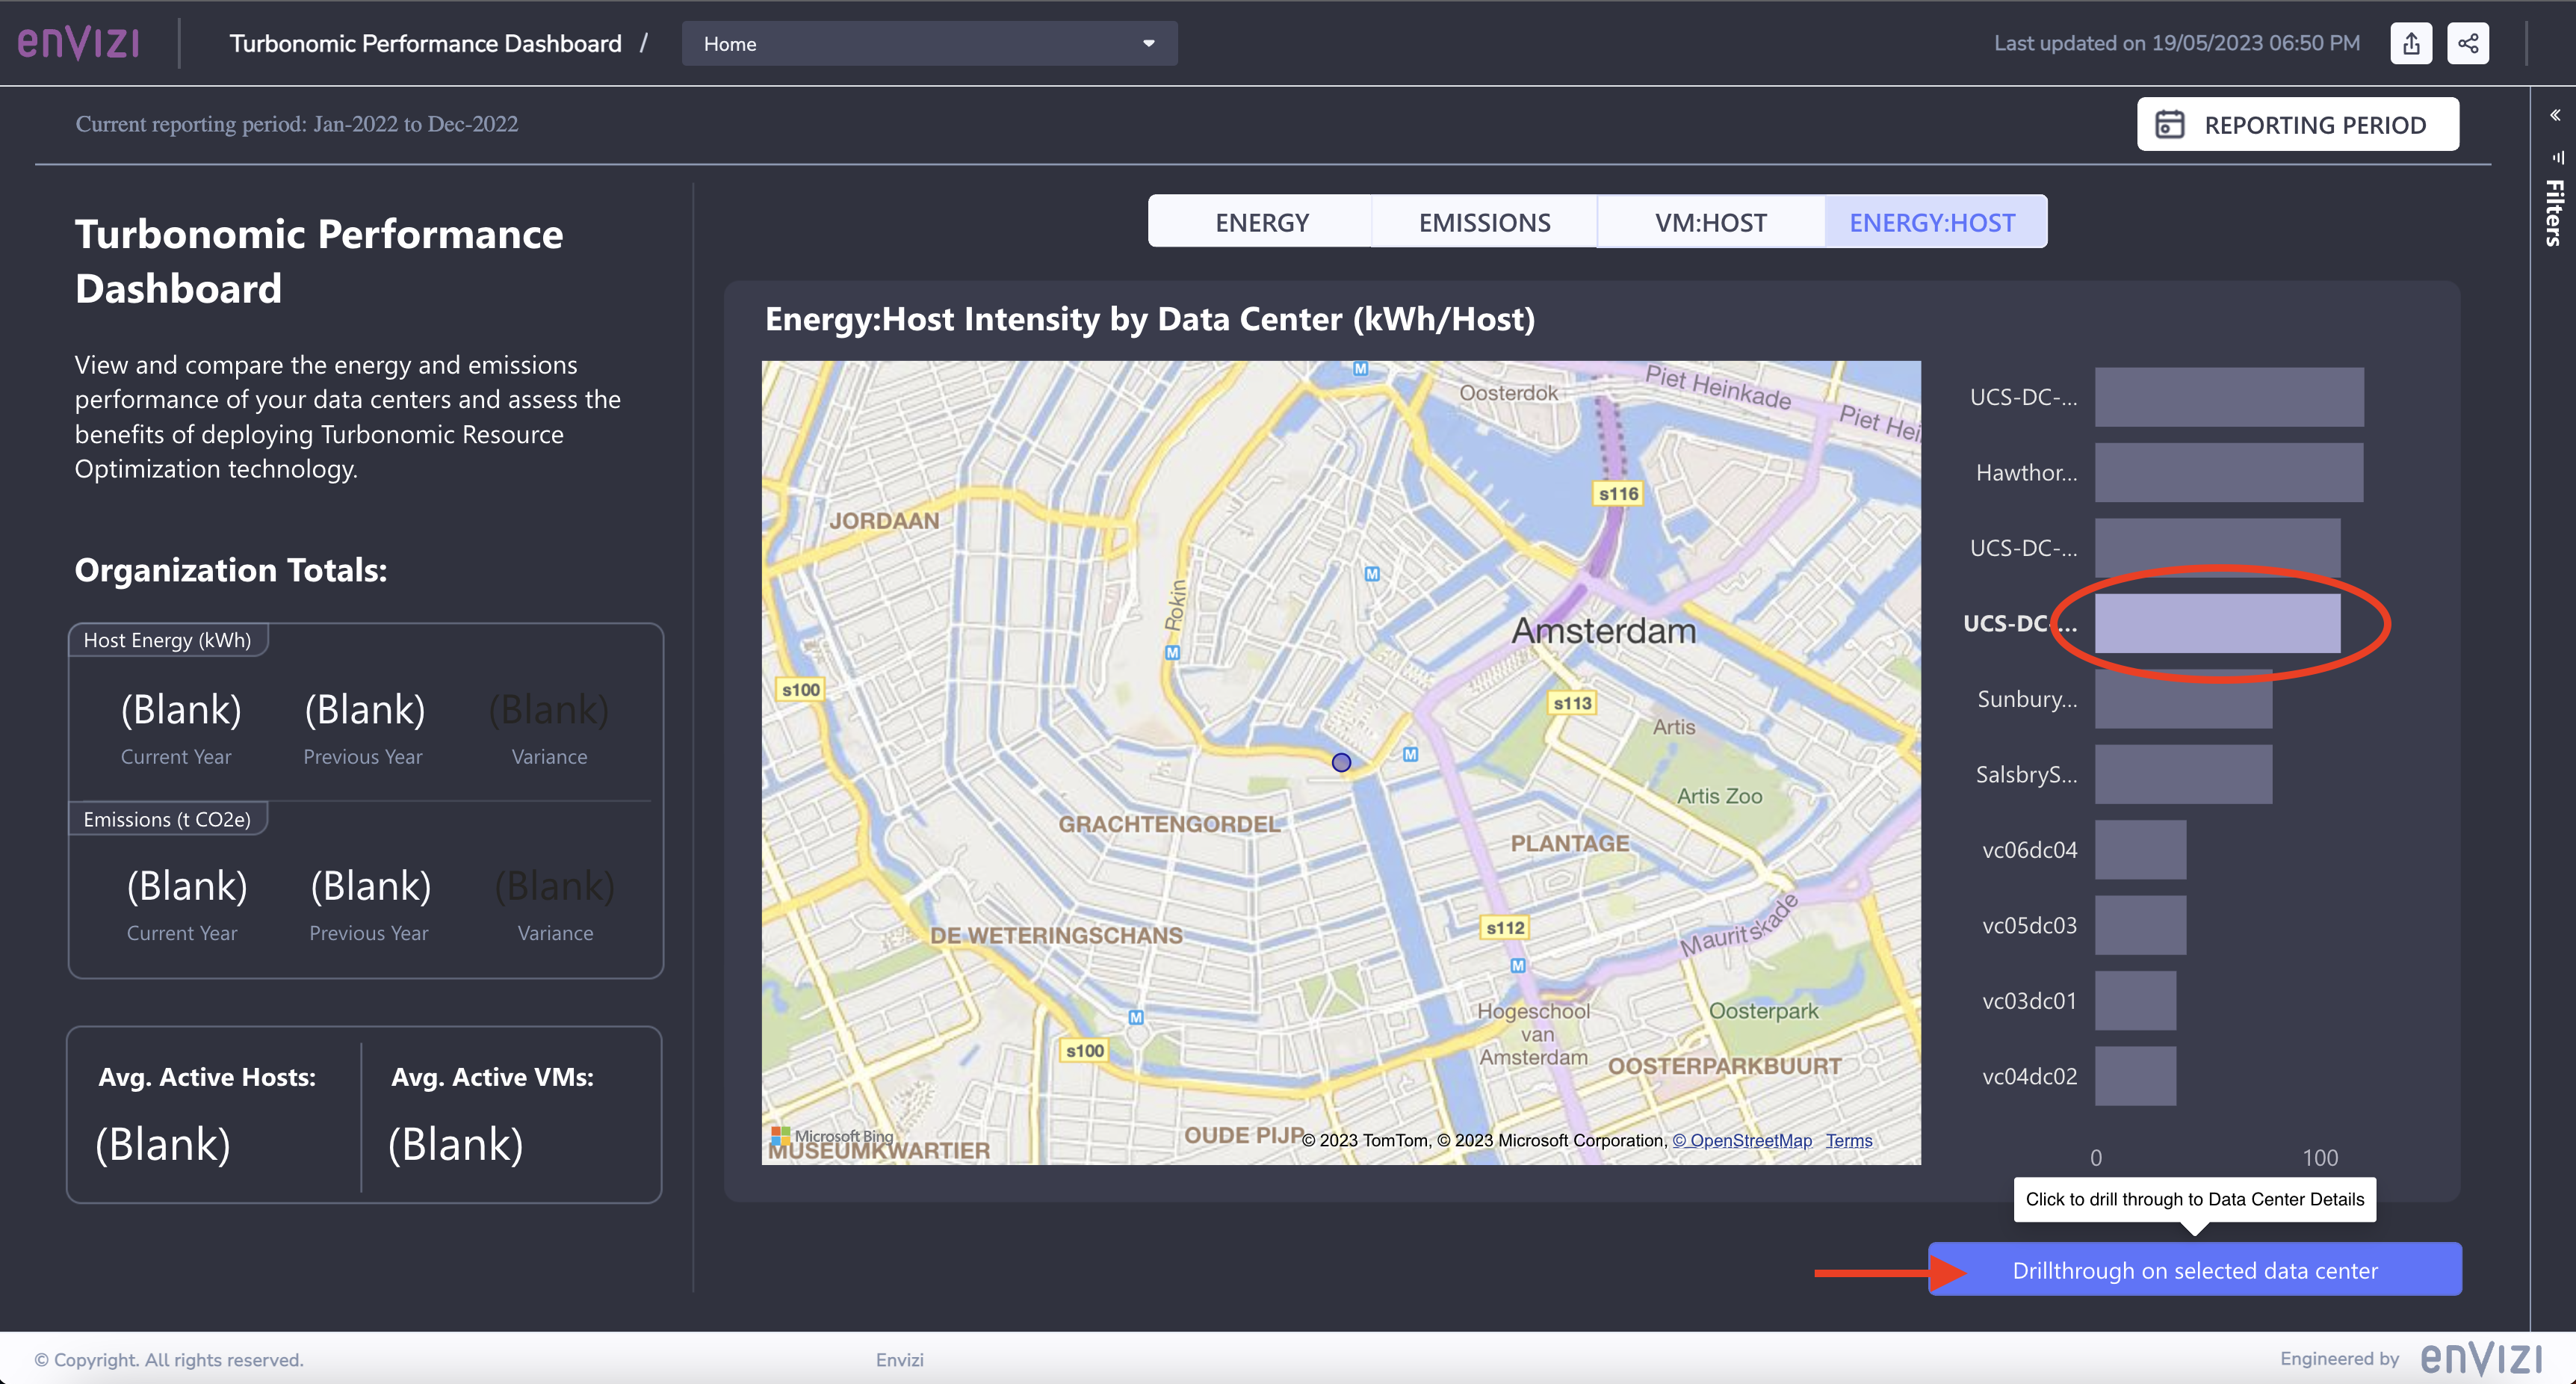
This brings us to the Data Center Summary page.
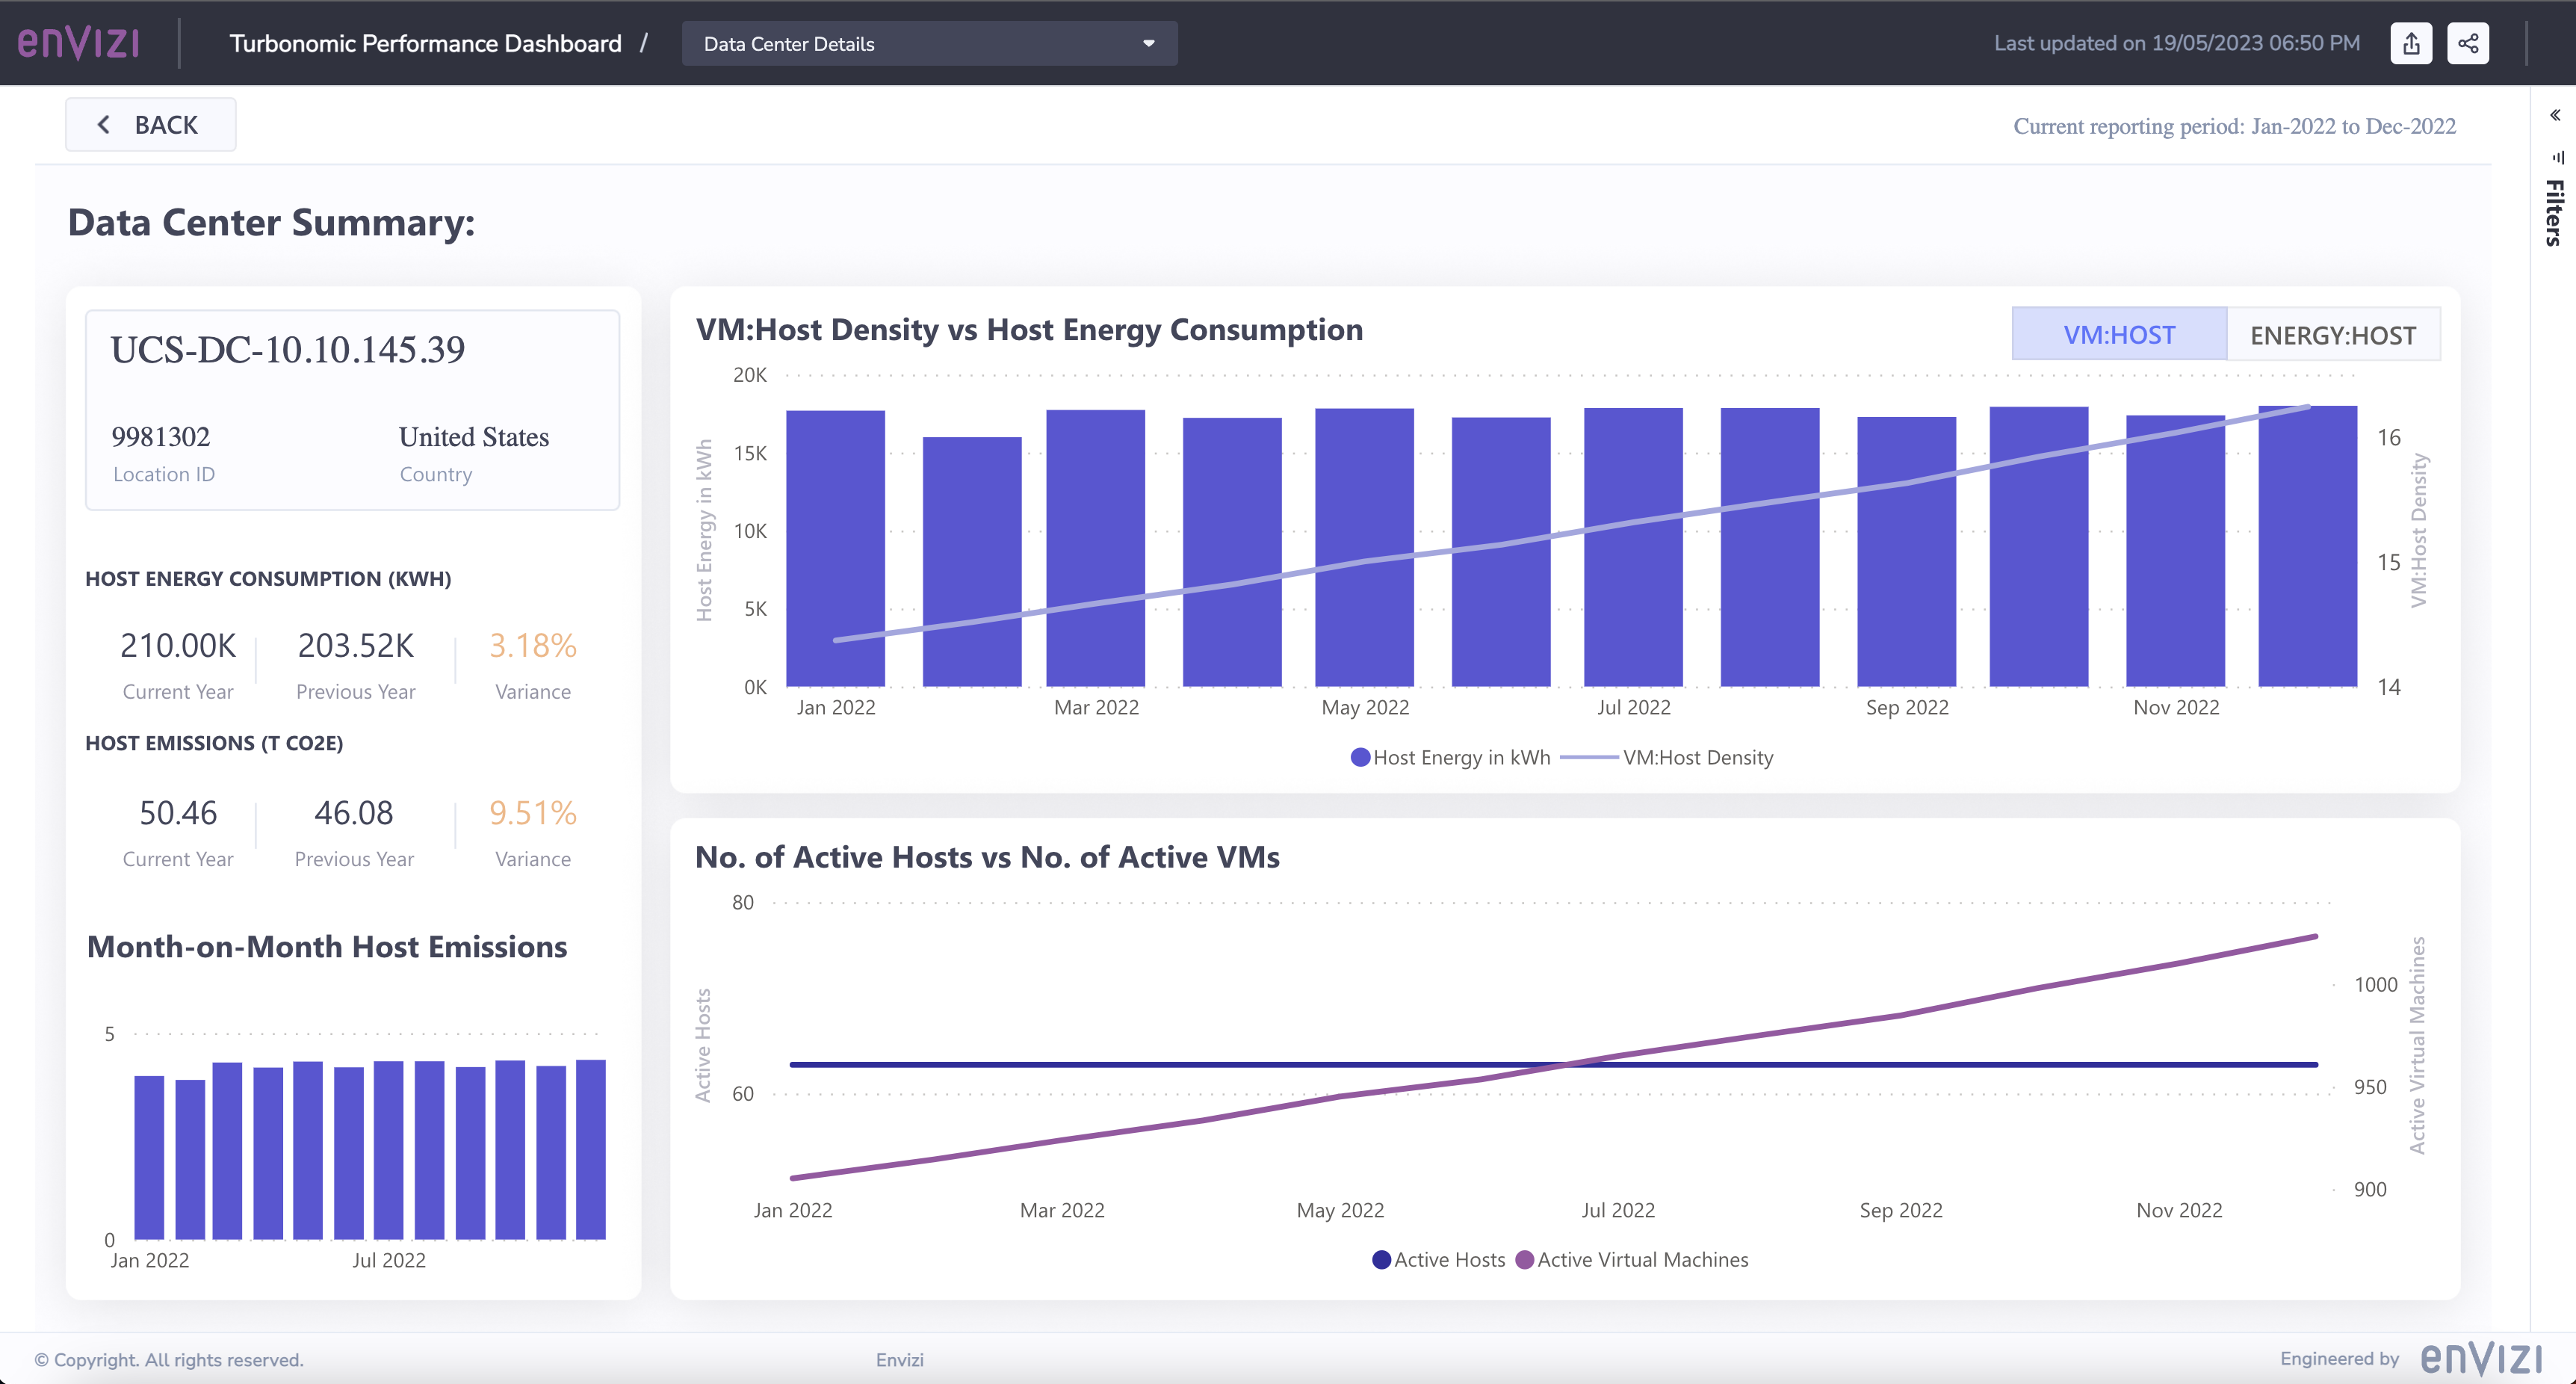
Left Panel
The left side panel shows the following info related to the selected data center.
- Name of the Data center
- Location Id
- Country
Host Energyof Current Year (210.00K), Previous Year (203.52K) and variation (3.18%)Carbon Emissionsof Current Year (50.46), Previous Year (46.08) and variation (9.51%)- Month on Month Host emissions graph.
Center Panel
The top of the Center Panel shows VM:Host Density vs Host Energy Consumption graph.
The bottom of the Center Panel shows No. of Active Hosts vs No. of Active VMs graph.
2.1 VM:Host Density vs Host Energy Consumption
- Click on any of the month in the left panel.
The center panel get refreshed.

- Mouseover the in the
No. of Active Hosts vs No. of Active VMssection of the graph. It shows
- The
Active Hostsof the month is63 - The
Active VMsof the month is998
- Mouseover the in the
VM:Host Density vs Host Energy Consumptionsection of the graph. It shows
- The
Host Energyof the month is17,932.33 - The
VM Densityof the month is15.84
2.2 Energy:Host Intensity vs Host Energy Consumption
- Click on the
Energy:Hosttab in the Center panel.
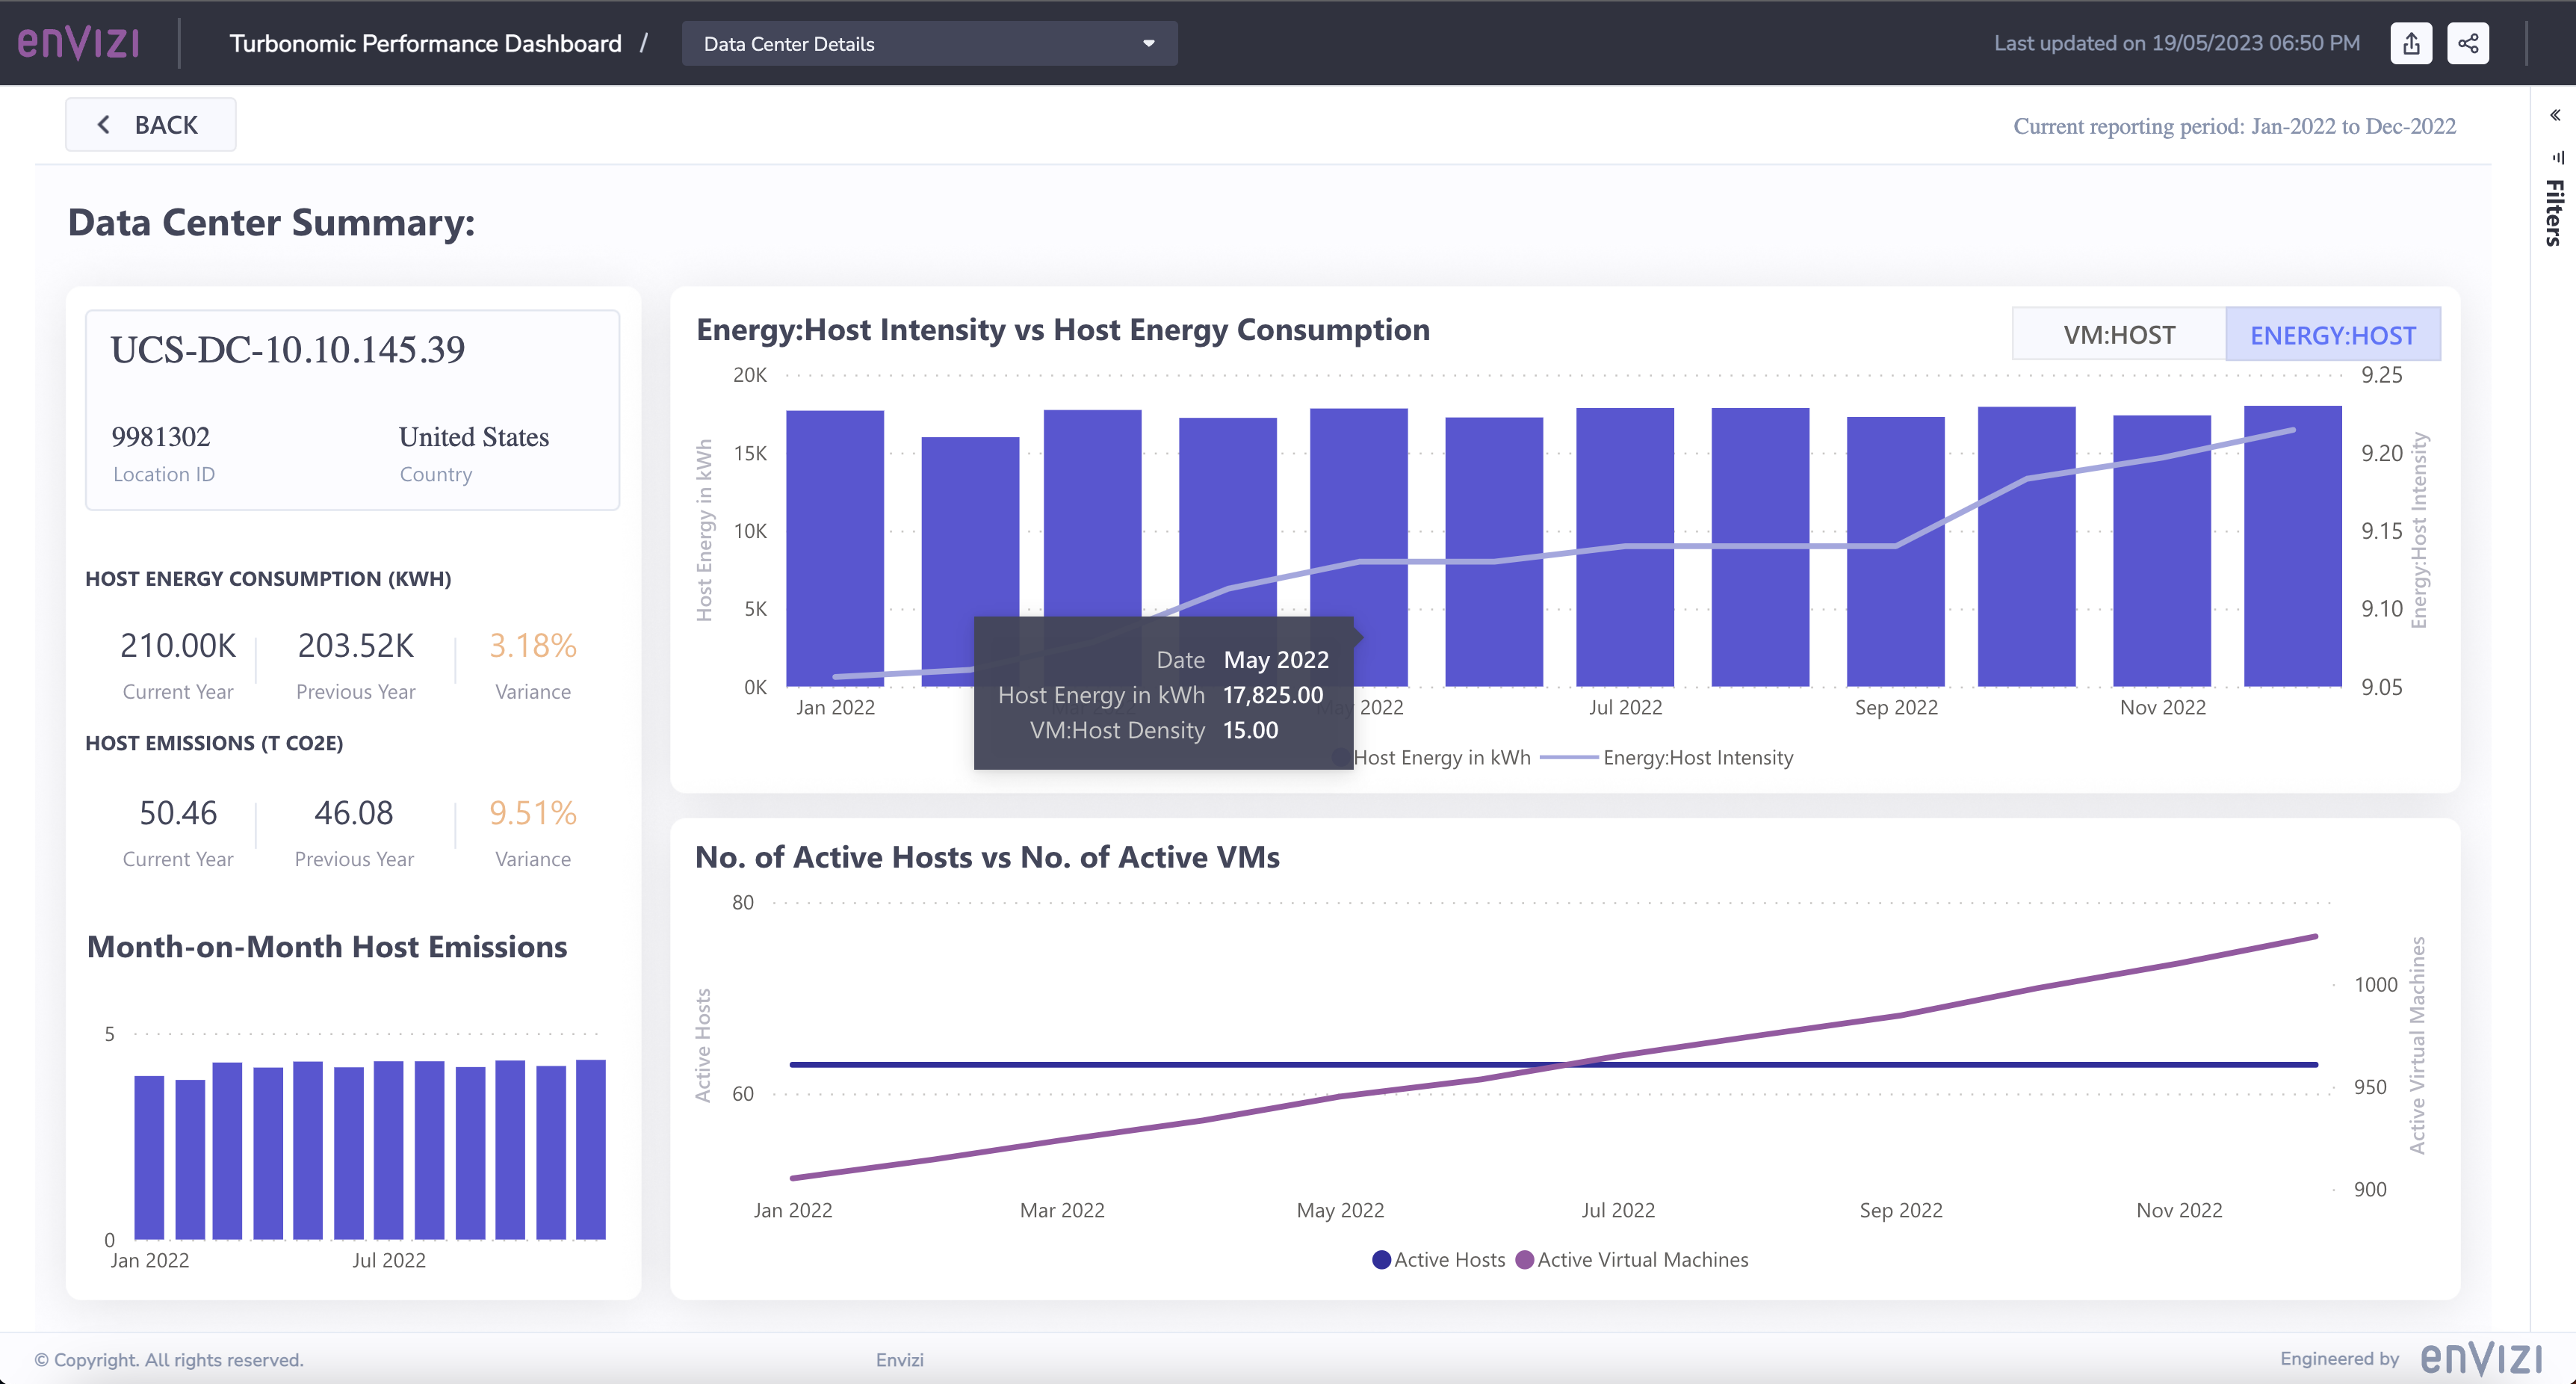
- Mouseover the in the
Energy:Host Intensity vs Host Energy Consumptionsection of the graph. It shows
- The
Host Energyfor May 2022 is17,825.00 - The
VM Host Densityof the month is15.00
Congratulations! You've finished with Envizi labs.