User Behavior Analytics (UBA)
Introduction
The IBM QRadar User Behavior Analytics (UBA) app helps you to determine the risk profiles of users inside your network and to take action when the app alerts you to threatening behavior. This lab guide provides a set of exercises that demonstrate how to use the QRadar User Behavior Analytics (UBA) application.
The QRadar User Behavior Analytics app is a tool for detecting insider threats in your organization. It is built on top of the app framework to use existing data in your QRadar environment to generate new insights around users and risk. UBA adds two major functions to QRadar: risk profiling and unified user identities.
Risk profiling is done by assigning risk to different security use cases. Examples might include simple rules and checks such as bad websites, or more advanced stateful analytics that use machine learning. Risk is assigned to each one depending on the severity and reliability of the incident detected. UBA uses existing event and flow data in your QRadar system to generate these insights and profile risks of users.
UBA uses three types of traffic that enrich UBA and enable more use cases to profile risk. The three types are as follows:
- Traffic around access, authentication, and account changes.
- User behavior on the network, so devices such as: proxies, firewalls, IPS, and VPNs.
- Endpoint and application logs, such as from Windows or Linux, and SaaS applications.
Unifying user identities is accomplished by combining disparate accounts for a user in QRadar. By importing data from an Active Directory, an LDAP server, Reference table, or CSV file, UBA can be taught what accounts belong to a user identity. This helps combine risk and traffic across the different user names in UBA.
The user risk profile is measured by a risk score that is a cumulative number assigned to the user, based on the log activity recorded in QRadar SIEM. UBA applies analytics and various machine learning algorithms to the vast QRadar SIEM data.
Machine Learning (ML app) is an add-on tool that augments the UBA app. It enables more rich and in-depth use cases that perform time series profiling and clustering. It is installed from within the UBA app, on the Machine Learning settings page. The ML app adds visualizations to the existing UBA app that show learned behavior (models), current behavior, and alerts. The models can use more than four weeks of historical data in QRadar to make the predictive models and baselines of what is normal for a user.
Prior to starting this lab please complete the setup exercise in 103: Advanced Lab Setup.
Return to the QRadar console at: 172.16.60.10.
Select Try the New UI from the left hamburger menu if the console is in classic mode.
Setup for Machine Learning
In this lab we will setup the environment to mimic an existing environment in order to run Machine Learning.
Populate ML the data
If you are using the WireGuard VPN configured in 101: QRadar Demo Setup to access the demo environment then you can perform the following activities from your workstation. If you have not configured VPN access you can perform the activities from the jump server.
- Login to the QRadar server
ssh root@172.16.60.10bash
-
Enter the root password: "Q1d3m0"
-
Run the following commands:
cd /labfiles/UBA/ML
bashchmod +x ./back_date_data.sh
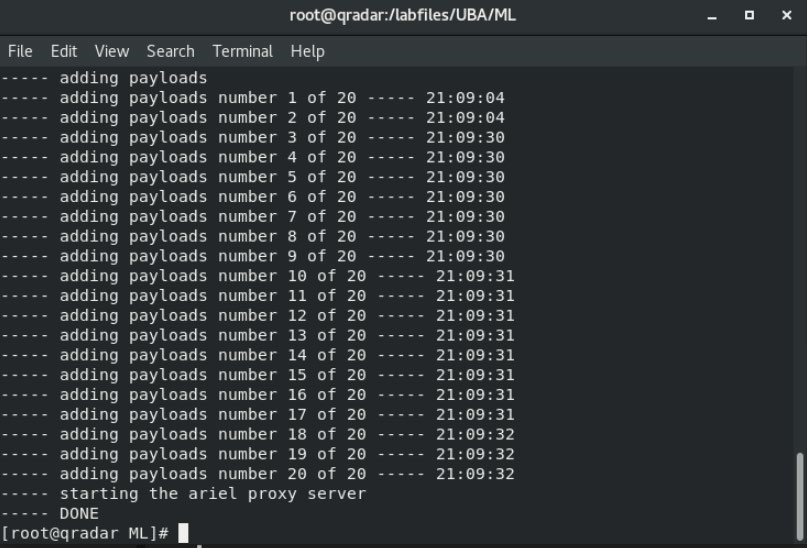
bash./back_date_data.shbash
Wait for the script to finish, so that you receive the command prompt back.
Install Machine Learning
-
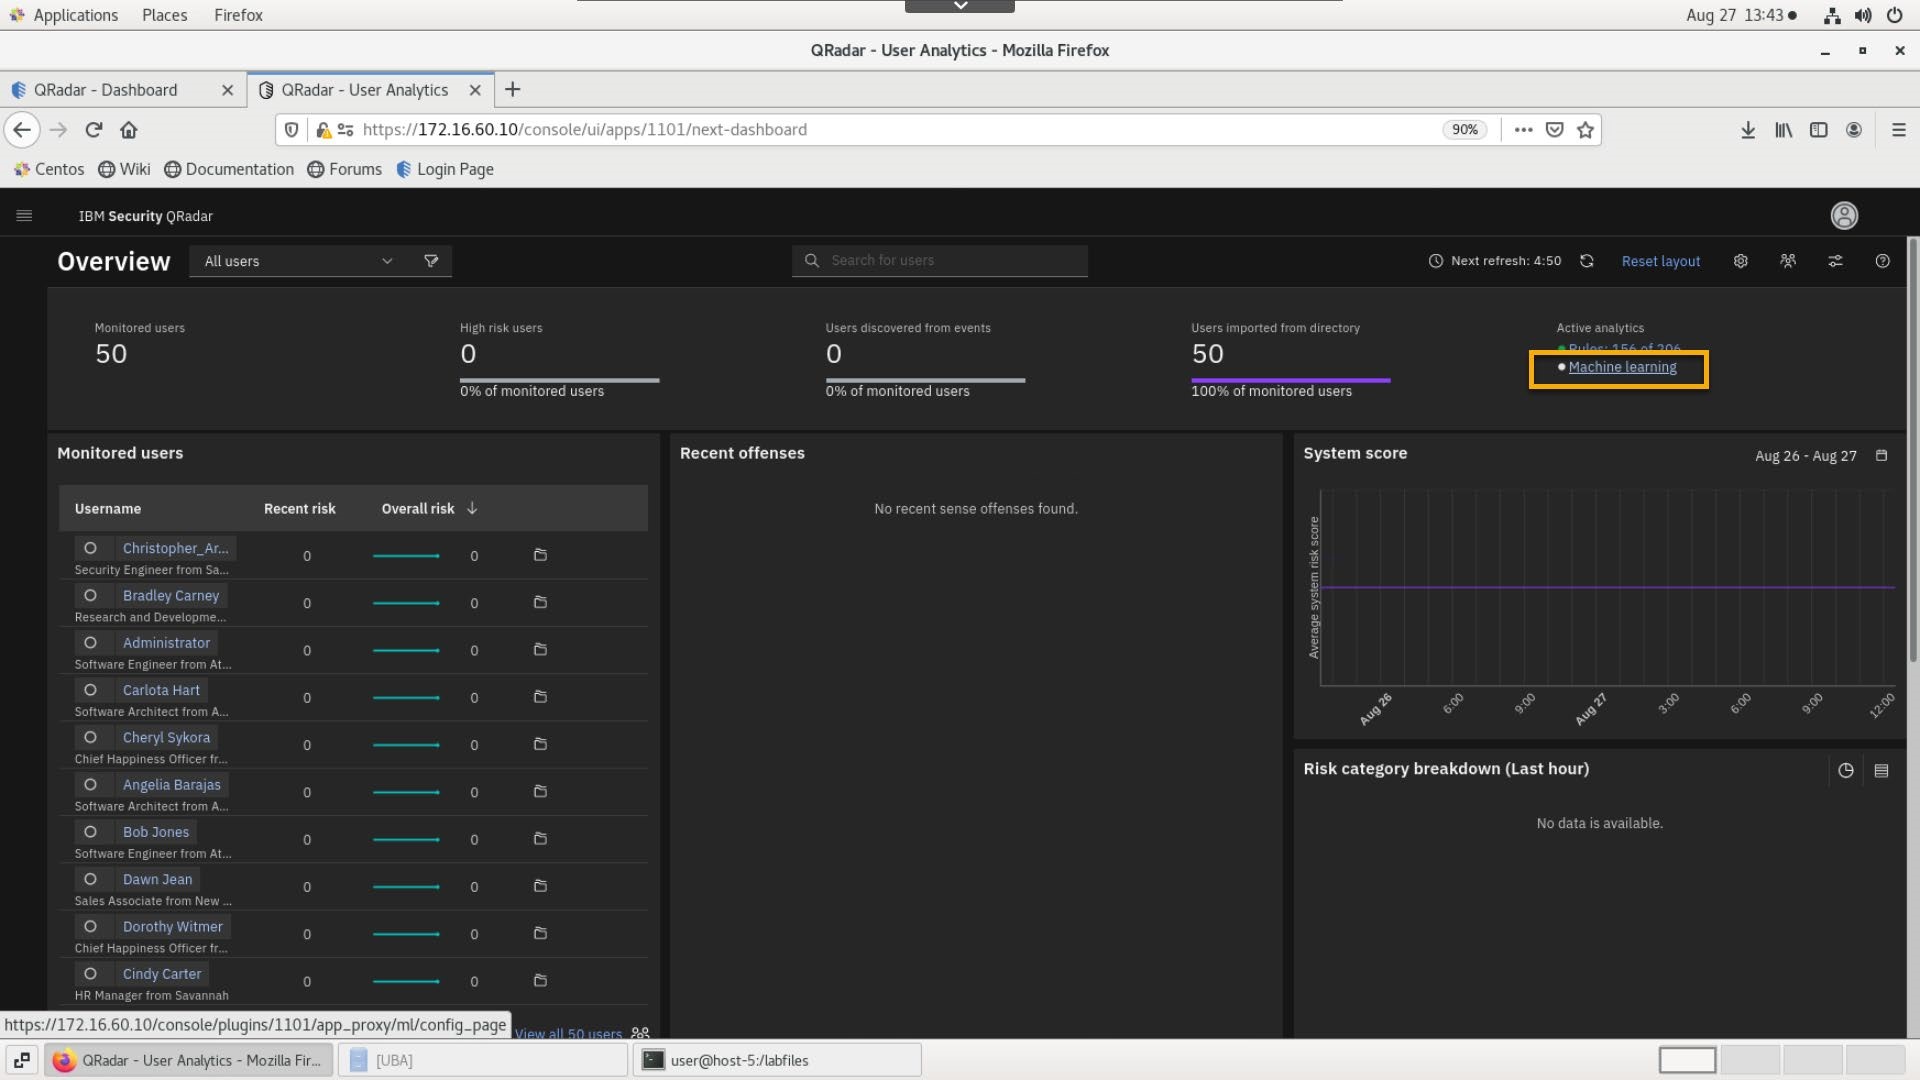
Using the browser, go back to the User Analytics.
-
Under Active analytics, select Machine Learning.
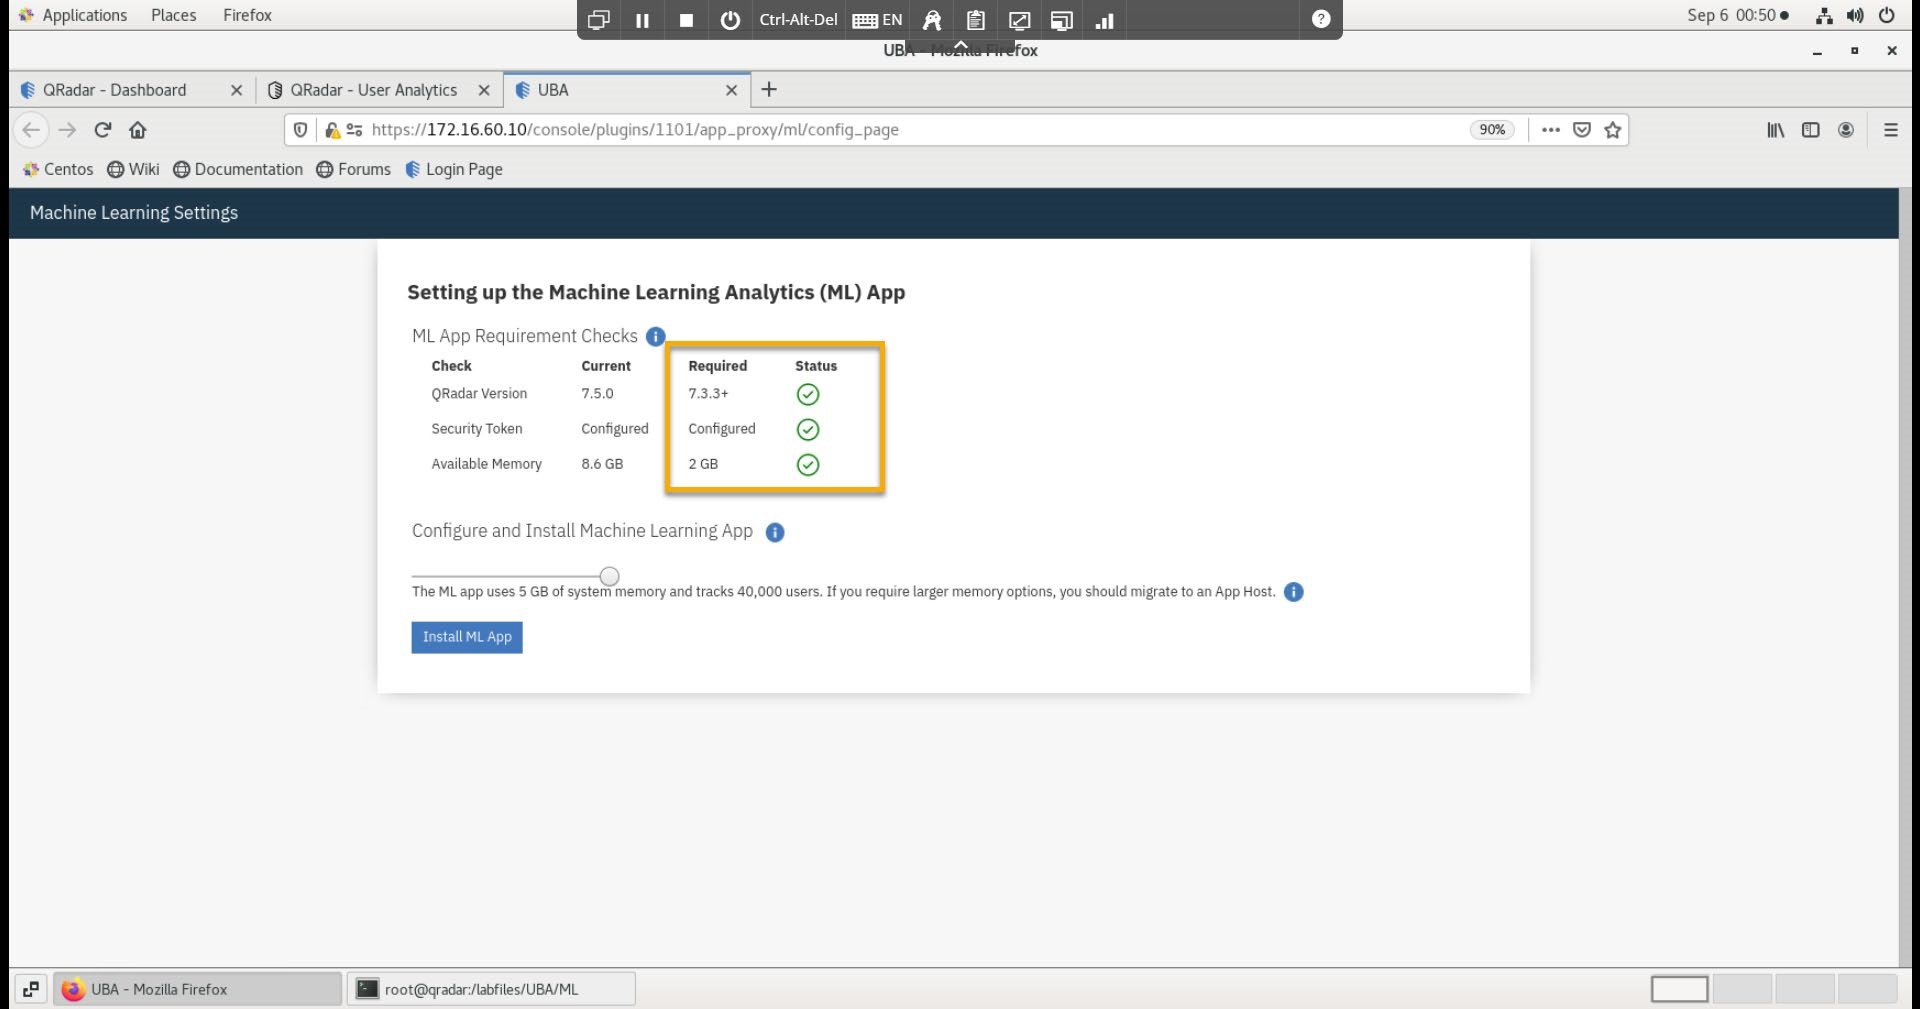
- On the Machine Learning Settings page, verify that all parameters are in the green status.
-
Click Install ML APP.
-
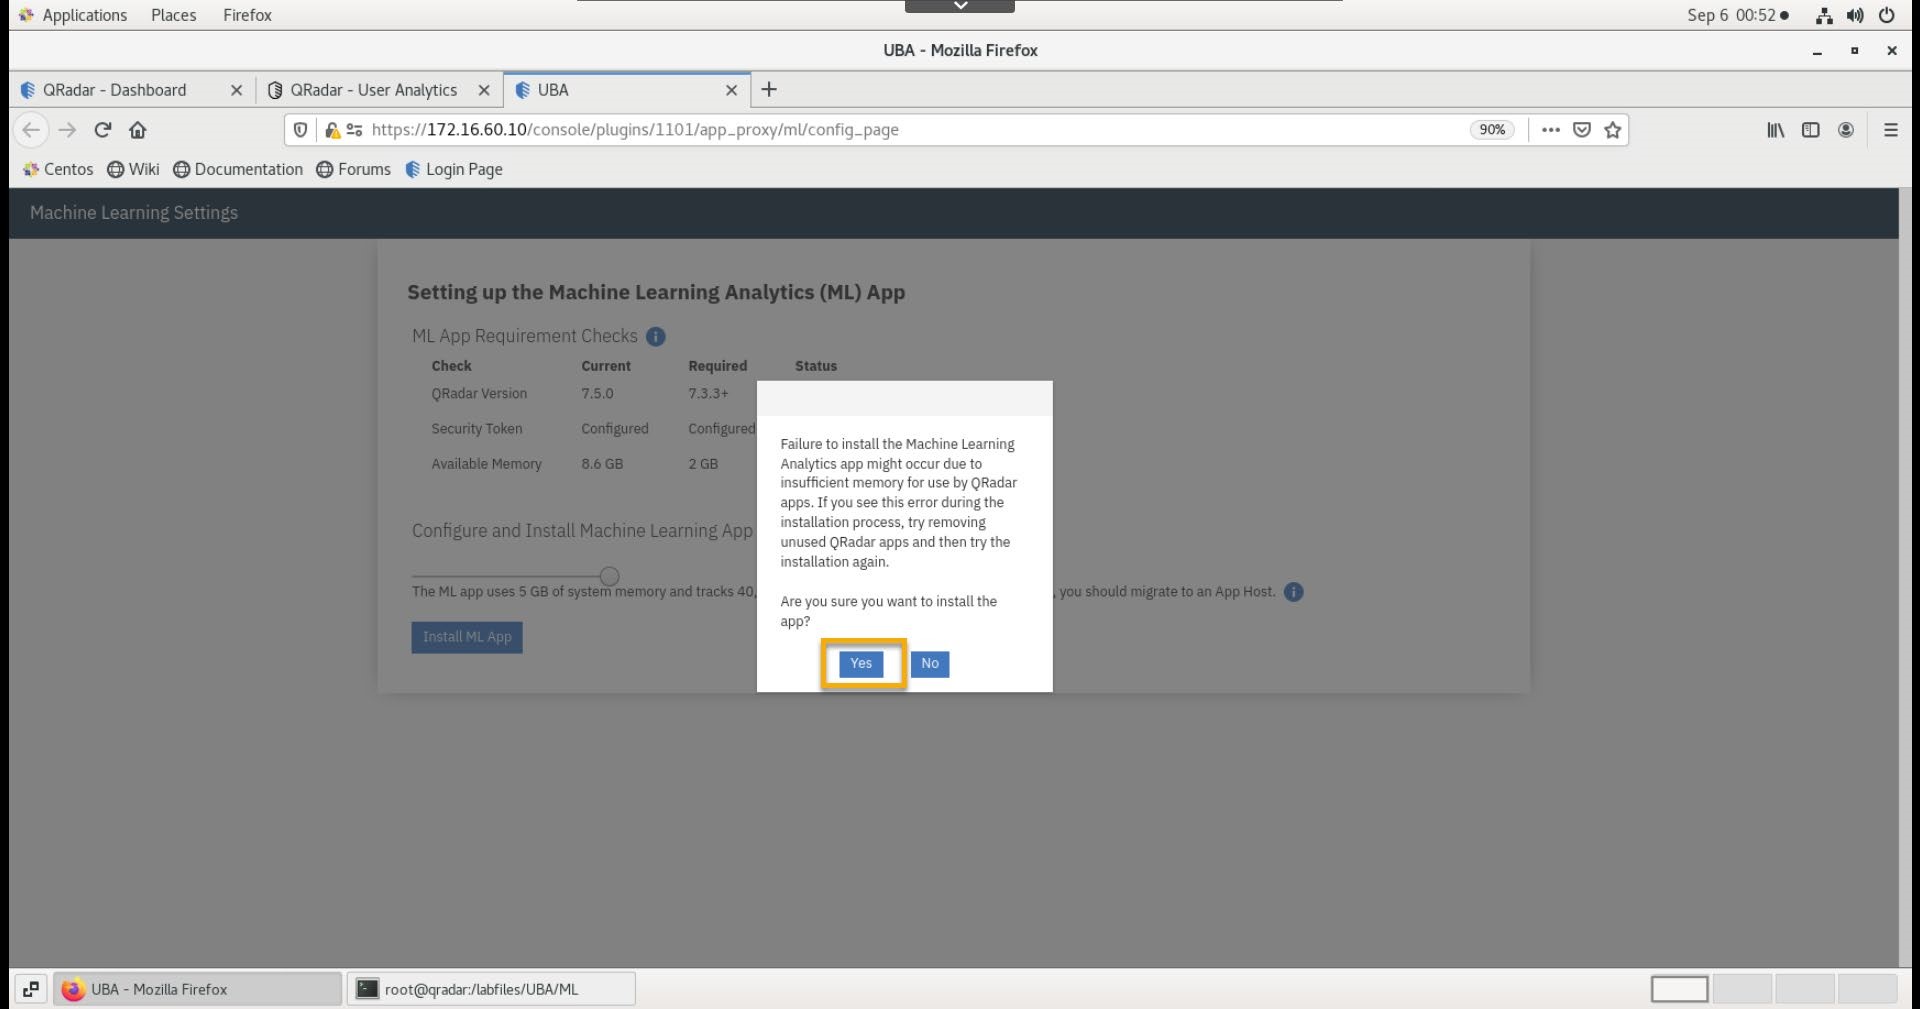
Select Yes on the confirmation dialog.
-
After a few minutes, the Machine Learning settings page will appear.
-
Close the Machine Learning Settings UBA tab.
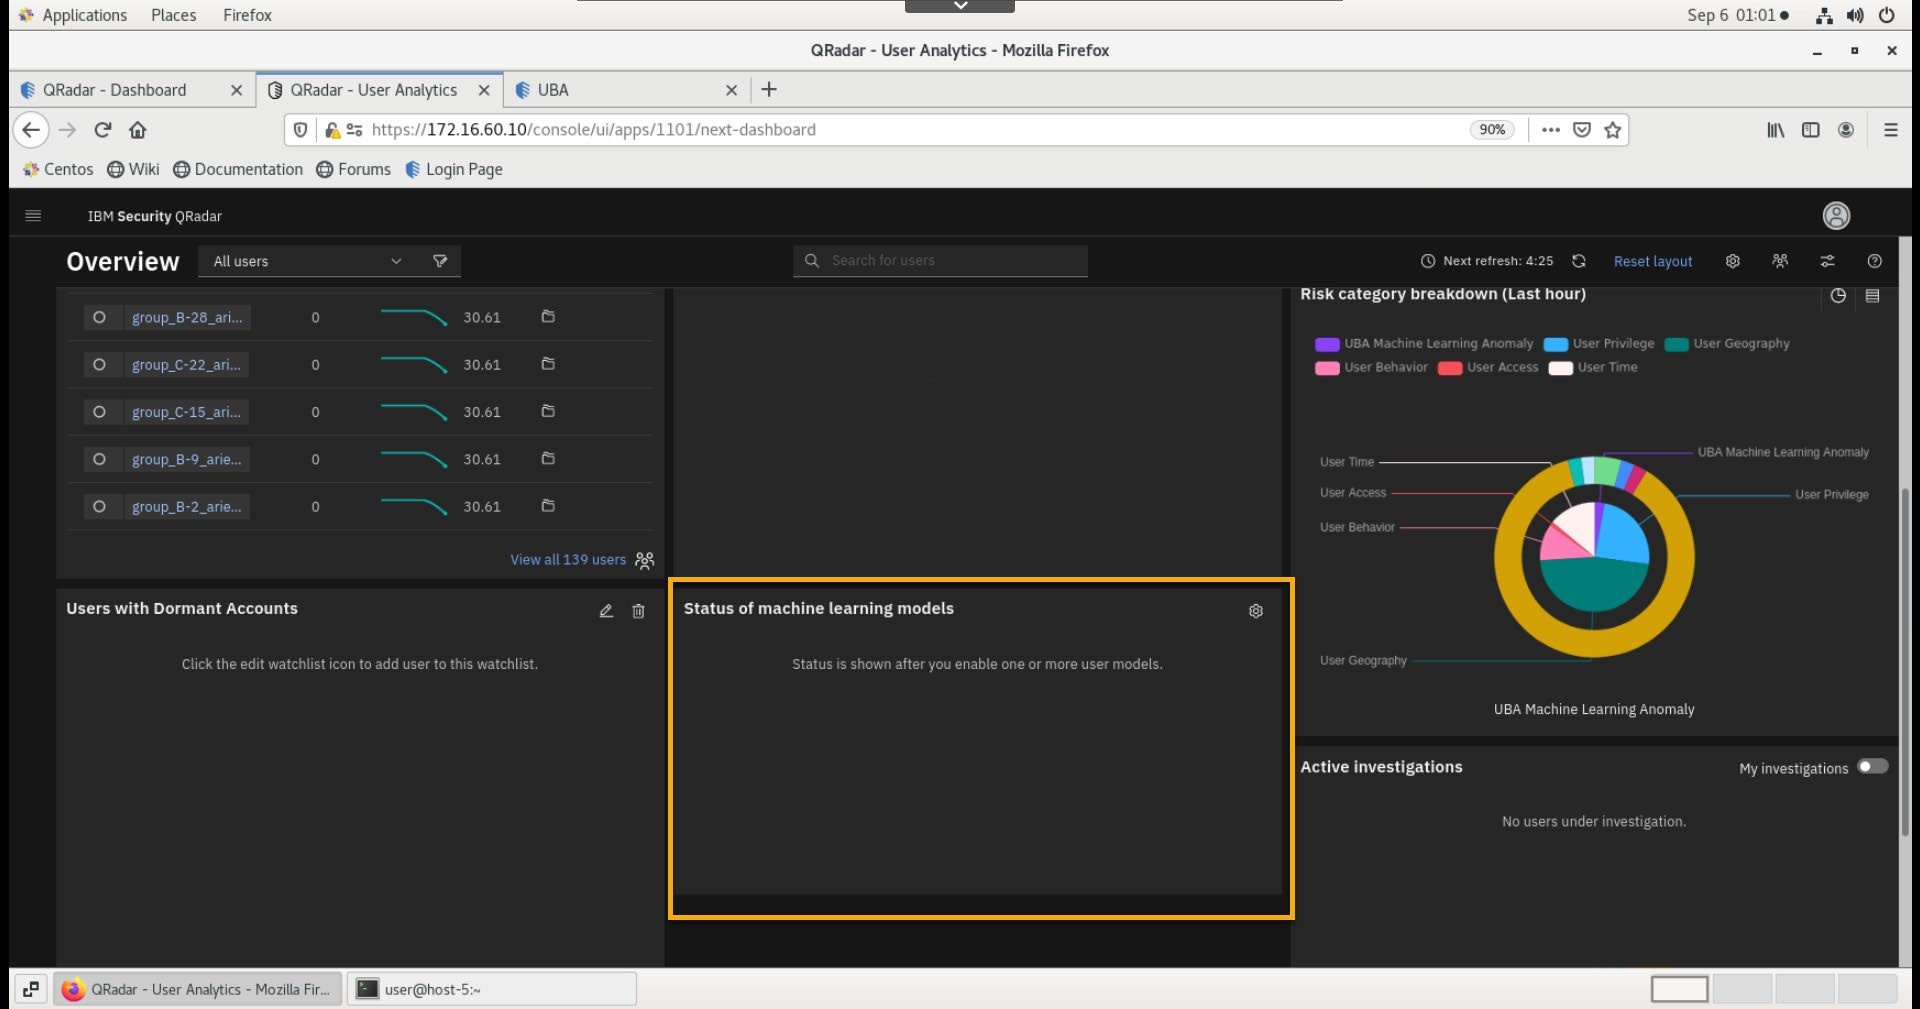
- On the Overview page, there should be a new widget, Status of machine learning models.
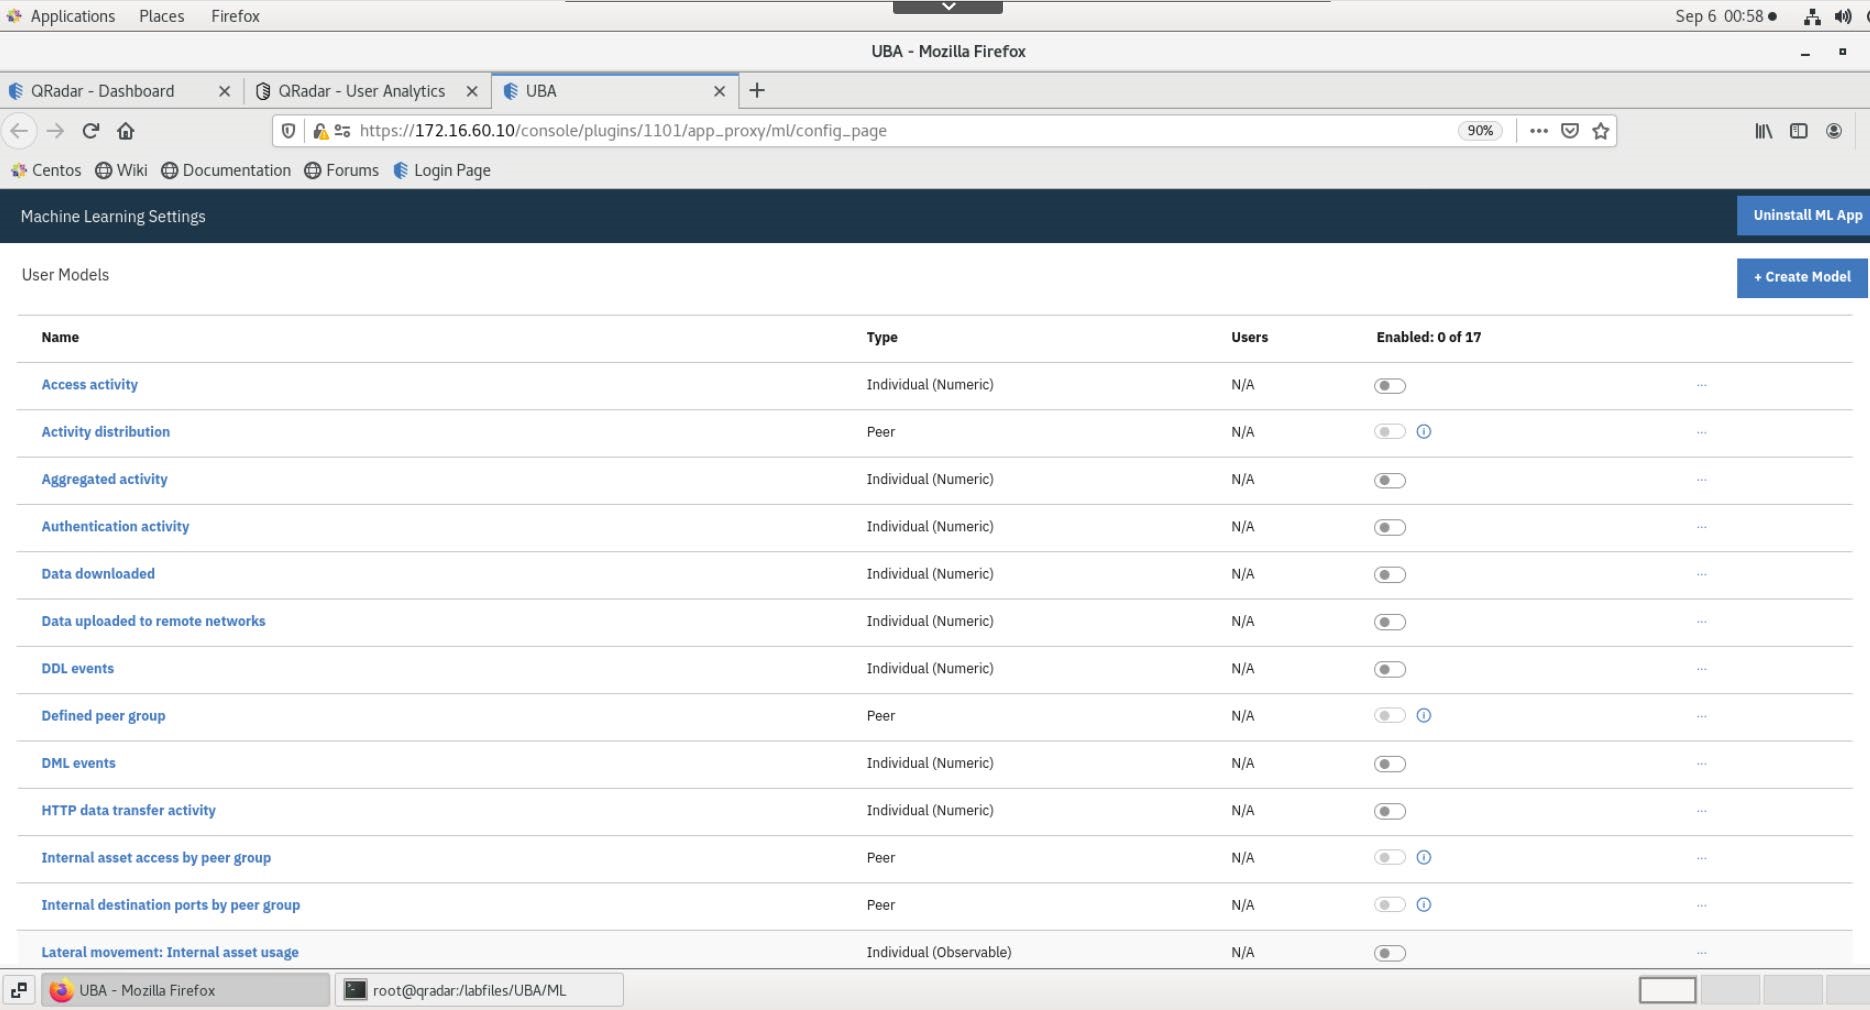
Create and Enable ML Models
In this lab we will create a new machine learning model, edit and existing model and enable models to be built.
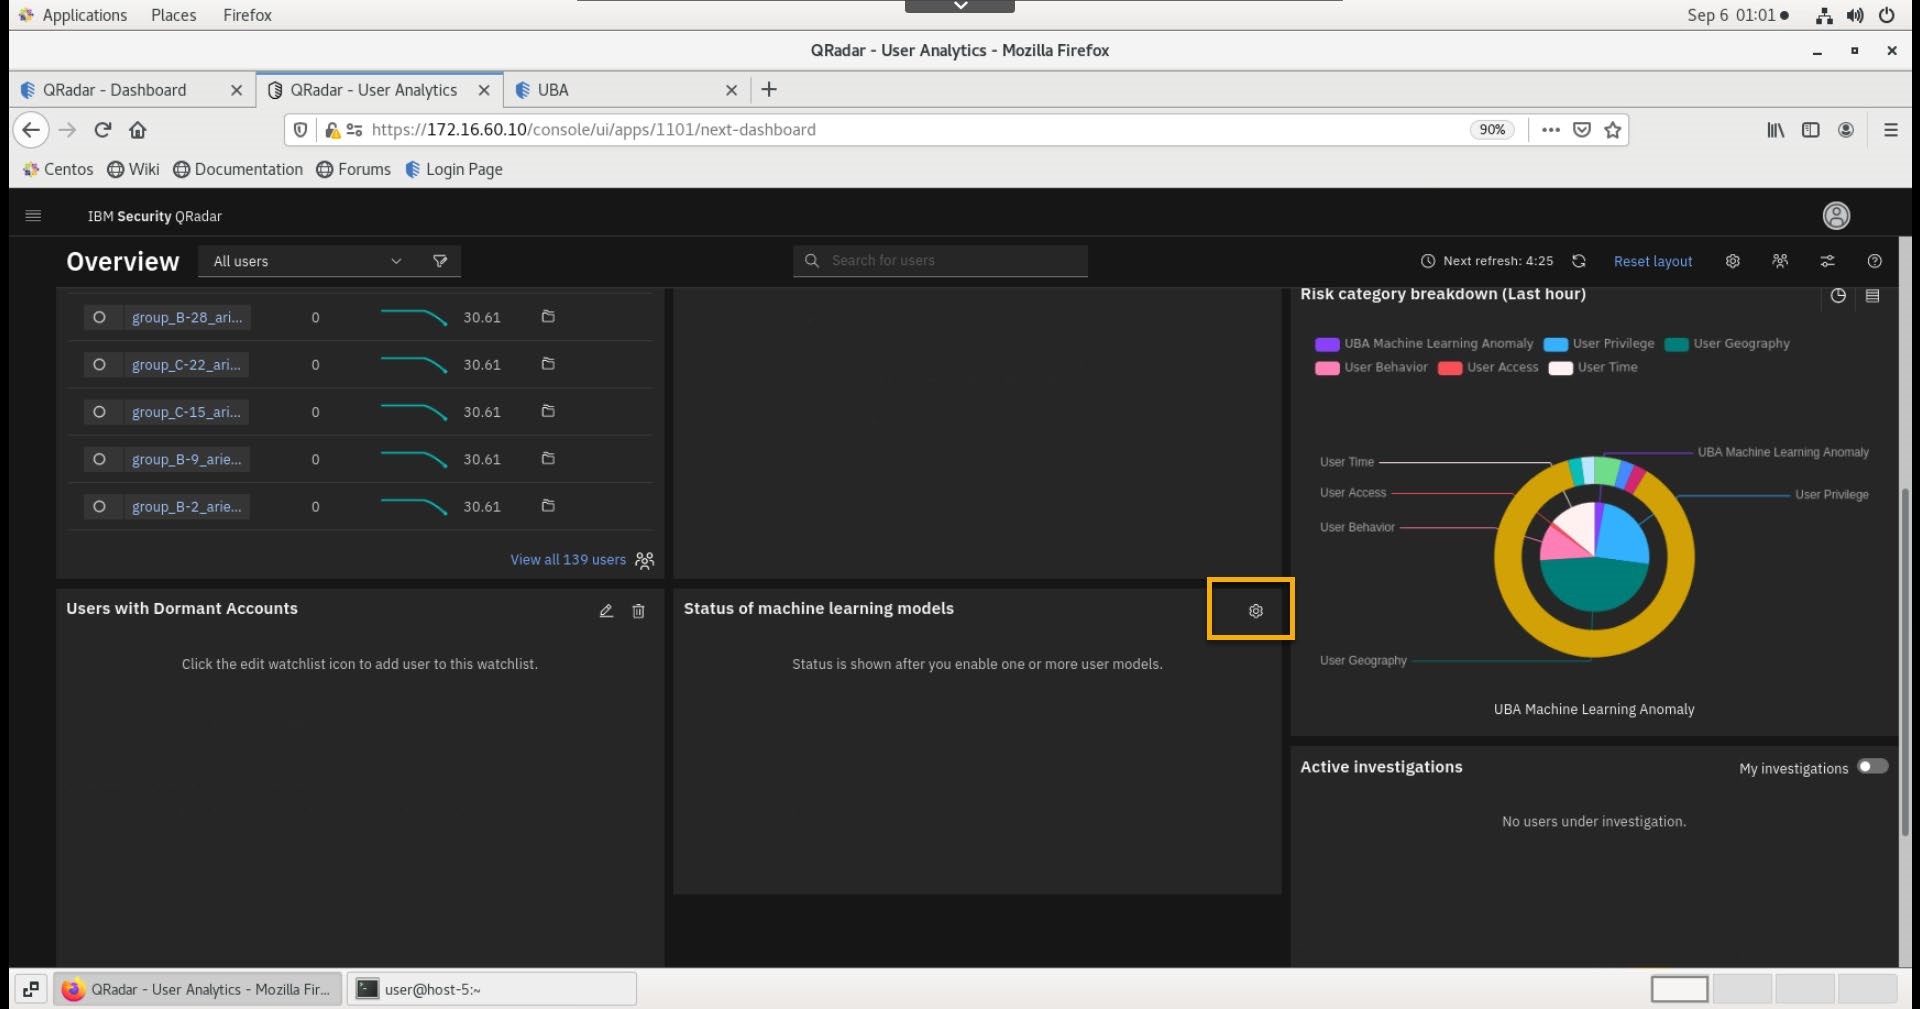
- On the Machine Learning status widget, click the settings icon.
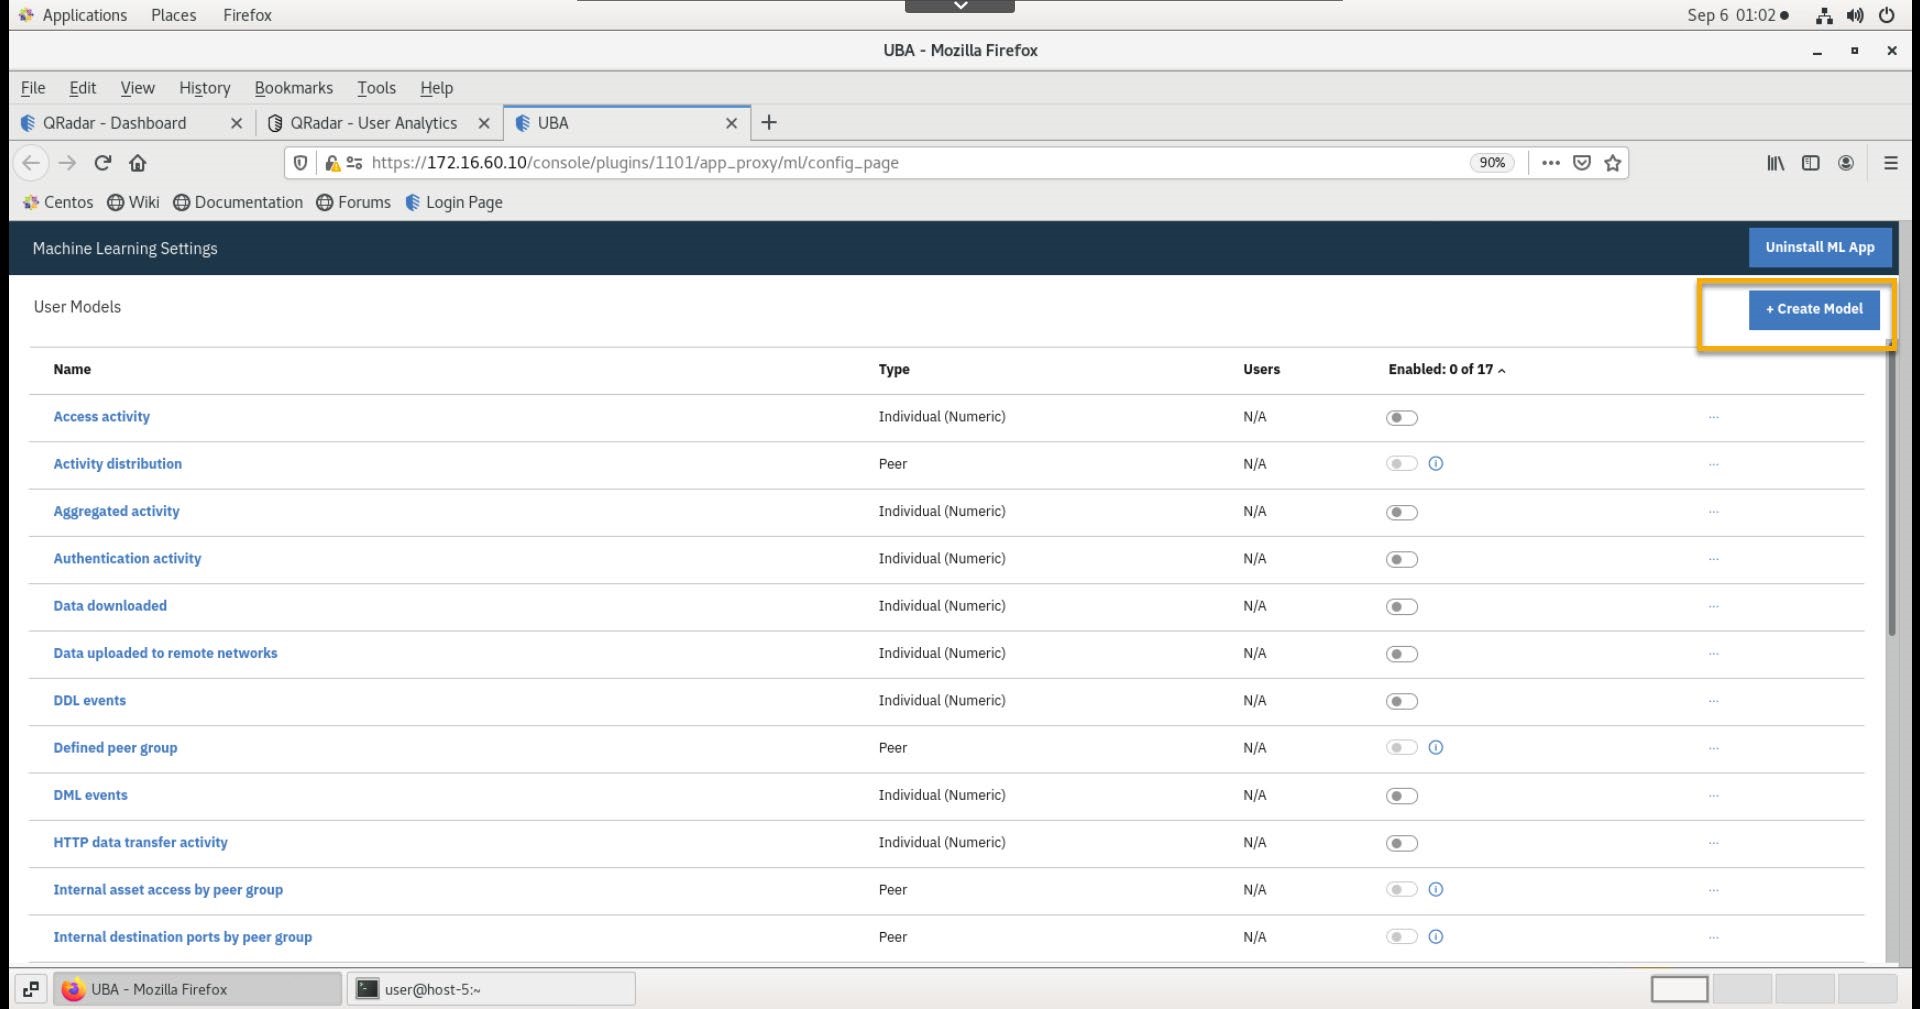
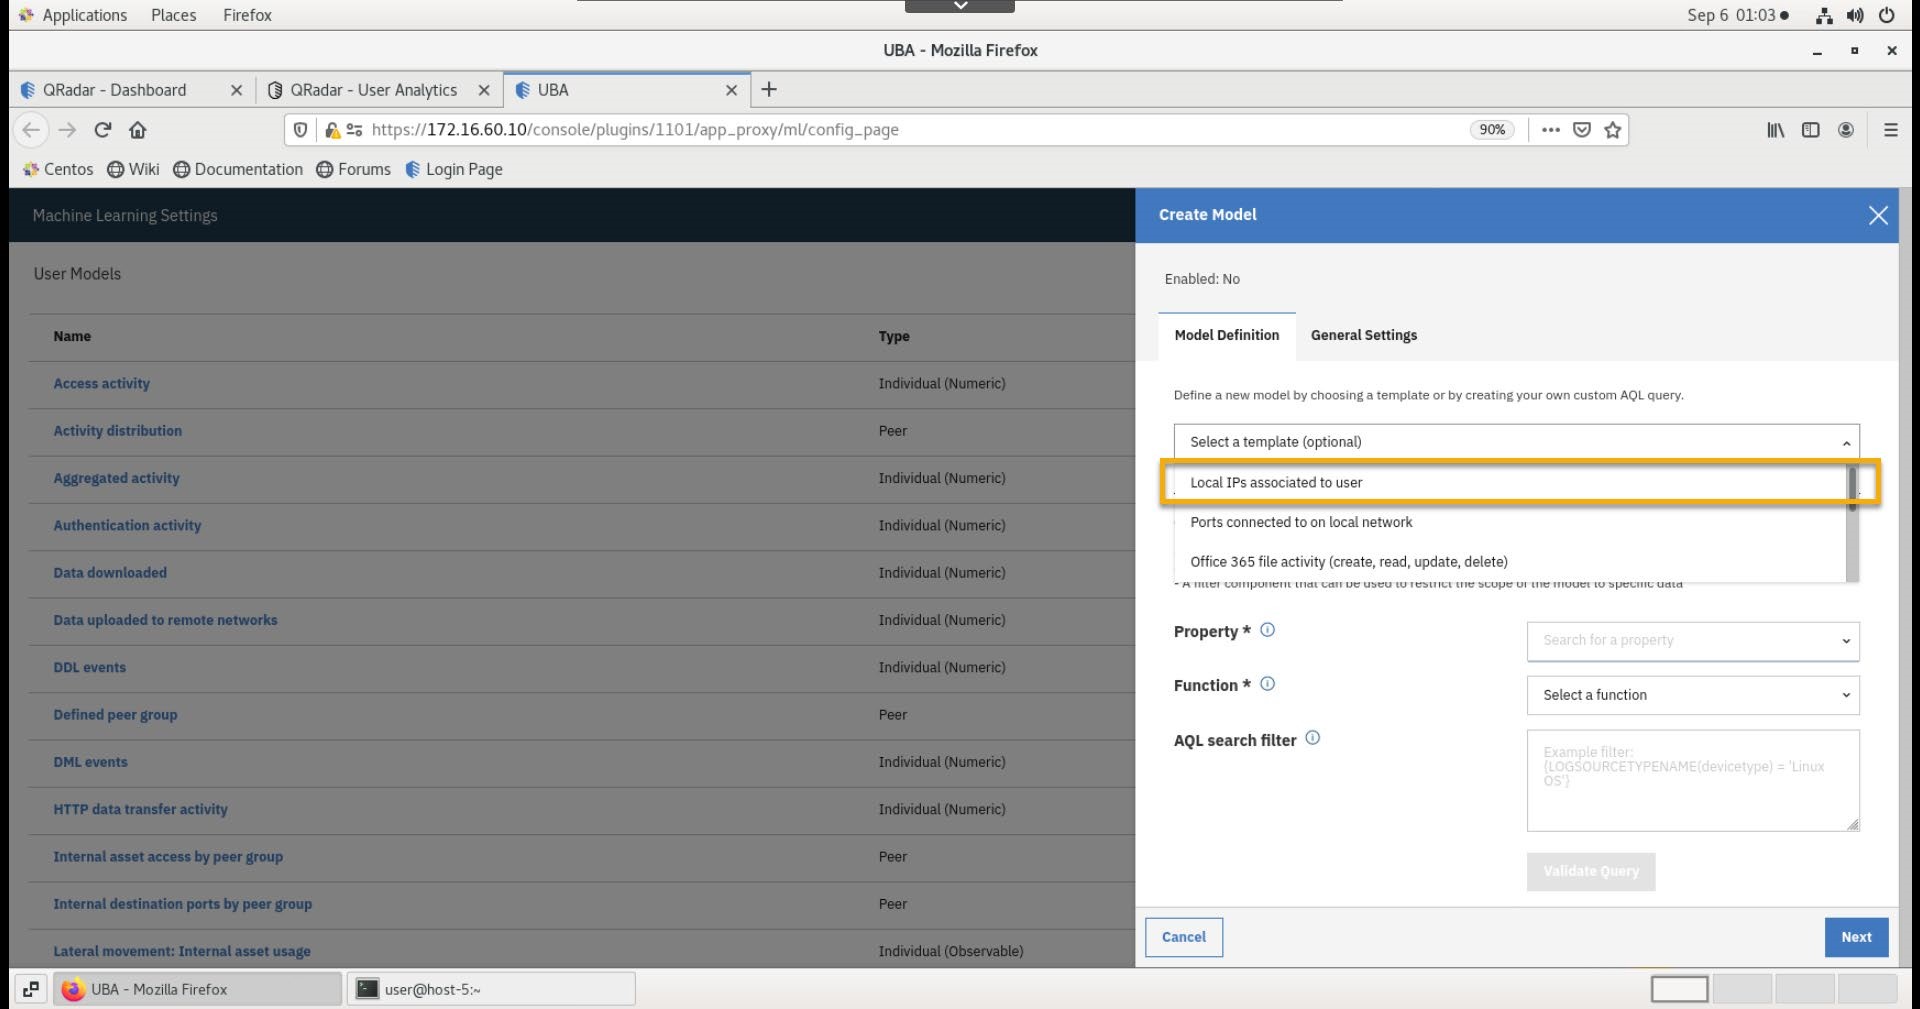
- On the Machine Learning setting page, click Create Model.
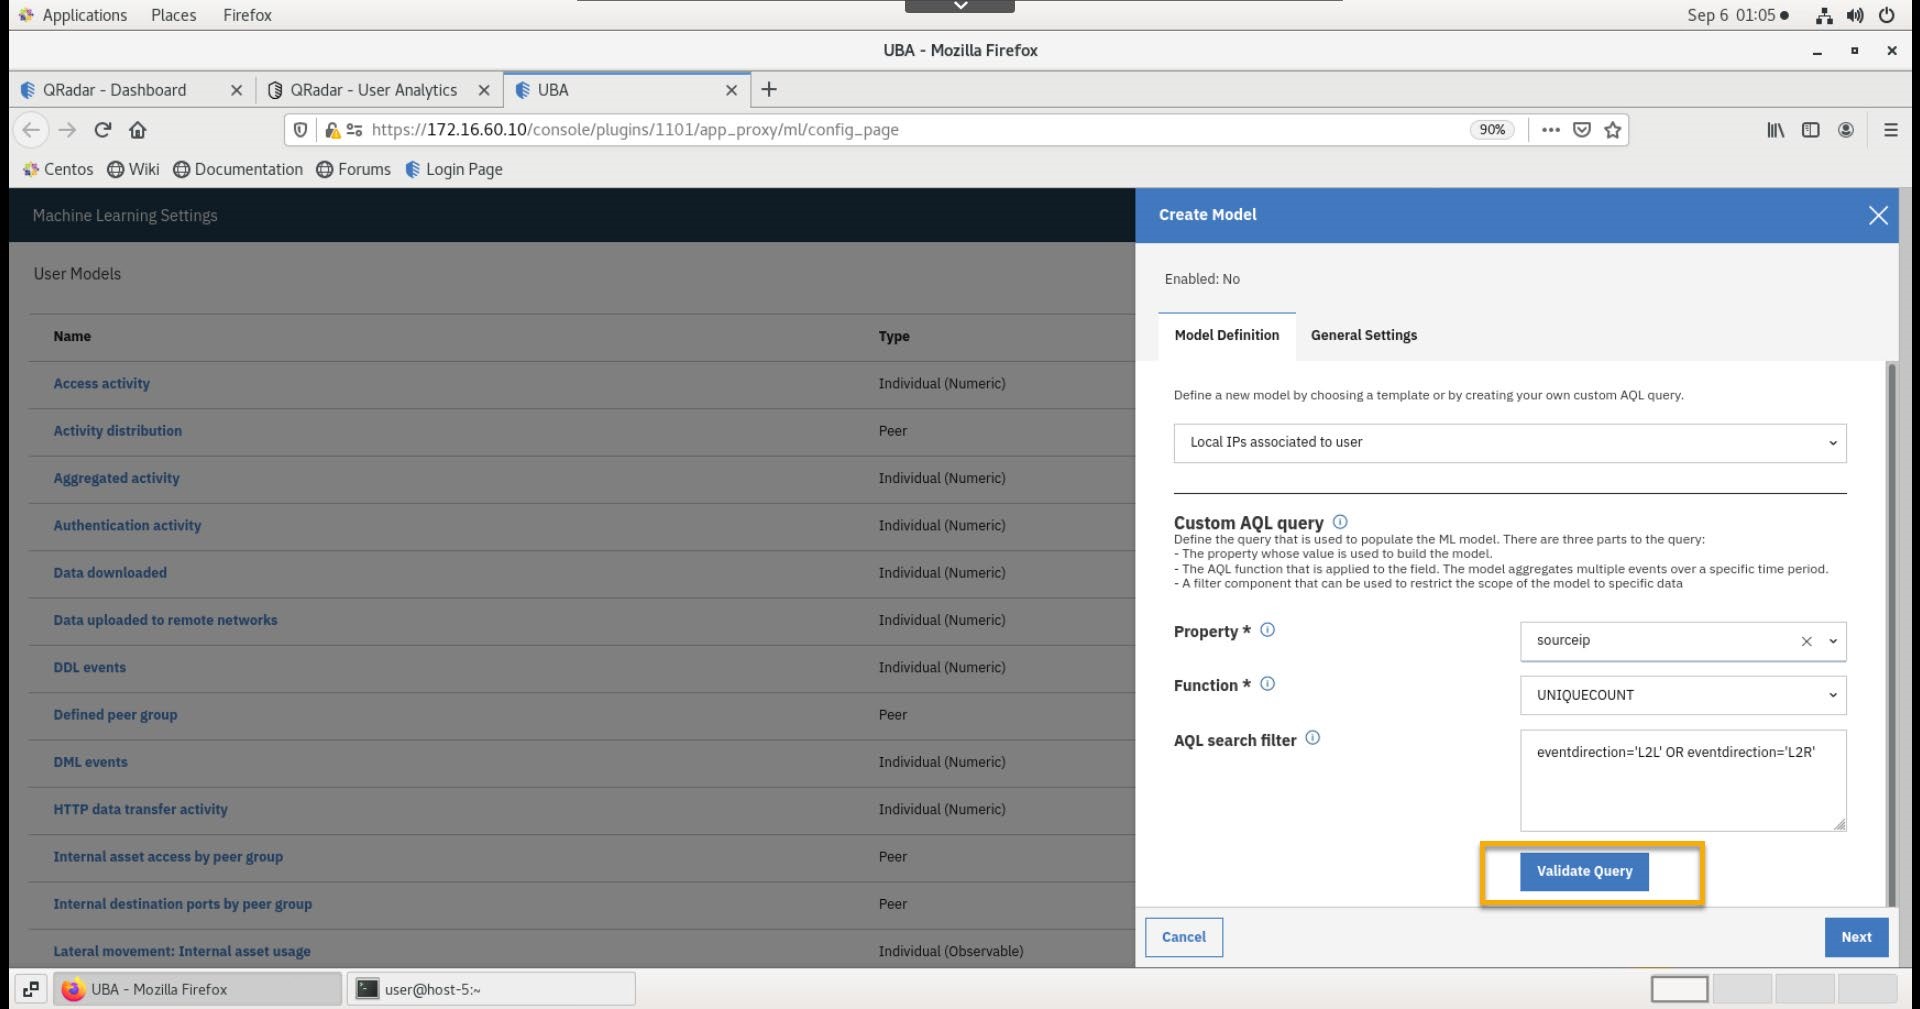
- In the new model dialog, for the template, select Local IPs associated to user.
- Click Validate Query.
- In the new browser tab, observe the information collected from the query.
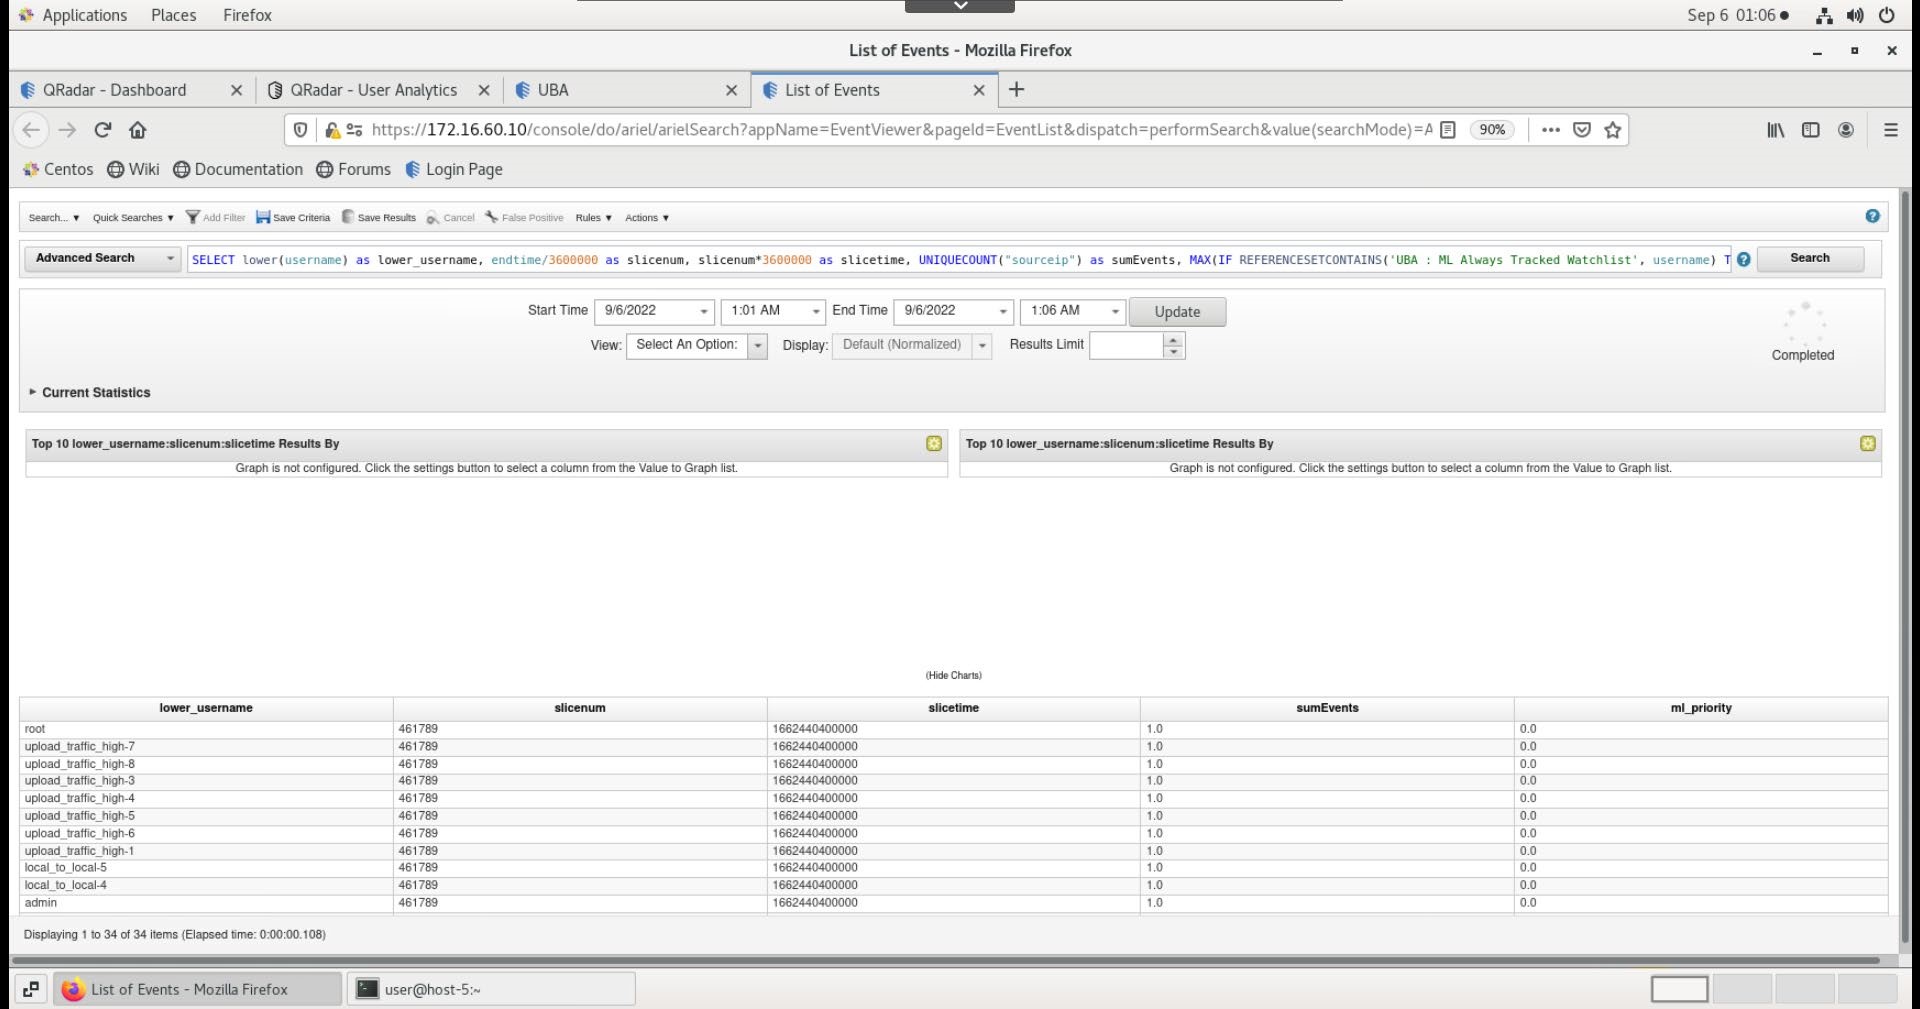
-
Close the List of Events tab.
-
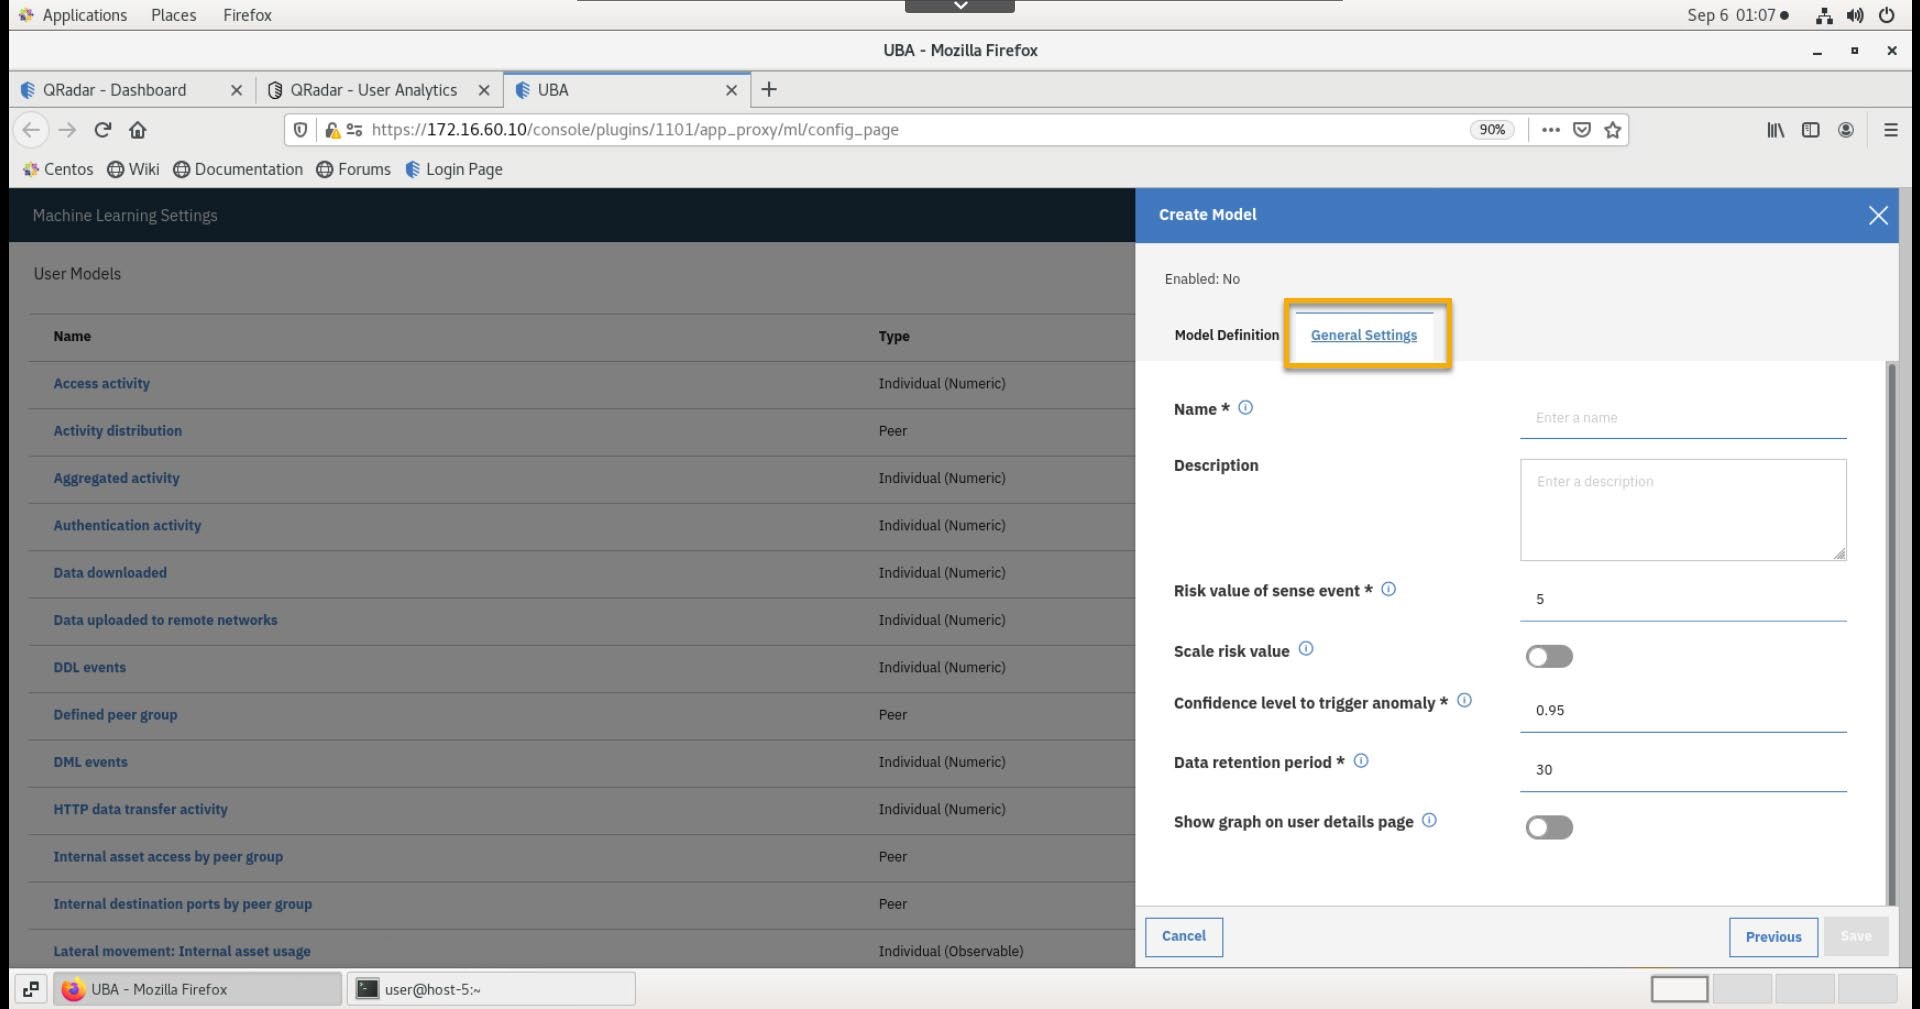
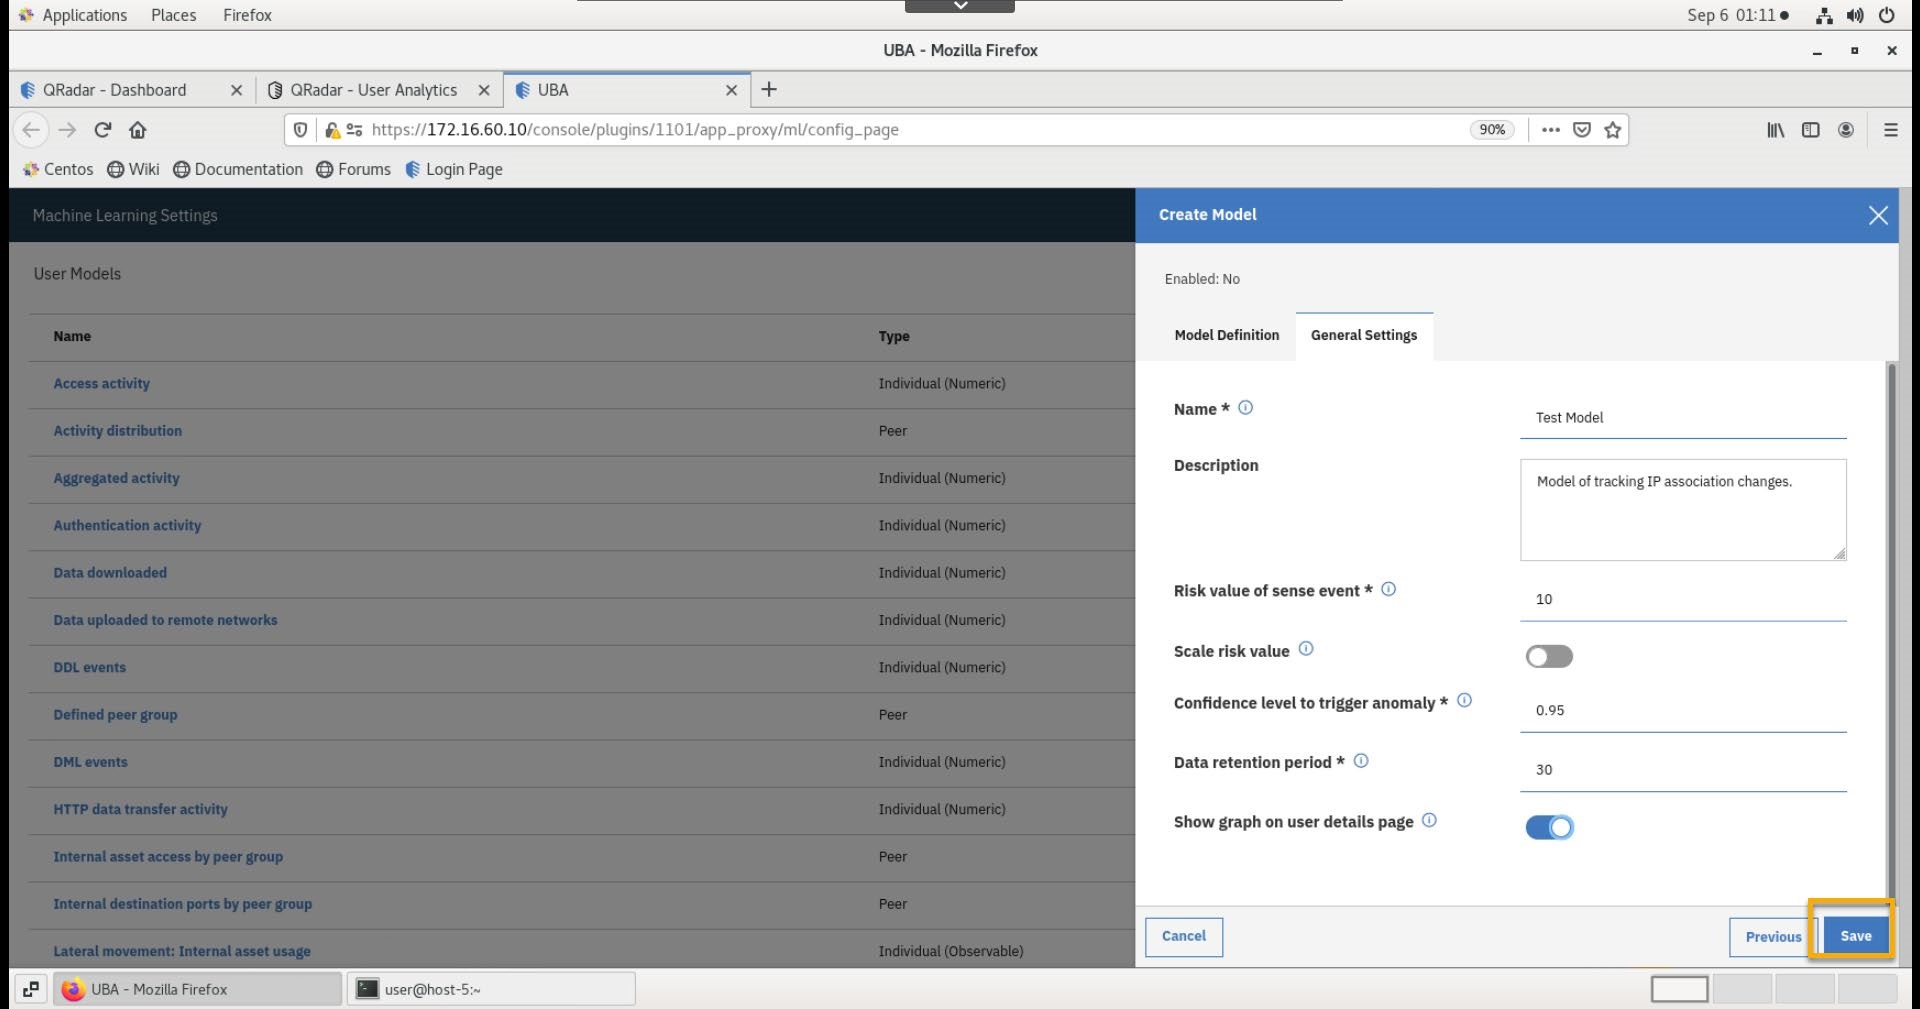
Switch back to the UBA browser tab and select the General Settings tab.
-
Enter the following information:
ParameterValueNameTest ModelDescriptionModel for tracking IP association changesRisk Value of sense event10Show graphdisable -
Click Save.
-
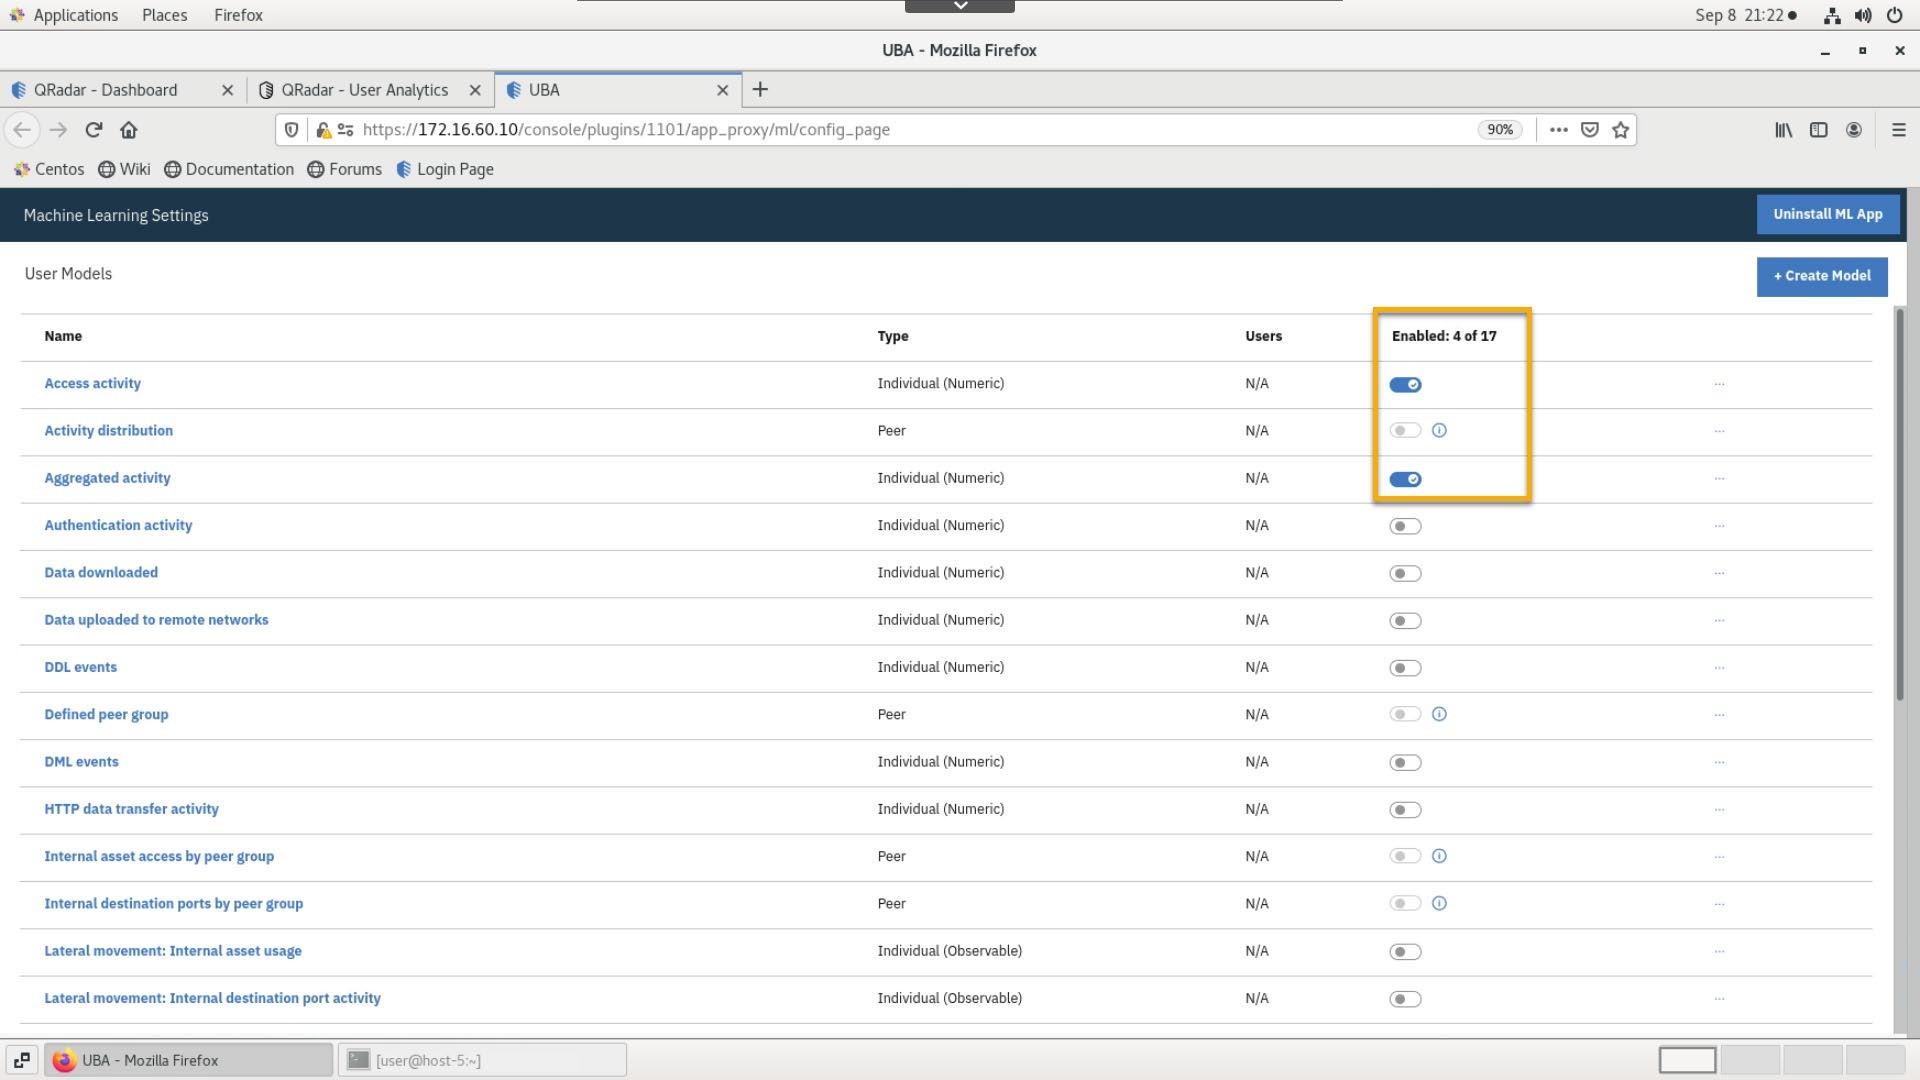
Enable the following models:
- Access Activity
- Aggregated Activity -- Individual (Numeric)
- Lateral movement: internal asset usage - Individual (Observable)
- Successful access and authentication activity
- Test Model
-
Close the UBA tab (Machine Learning settings).
-
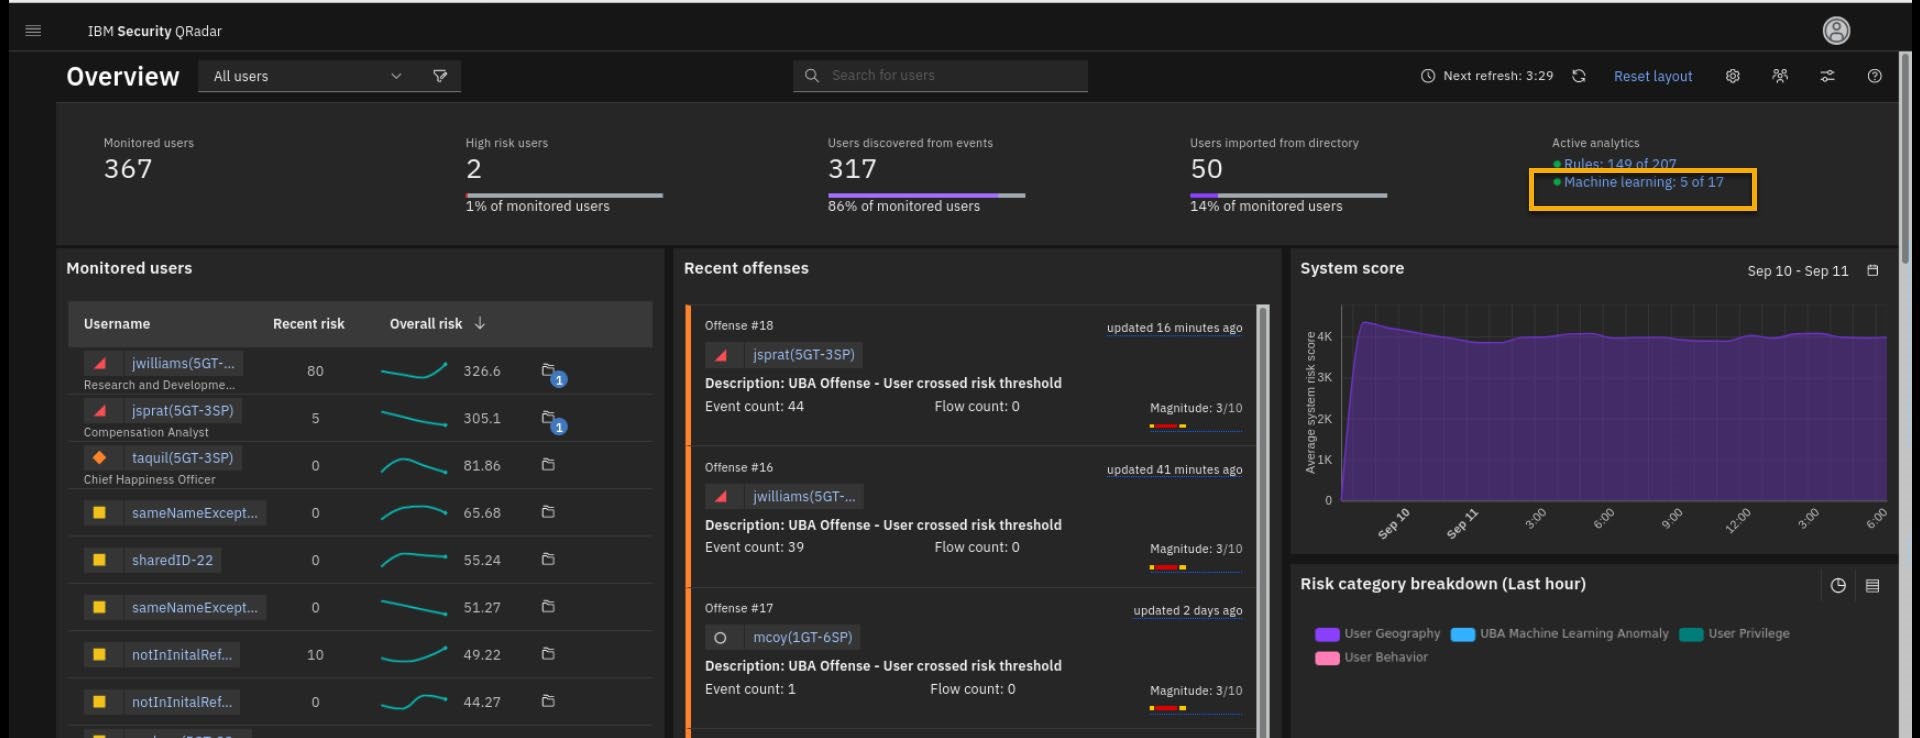
On the UBA Overview, review the Status of machine learning models widget.
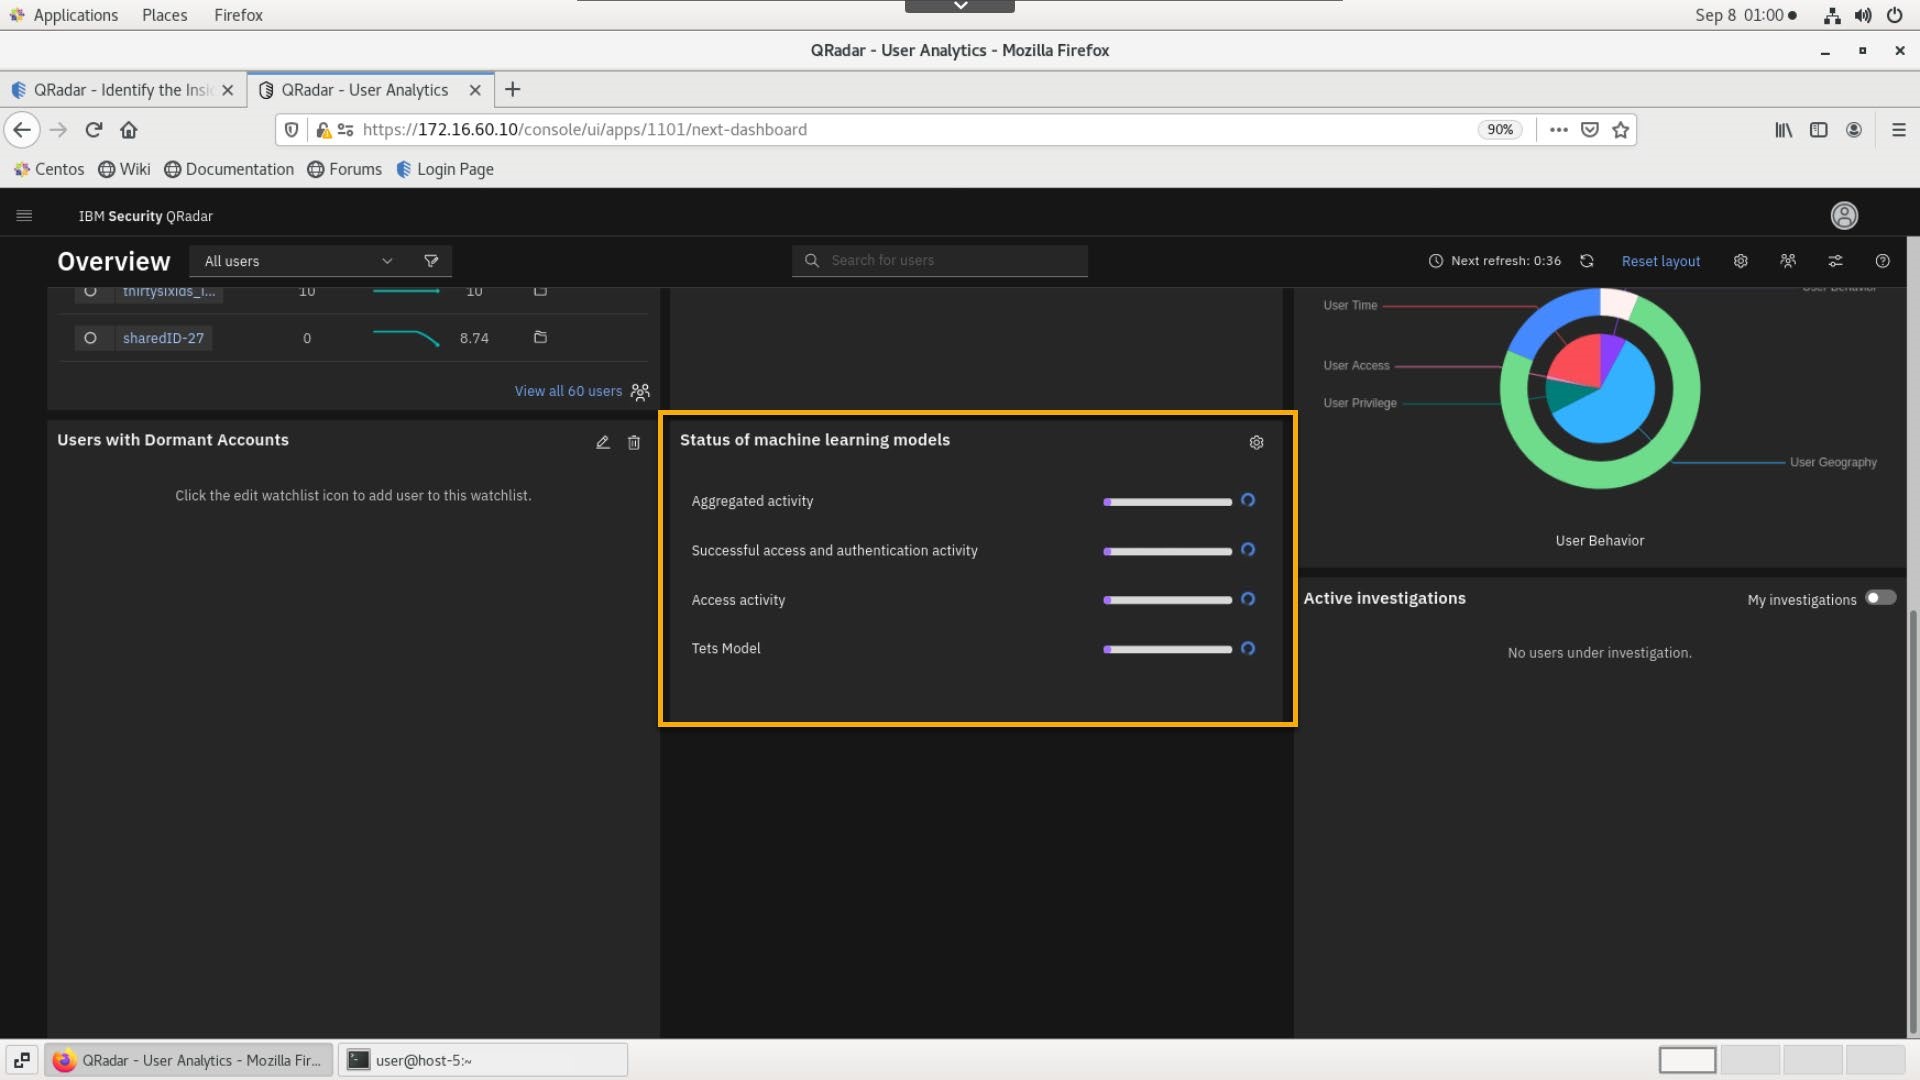
The purple progress bar and blue processing icon indicate the models are ingesting data. Once they begin to build they will turn blue. When they are complete they will turn green. If there are any warnings or errors it will be indicated with a new icon in place of the loading icon and hover text will guide you.
Run the log events that generate random user traffic for the UBA
You can start generating some activity on the UBA dashboard by replaying the log files that simulate random user activity for a pool of 50 users.
To generate some traffic and to review the logs using the QRadar Console, you must connect to QRadar using SSH and replay the logs by using a prepared shell script.
Replaying the logs
- Use SSH terminal to connect to QRadar server:
ssh root@172.16.60.10bash
-
Provide root password: Q1d3m0
-
Run the flowing commands:
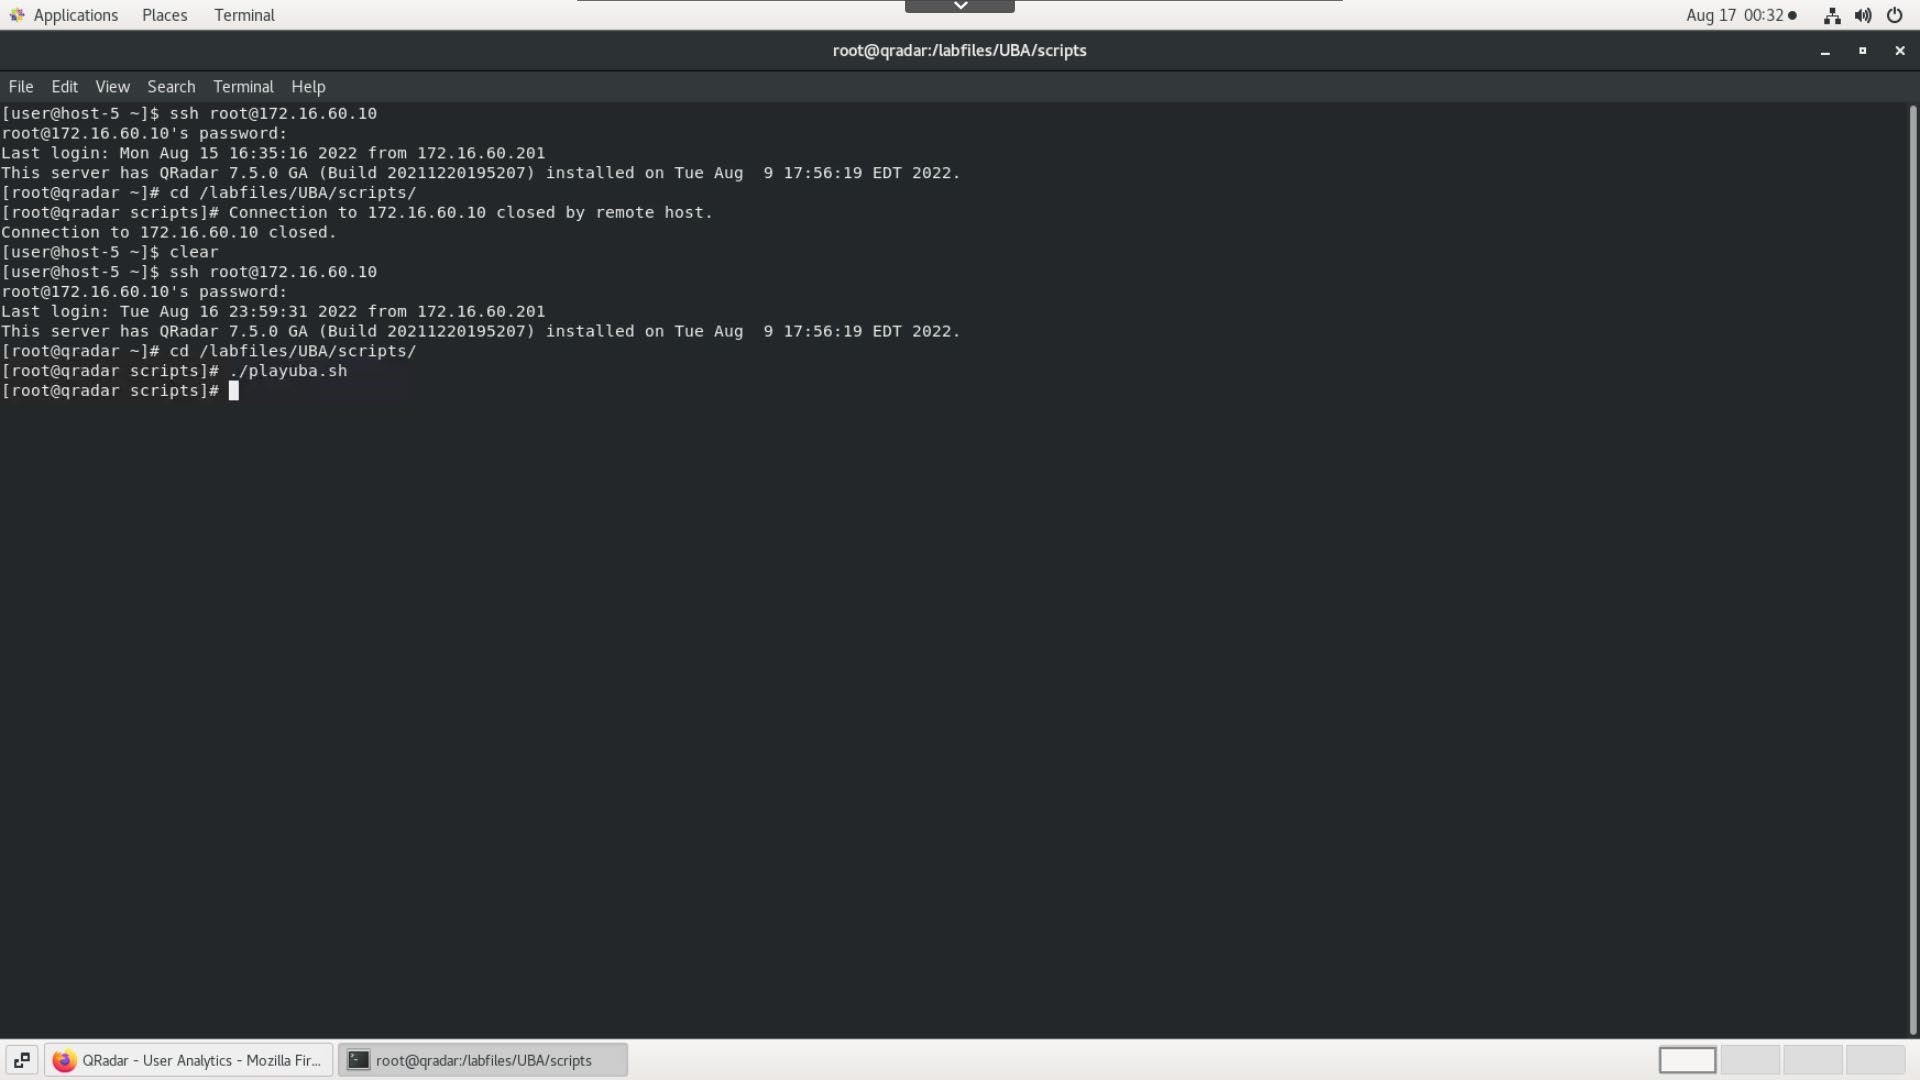
cd /labfiles/UBA/scripts
bash./playuba.shbash
Review the events in the UBA Dashboard
-
Using the browser, go back to the New UI QRadar console.
-
To confirm that the users' activity is also populating the UBA dashboard, refresh the dashboard.
Note: Sometimes you must refresh the browser screen.
- Confirm that you see user activity like the following image.
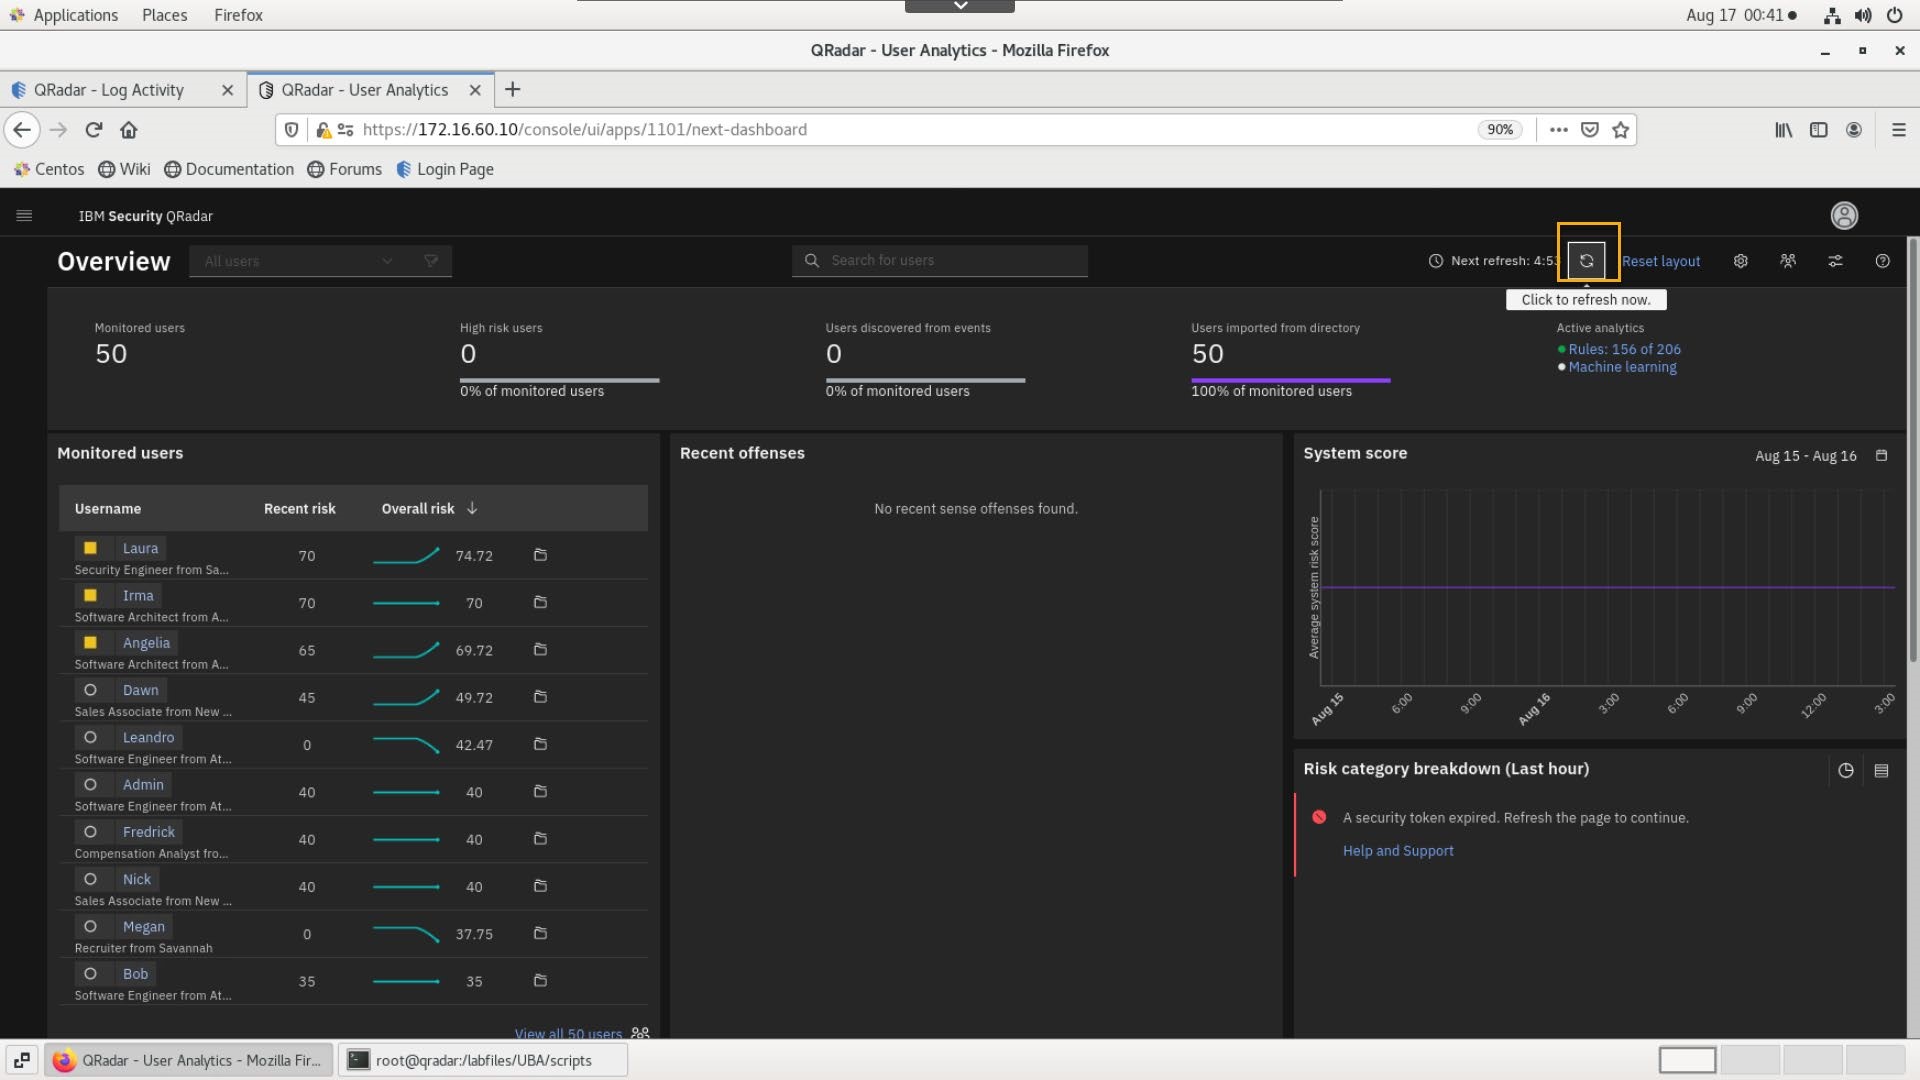
Note that your screen may be different because the running scripts inject the user activity logs at a rate of one event per second.
You also might need to wait a few minutes before you start seeing some activity in the UBA dashboard.
Before you proceed with a user behavior investigation scenario, complete the next few chapters of this lab that demo some UBA specific configurations for this lab environment.
Also to start generating the machine learning anomalies on the graphs run the following script
cd /labfiles/UBA/ML
bash./altML.shbash
Configure the rules
In this section, you configure rules to support the lab scenario for the user behavior investigation.
You create a new rule that detects suspicious Blue Coat appliance traffic, and you enable a preconfigured UBA rule to examine a use case where a user accesses the Microsoft Windows Domain Controller without administrative privileges.
To support the investigation, you must configure three reference sets:
-
BlueCoat Investigate Categories: It is a new reference set.
-
UBA : Domain Controllers: The UBA installation process creates this reference set.
-
UBA : Domain Controller Administrators: The UBA installation process creates this reference set.
Create BlueCoat Investigate Categories Reference Set
The scenario that you run in this lab simulates traffic coming from the BlueCoat proxy appliance. The BlueCoat proxy appliance detects and reports about users' HTTP activity. Also, it performs URL categorization based on information obtained from a proprietary database. In this lab, you are going to use the subset of the categories based on the following list:
- Spam
- Uncategorized
- Malicious Sources/Malnets
- Proxy Avoidance
- Suspicious
- Marijuana
- Malicious Outbound Data/Botnets
- Potentially Unwanted Software
- Adult/Mature Content
- Hacking
- Dynamic DNS Host
- Phishing
- Pornography
- Violence/Hate/Racism
- Scam/Questionable/Illegal
- Gambling
- Peer-to-Peer (P2P)
- Child Pornography
The full URL categorization list for the Blue Coat appliance can be found at ibm.biz/ProxyCategories
To create the BlueCoat, Investigate Categories reference set and add the URL categories list, perform the following steps:
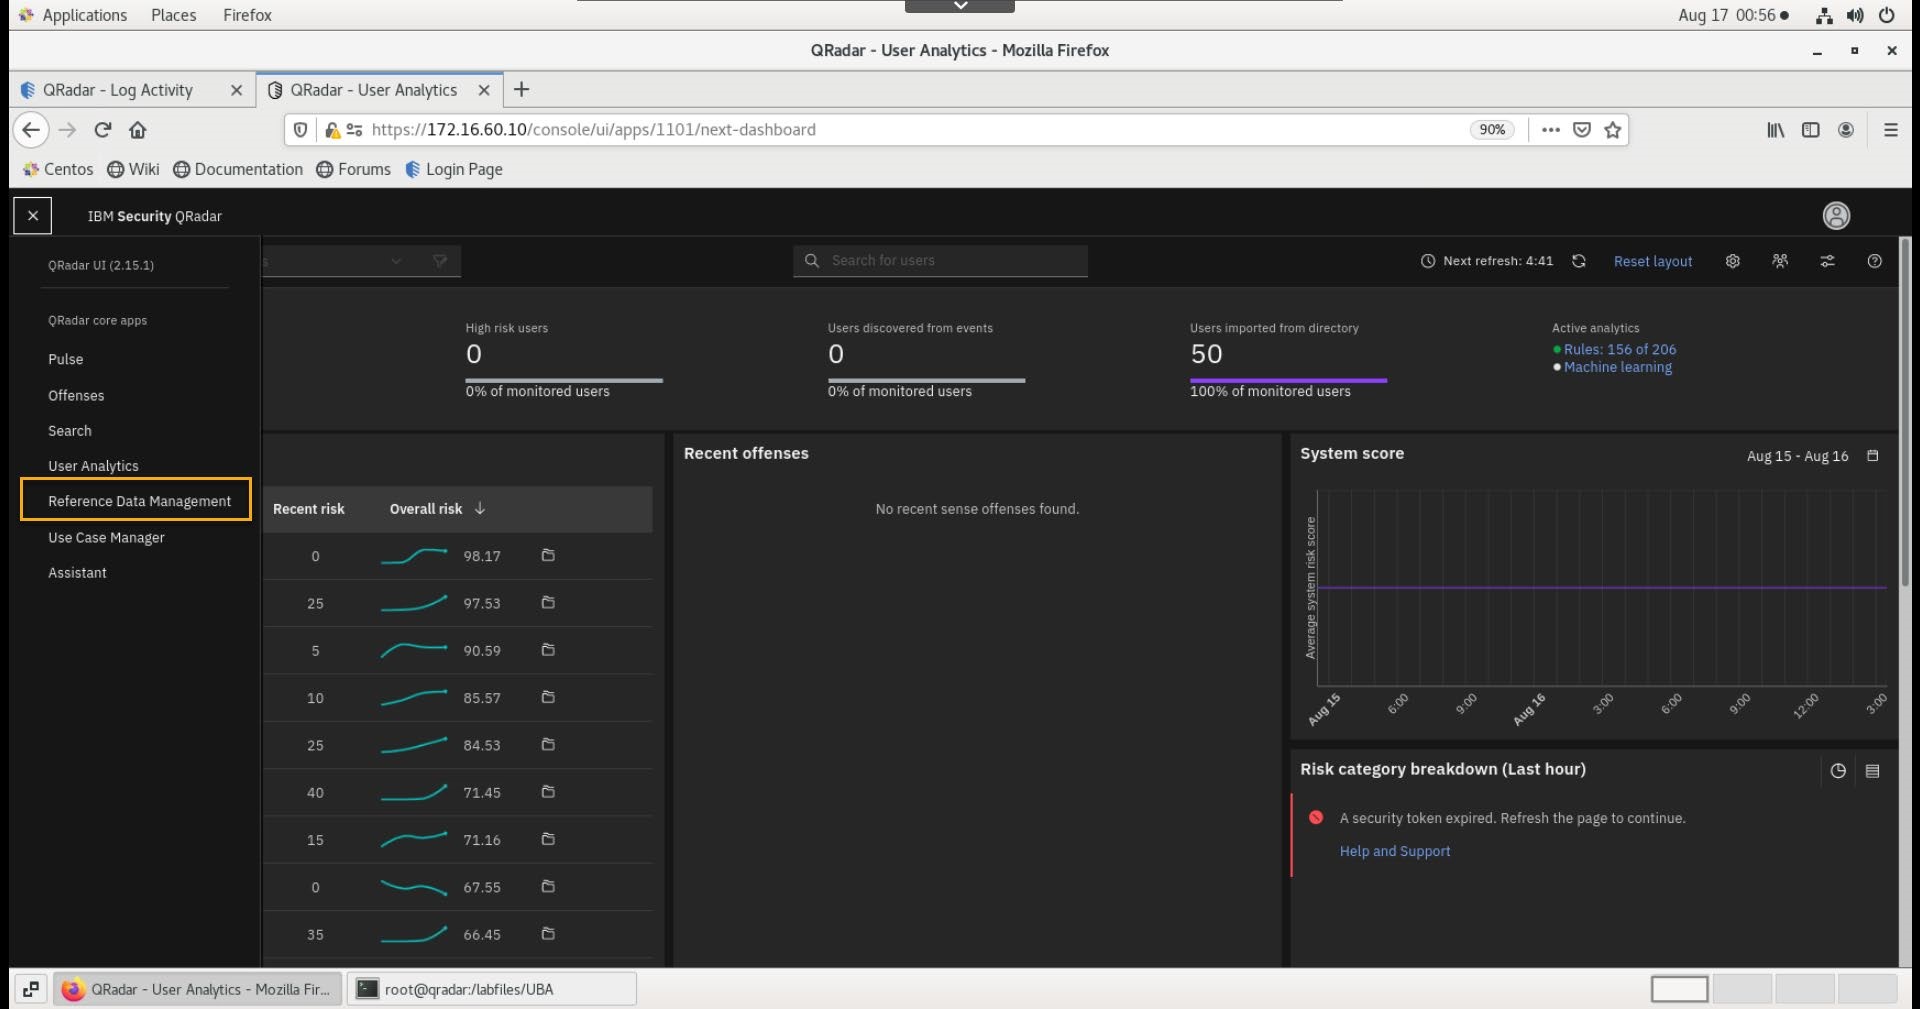
- From the new QRadar Console, open the main menu and click Reference Data Management.
-
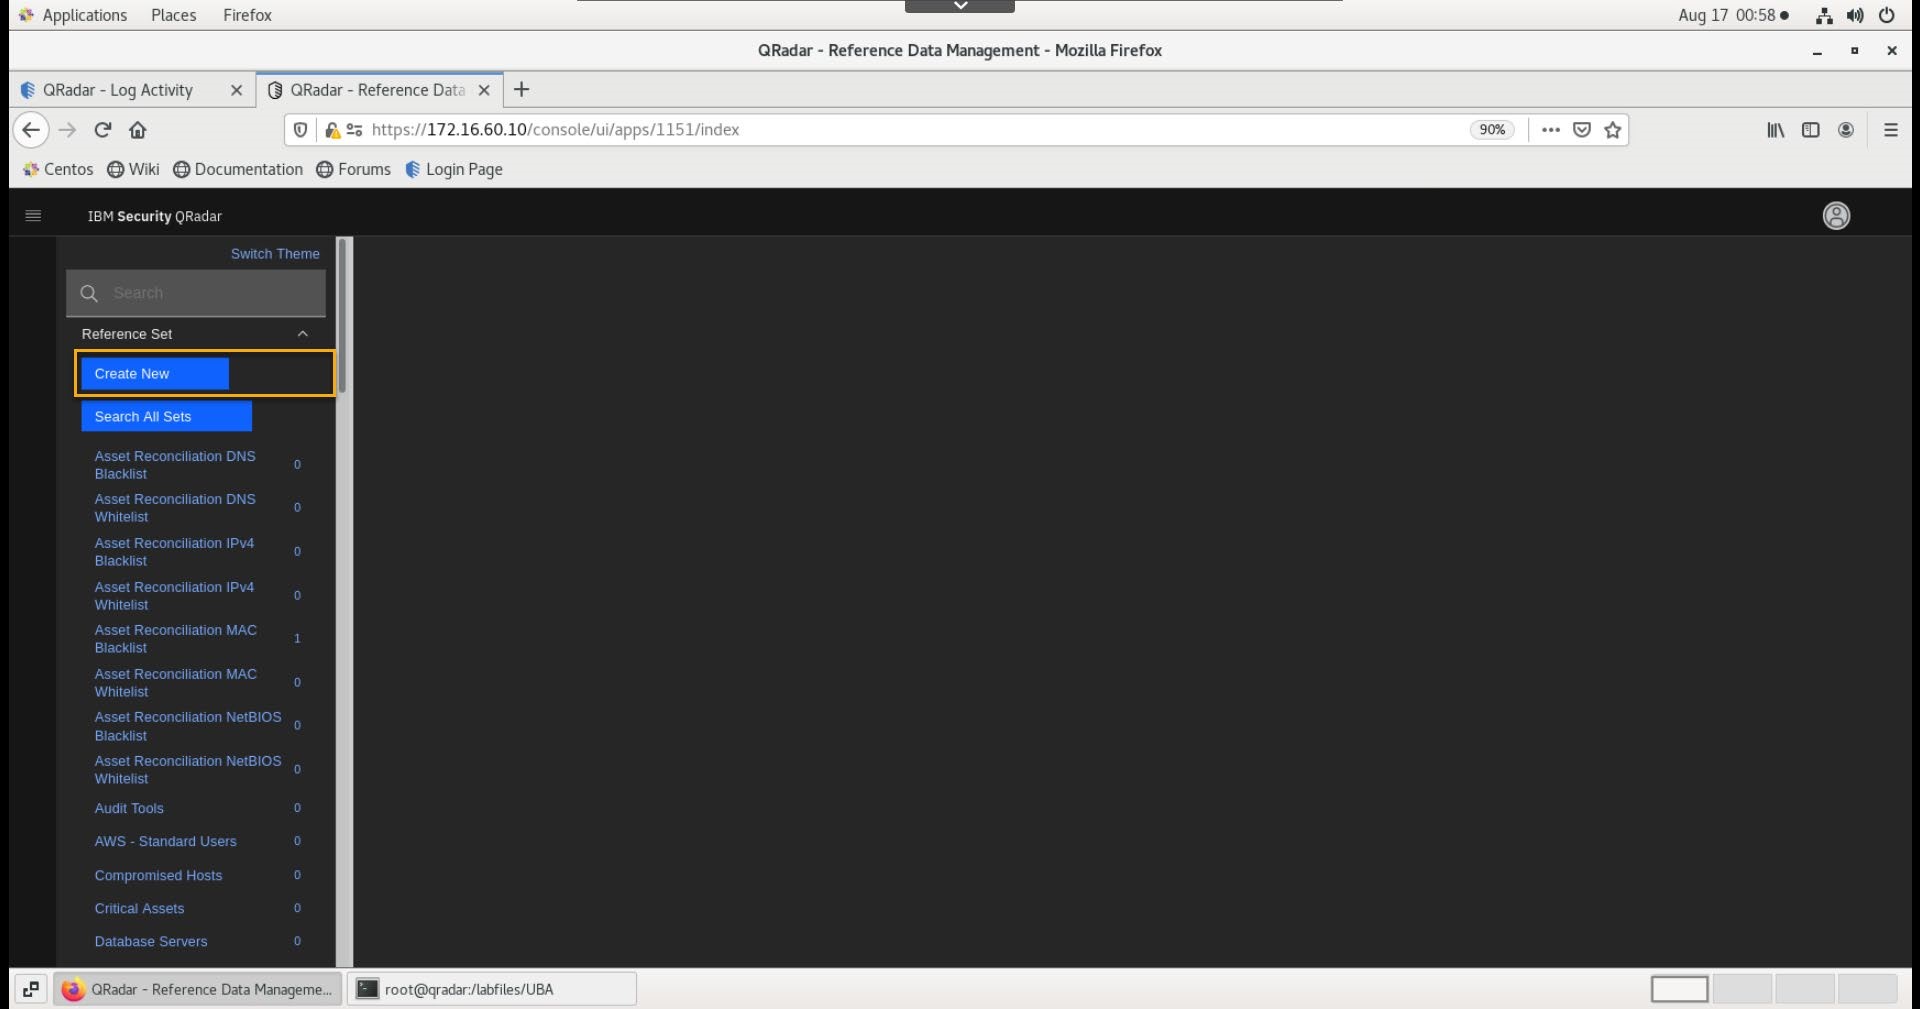
In the Reference Data Management app, click Reference Set.
-
Click Create New.
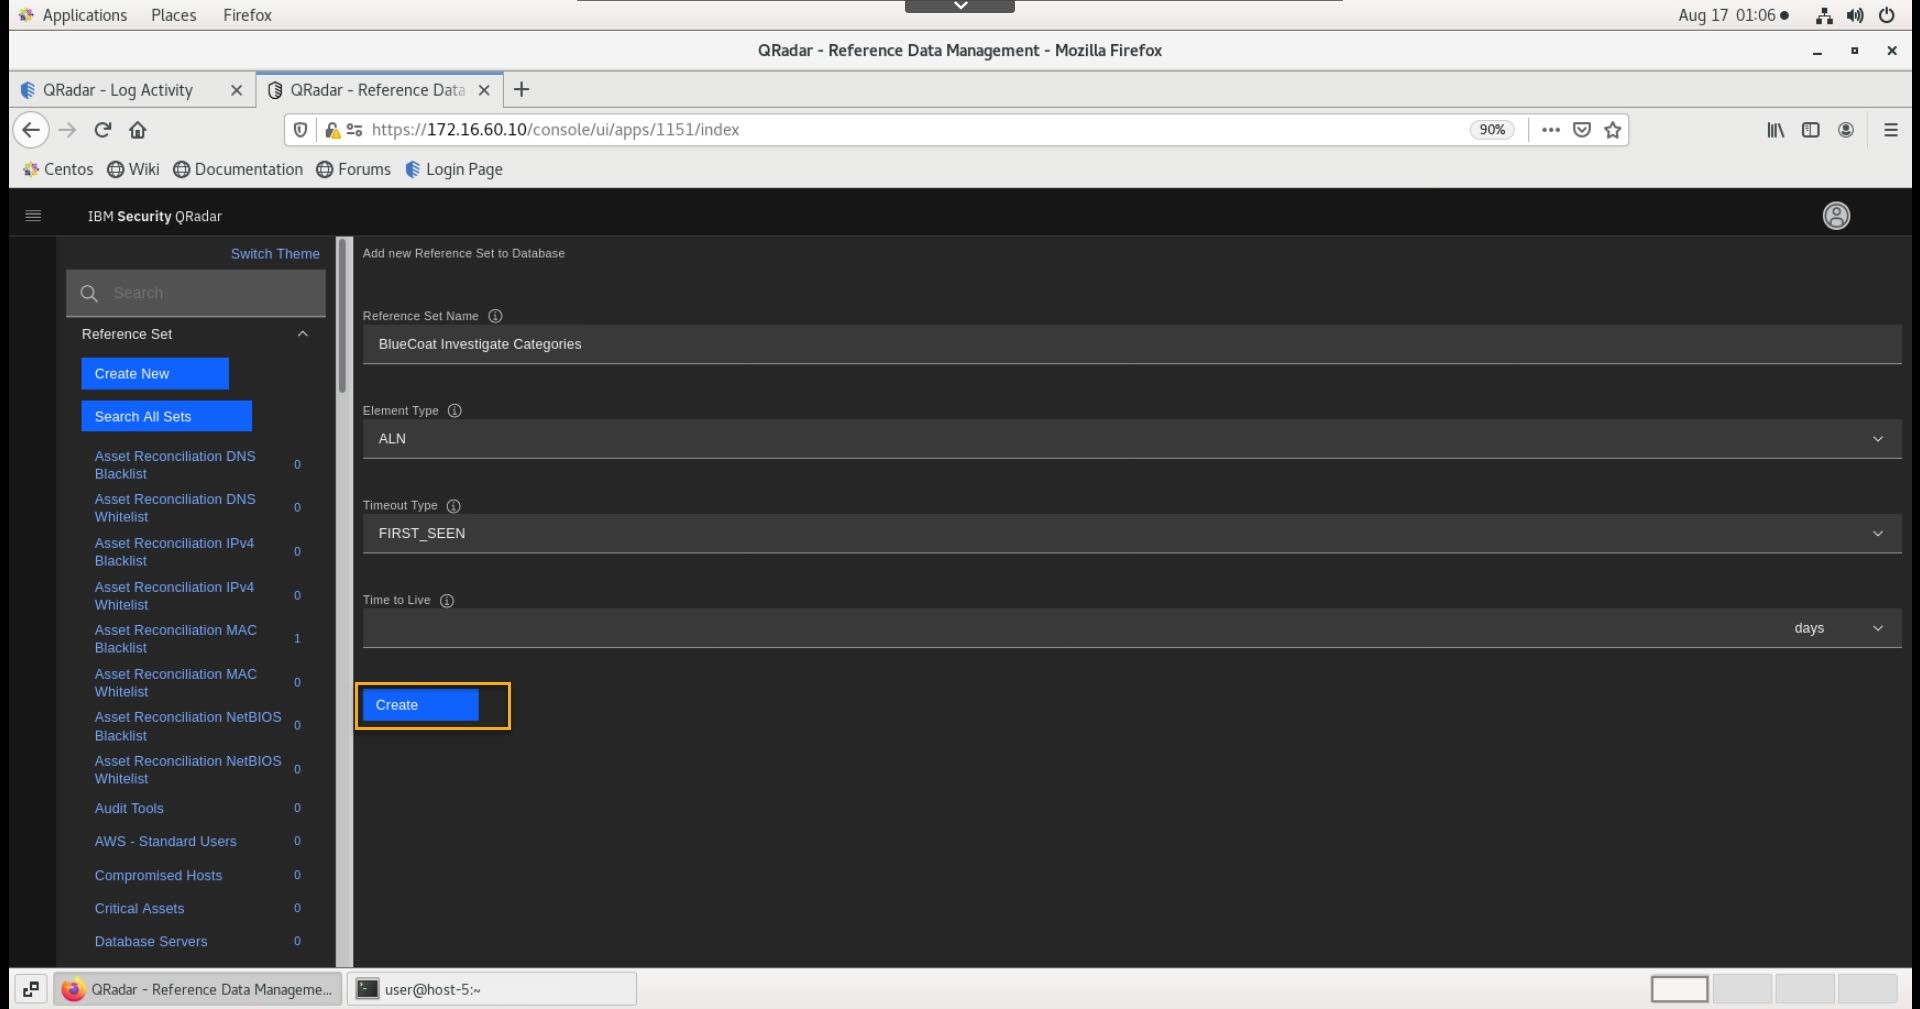
- In the Add new Reference Set to Database window, in the Reference Set Name field type
BlueCoat Investigate Categoriesbash
- Leave all the other fields as the default and click Create.
-
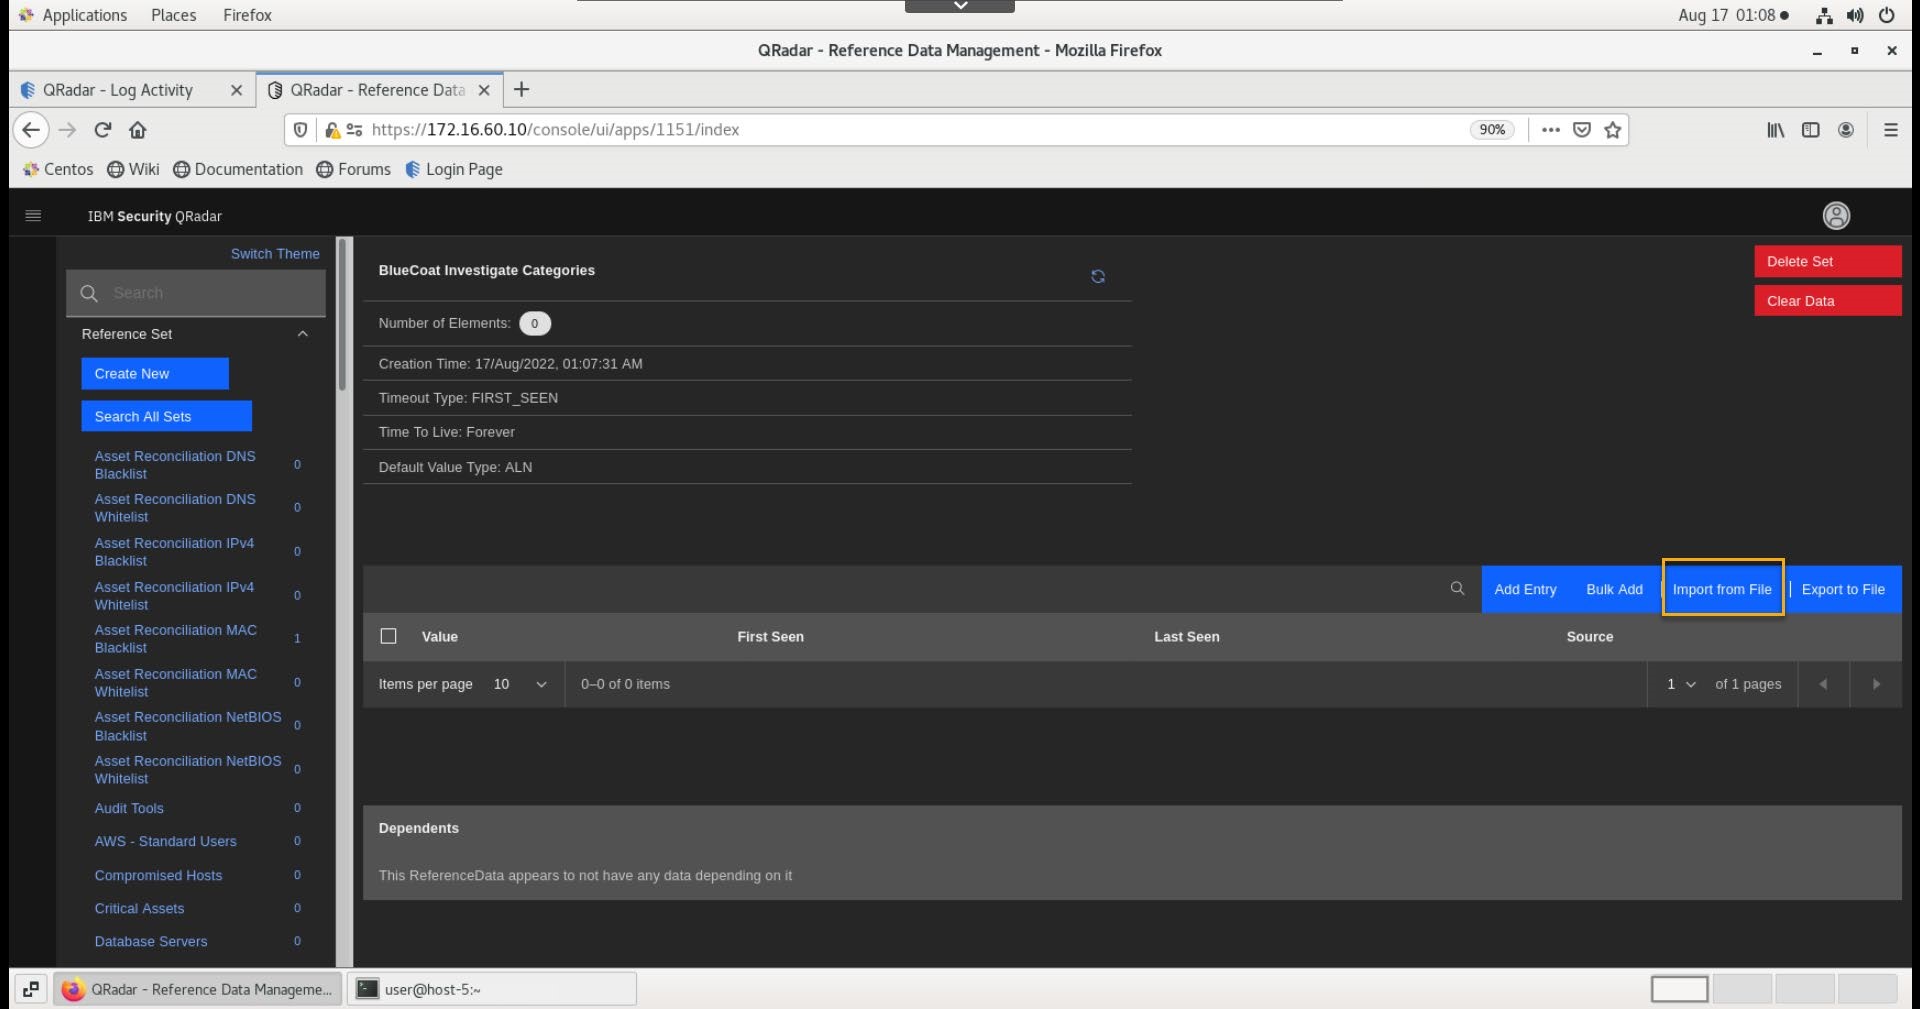
Confirm that the new reference set is created with no data.
-
In the Reference Set details window, click Import from File.
-
Download the bluecoat.txt file to your workstation or the jump server where the browser is accessing the QRadar UI.
-
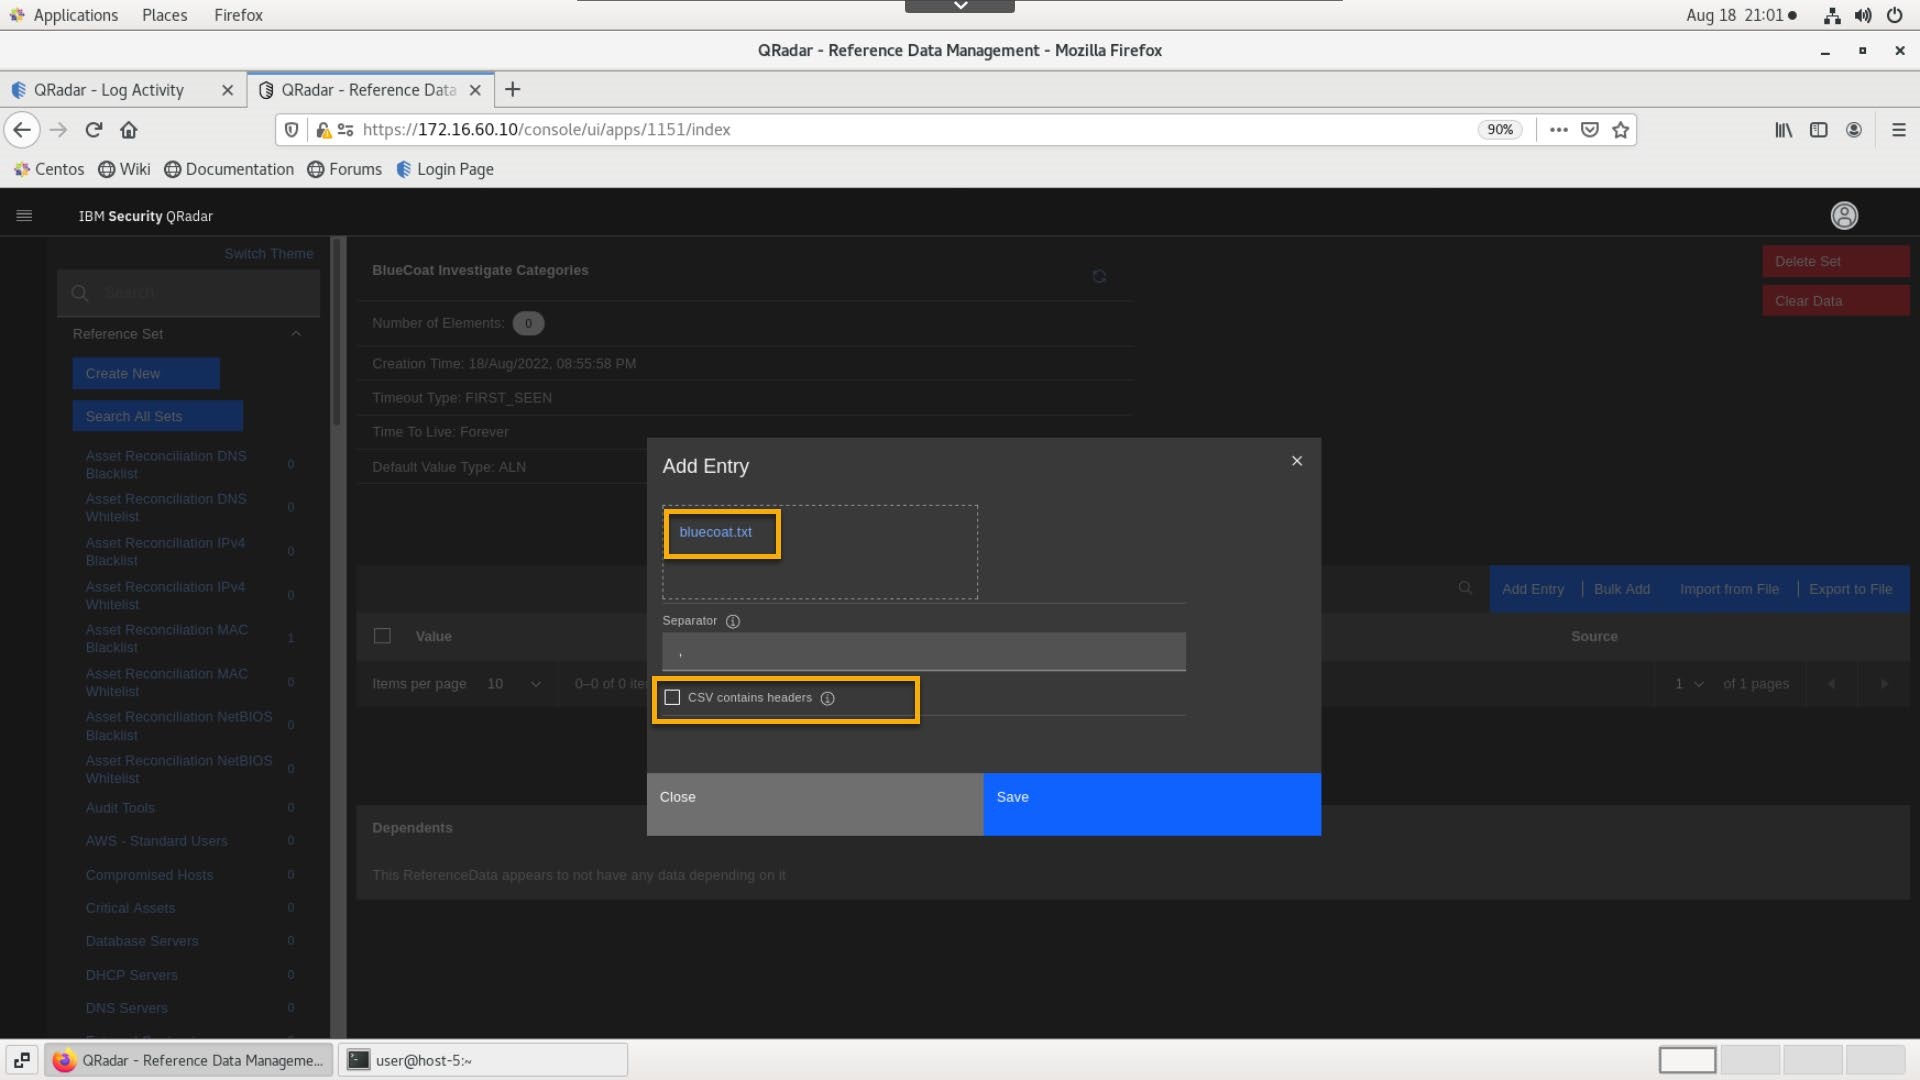
In the Import Reference Set Data window, click Select File.
-
Browse to locate the file on your workstation or the jump server to upload.
-
Unselect CSV contains headers.
-
Click Save.
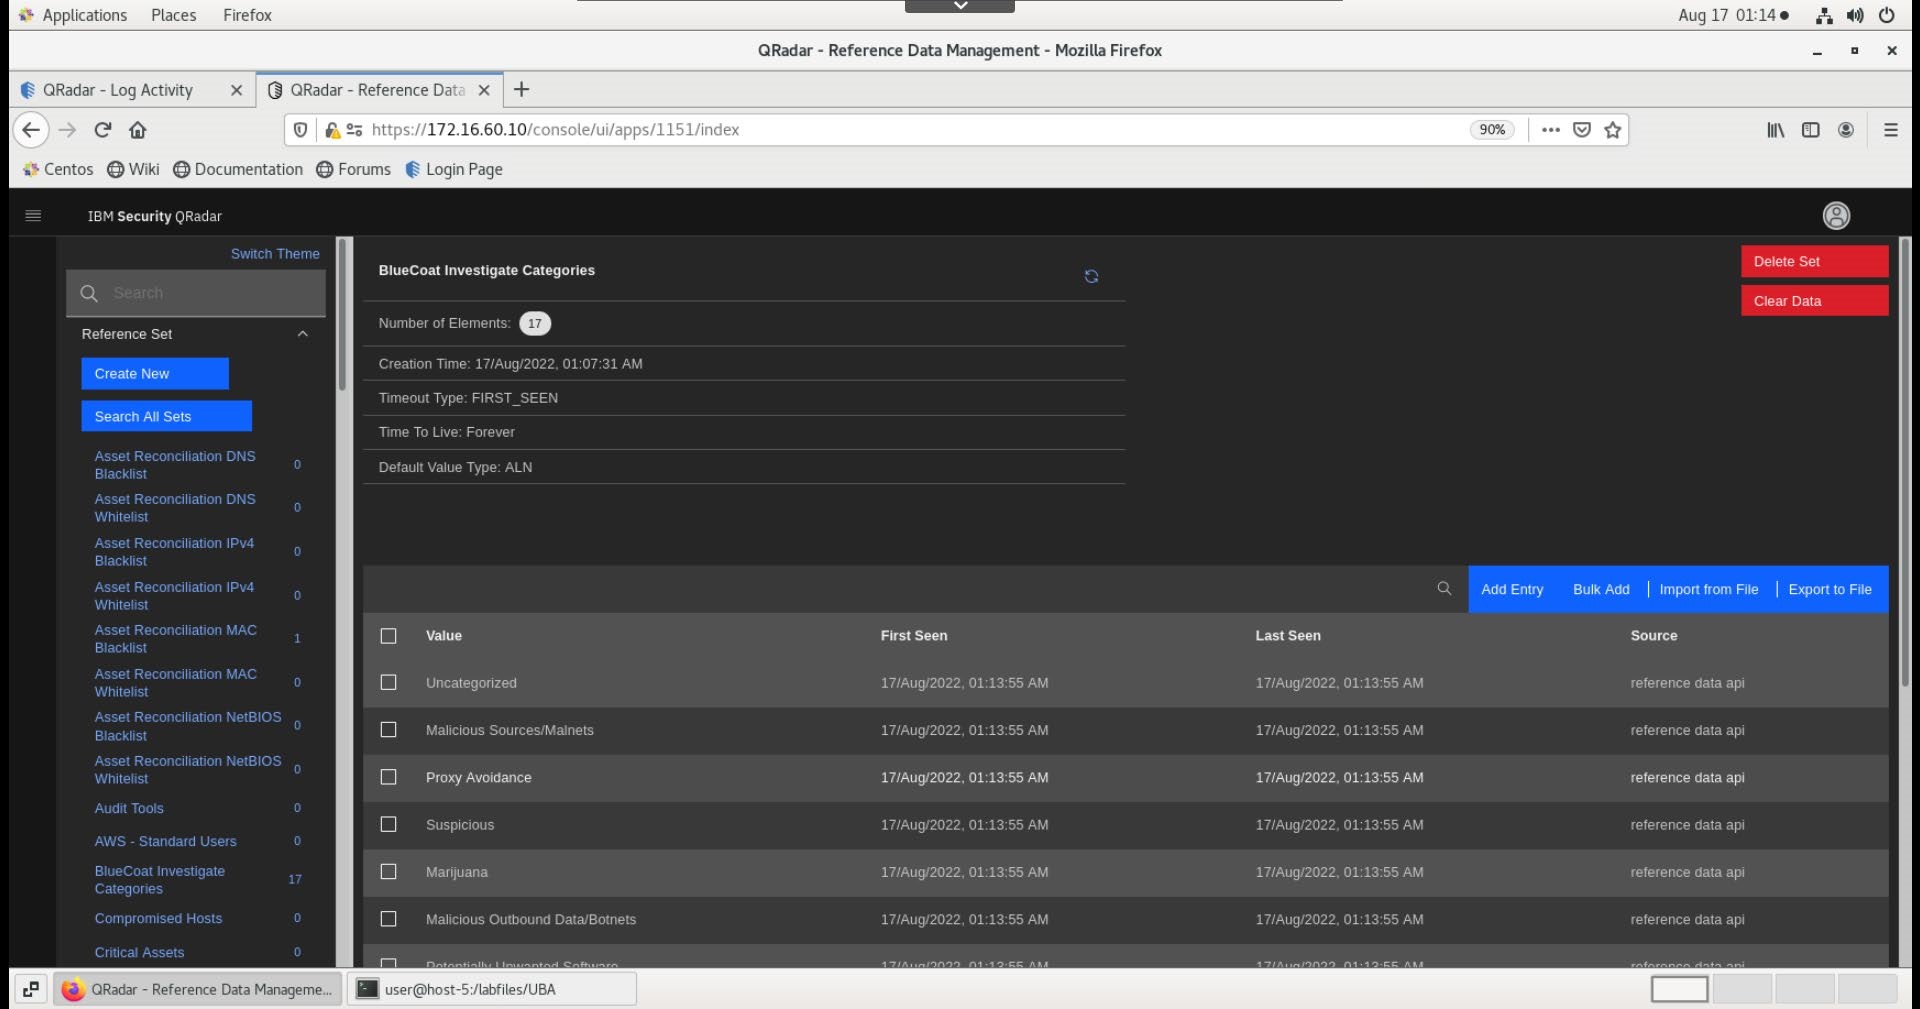
Note: The Blue Coat categories are loaded into the reference set.
Update the UBA : Domain Controllers Reference Set
The simulation in this lab performs malicious activities on the Microsoft Active Directory server, which is also a domain controller, of a fictitious company. For the simulation, the IP address 10.64.2.13 is the address of the Active Directory Domain Controller. To properly configure the UBA rule that detects non-admin access to the domain controller, this IP address needs to be added to the UBA : Domain Controllers reference set.
Perform the following steps to update the reference set:
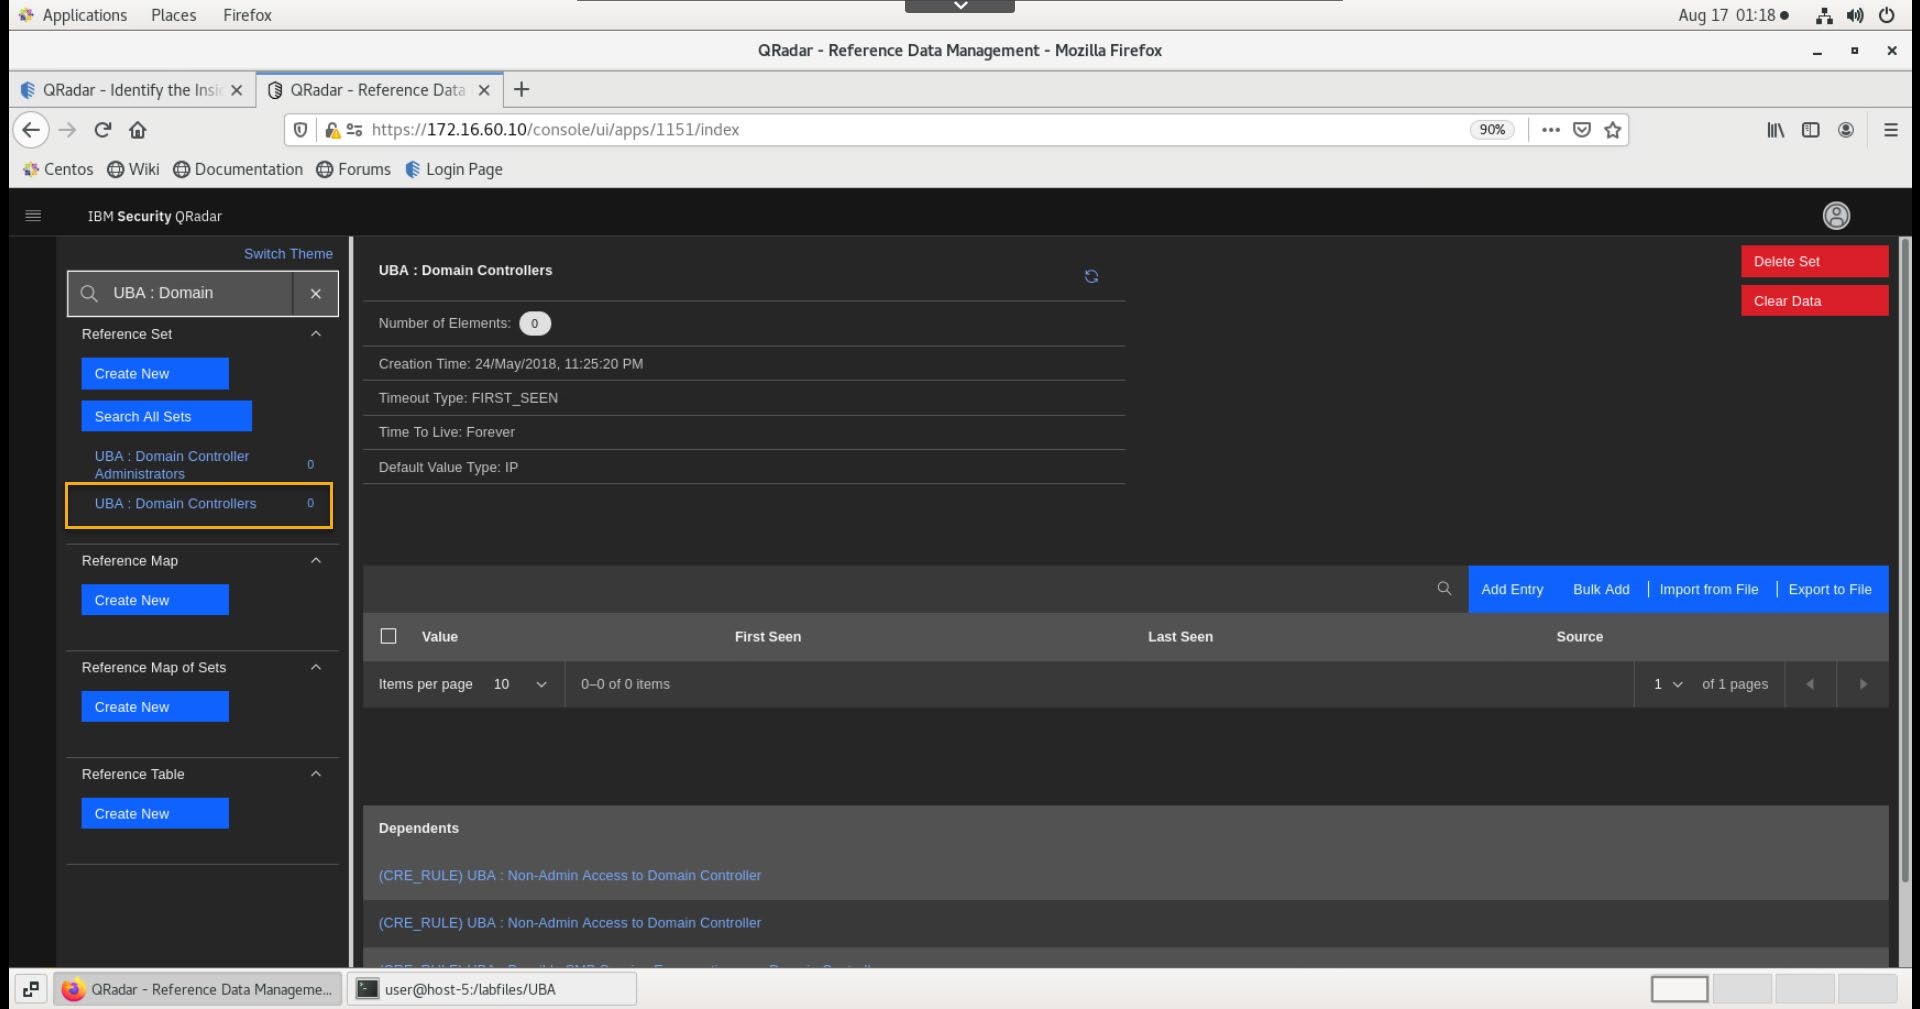
- While you are still in the Reference Data Management window, in the search field type
UBA : Domainbash
- Select UBA : Domain Controllers reference set.
-
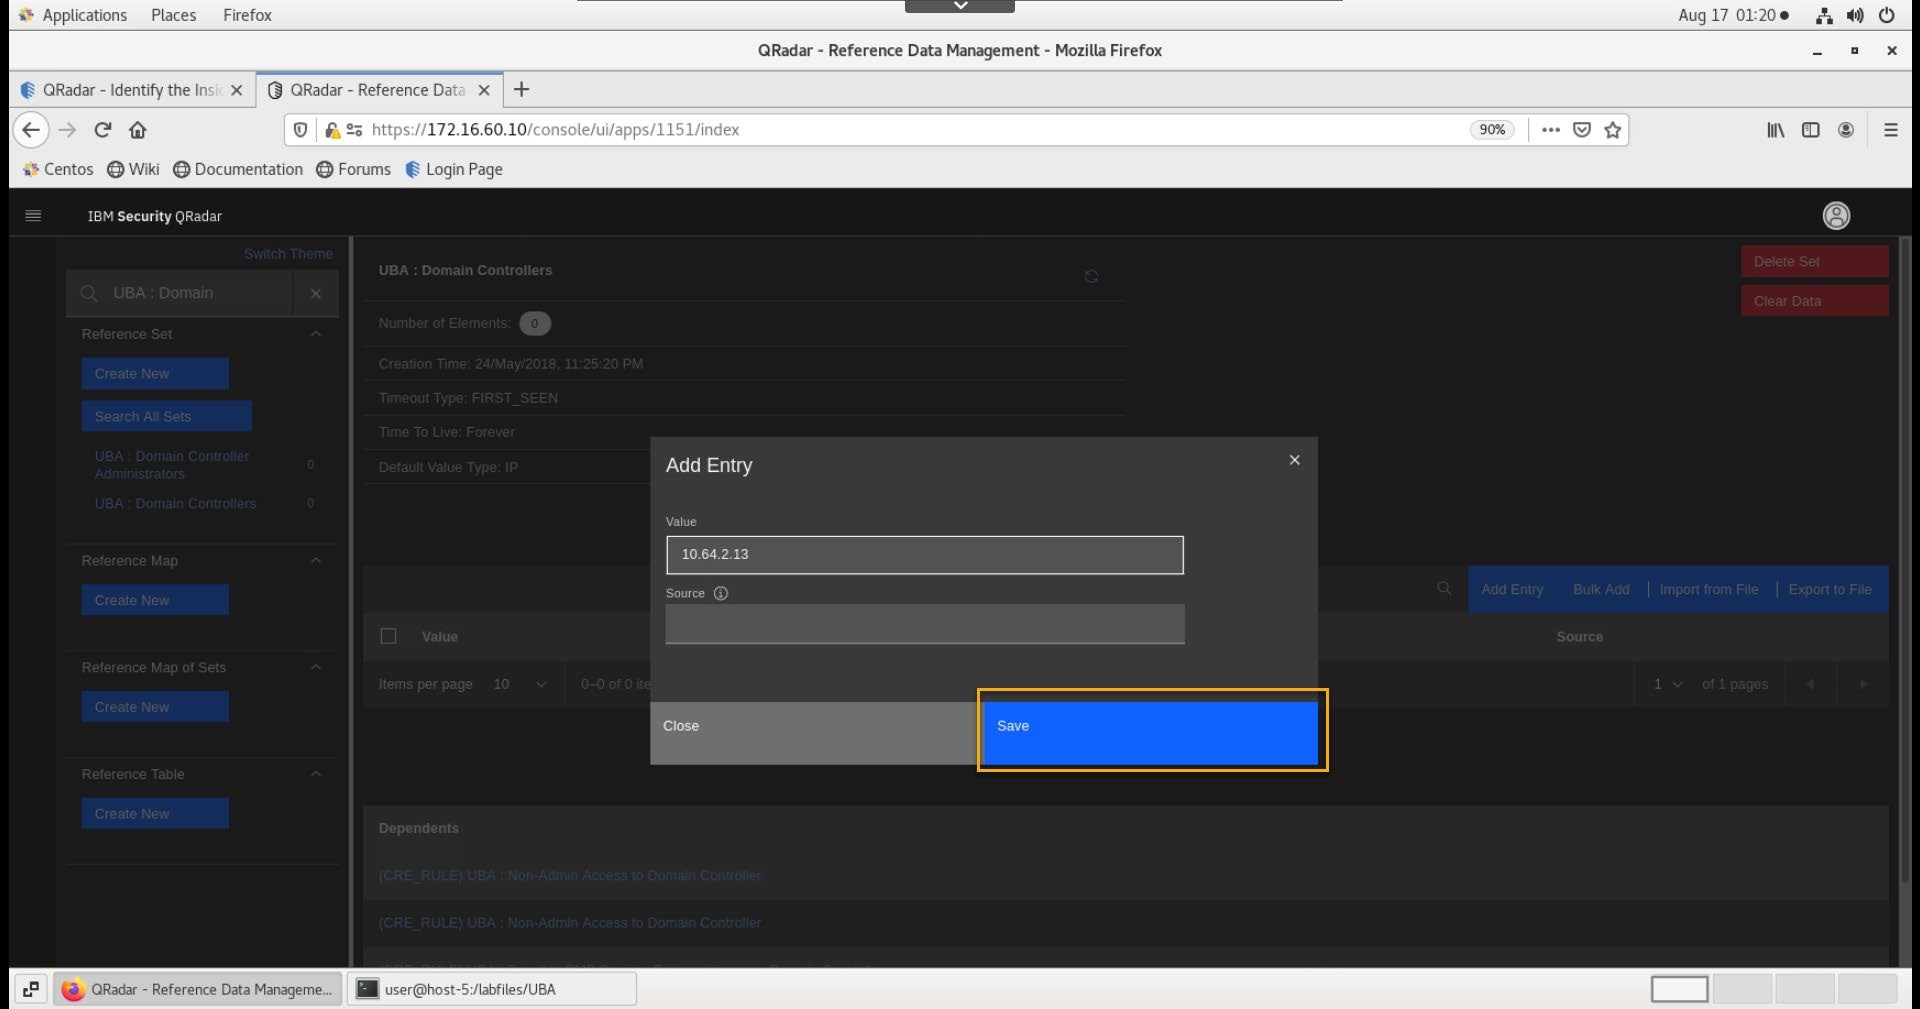
Click Add Entry.
-
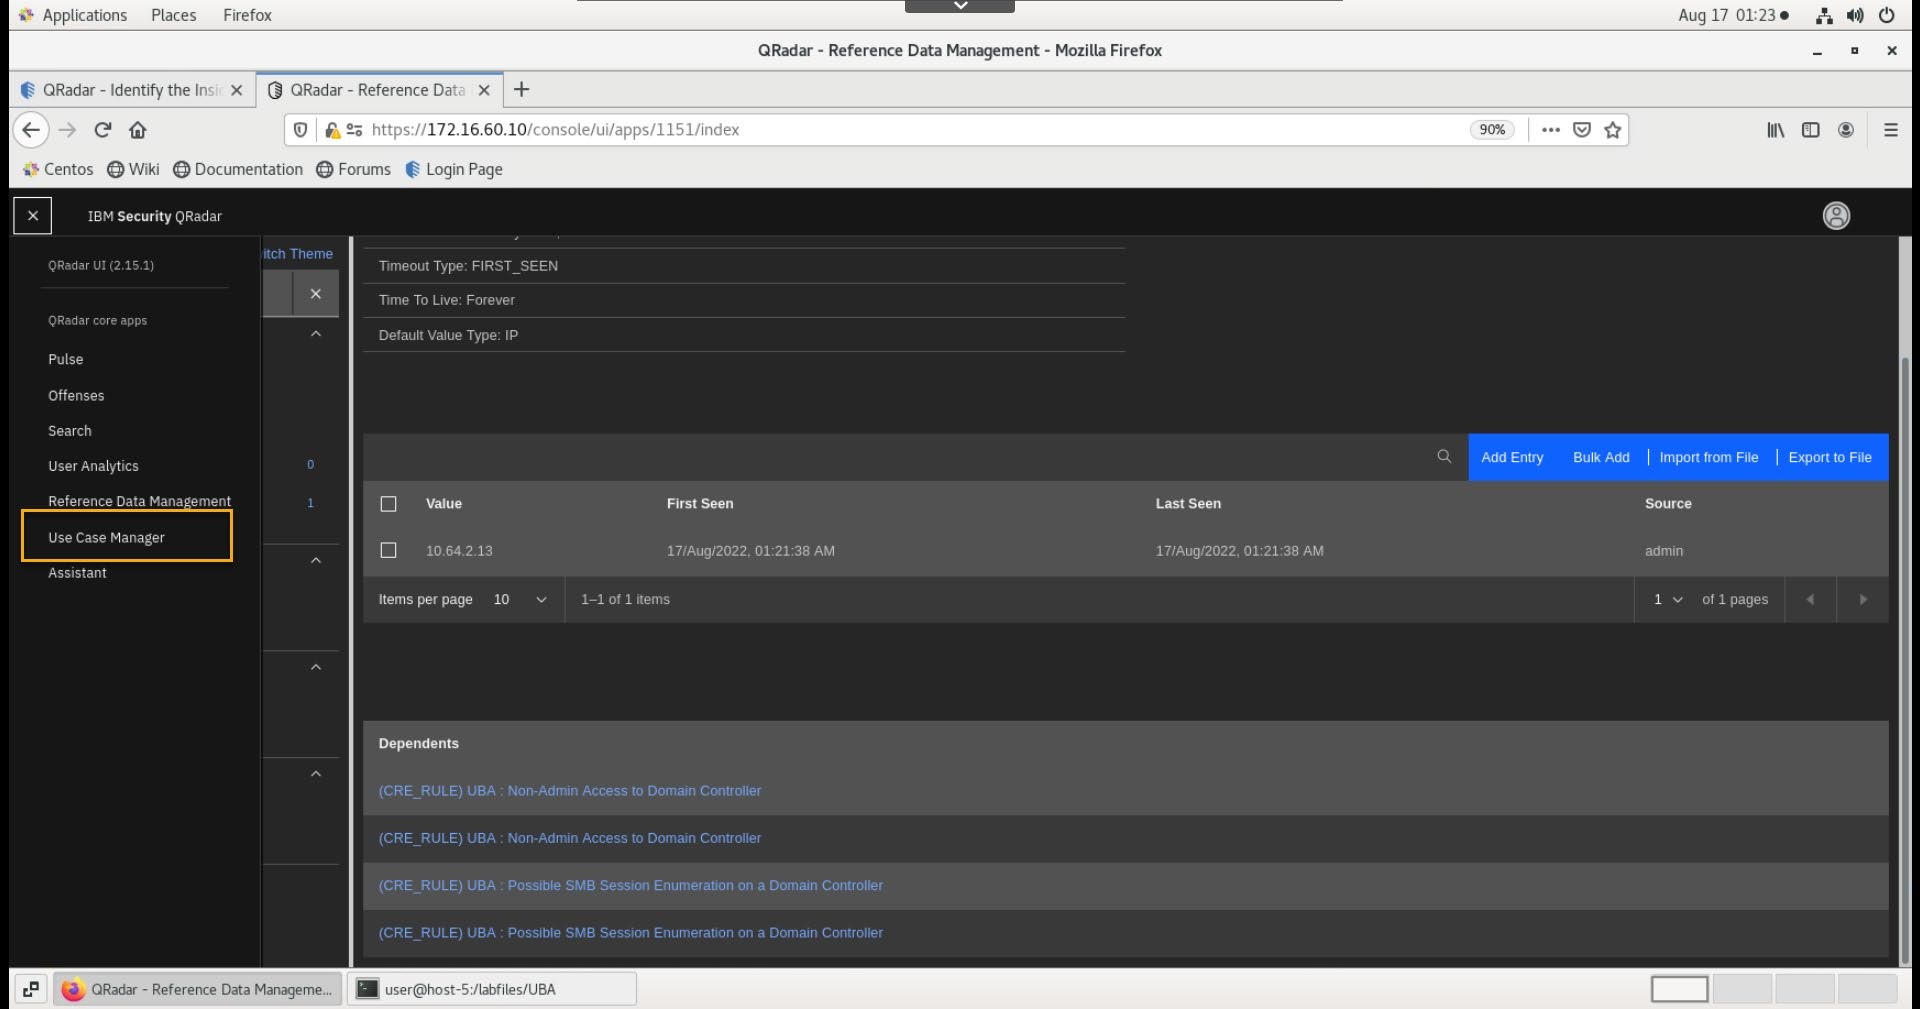
In the Add Entry window, type 10.64.2.13 as the IP address of the domain controller.
-
Click Save.
 .
.
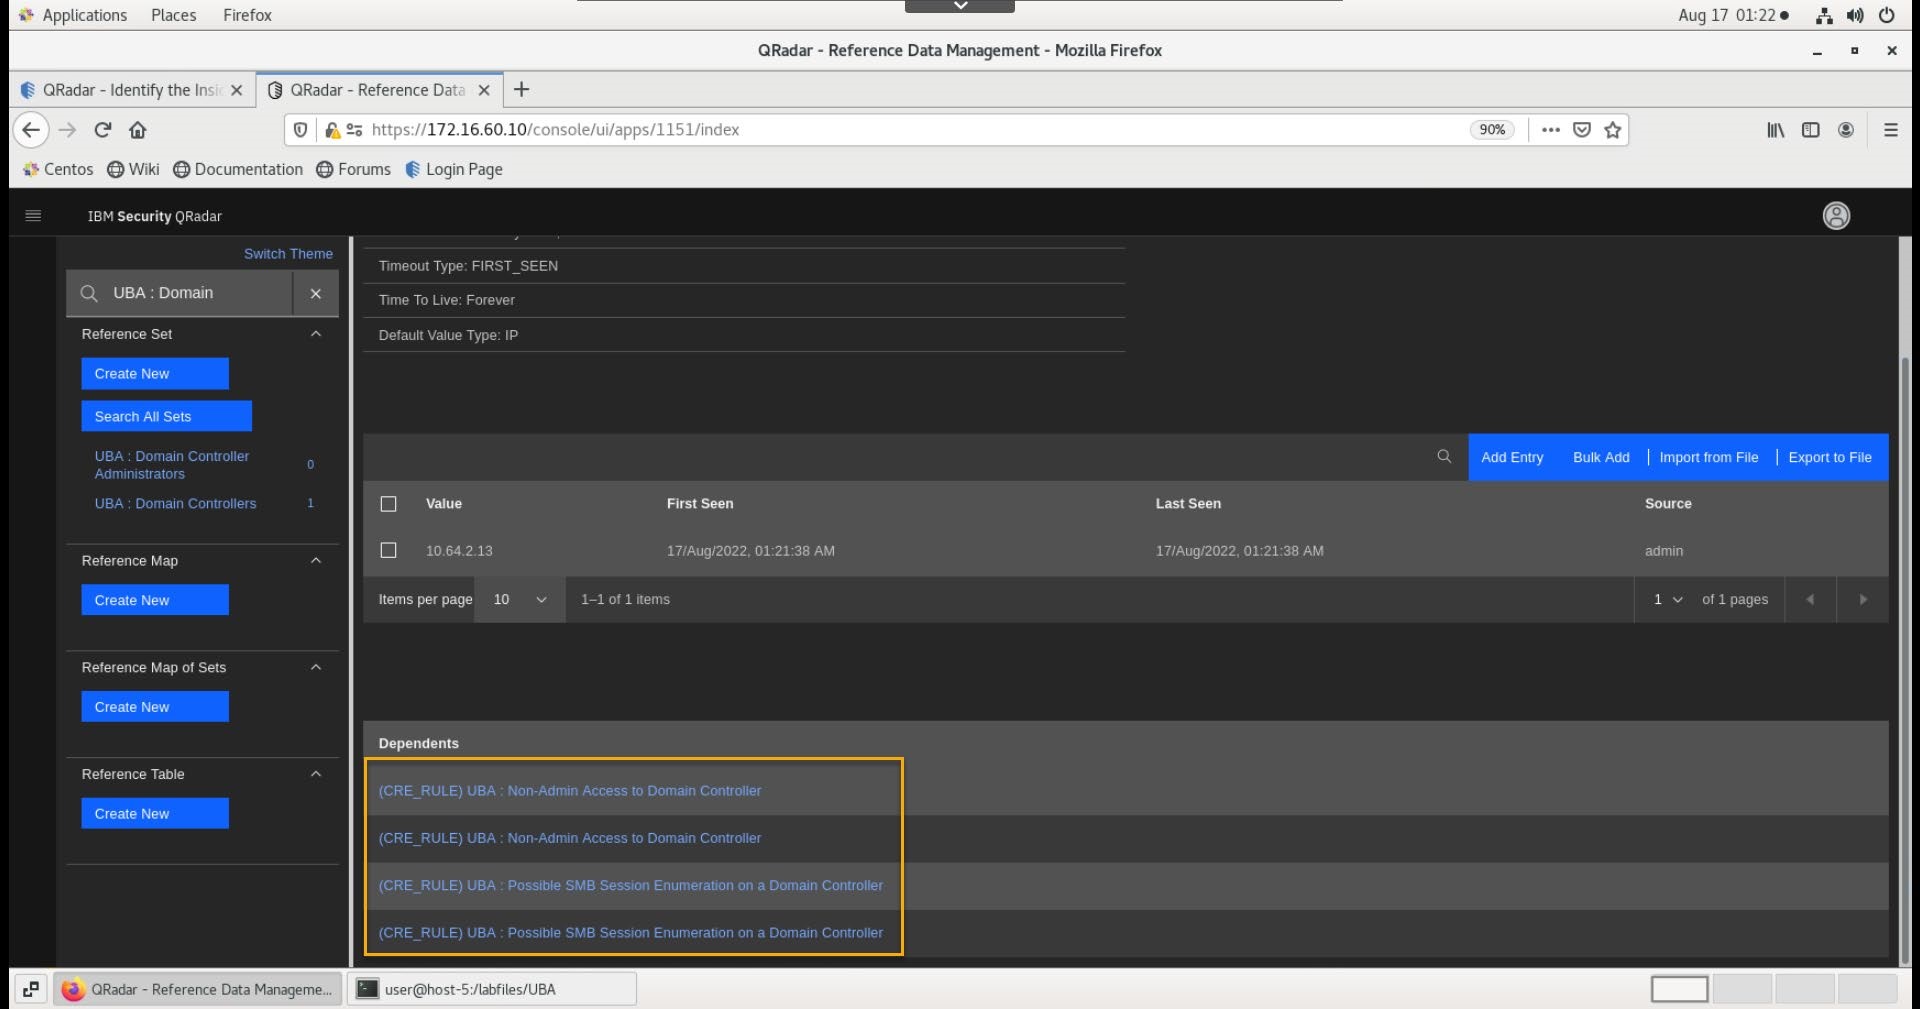
- Confirm that the entry is added to the list.
Note the UBA rules associated with this reference set.
Update UBA : Domain Controller Administrators Reference Set
The simulation in this lab performs malicious activities on the Microsoft Active Directory server, which is also a domain controller, of a fictitious company. For the simulation, the users, jwilliams and jsprat are the Active Directory Domain Controller Administrators.
For comparison of behavior, these users need to be added to the UBA : Domain Controller Administrators reference set.
Perform the following steps to update the reference set.
- While you are still in the Reference Data Management window, in the search field type
UBA : Domainbash
- Select UBA : Domain Controller Administrators reference set.
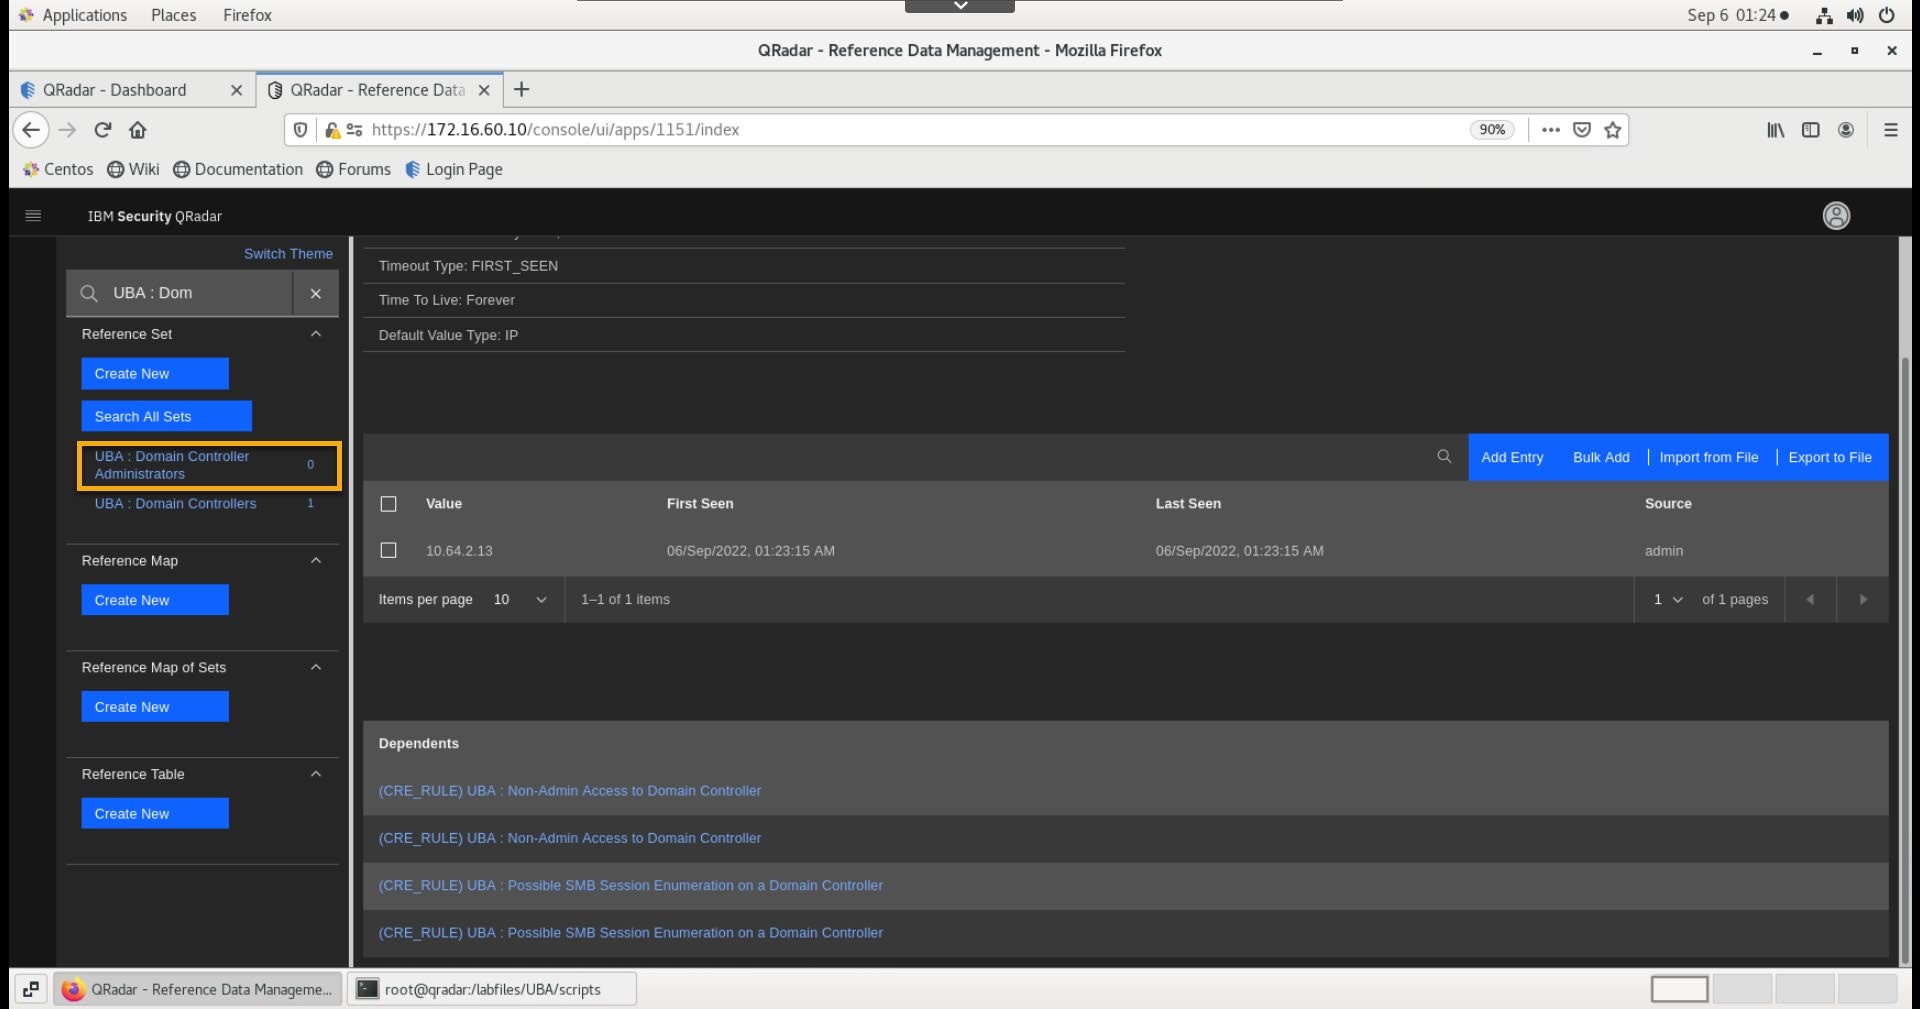
-
Click Add Entry.
-
In the Add Entry window, type jwilliams
-
Click Save.
-
Click Add Entry.
-
In the Add Entry window, type jsprat
-
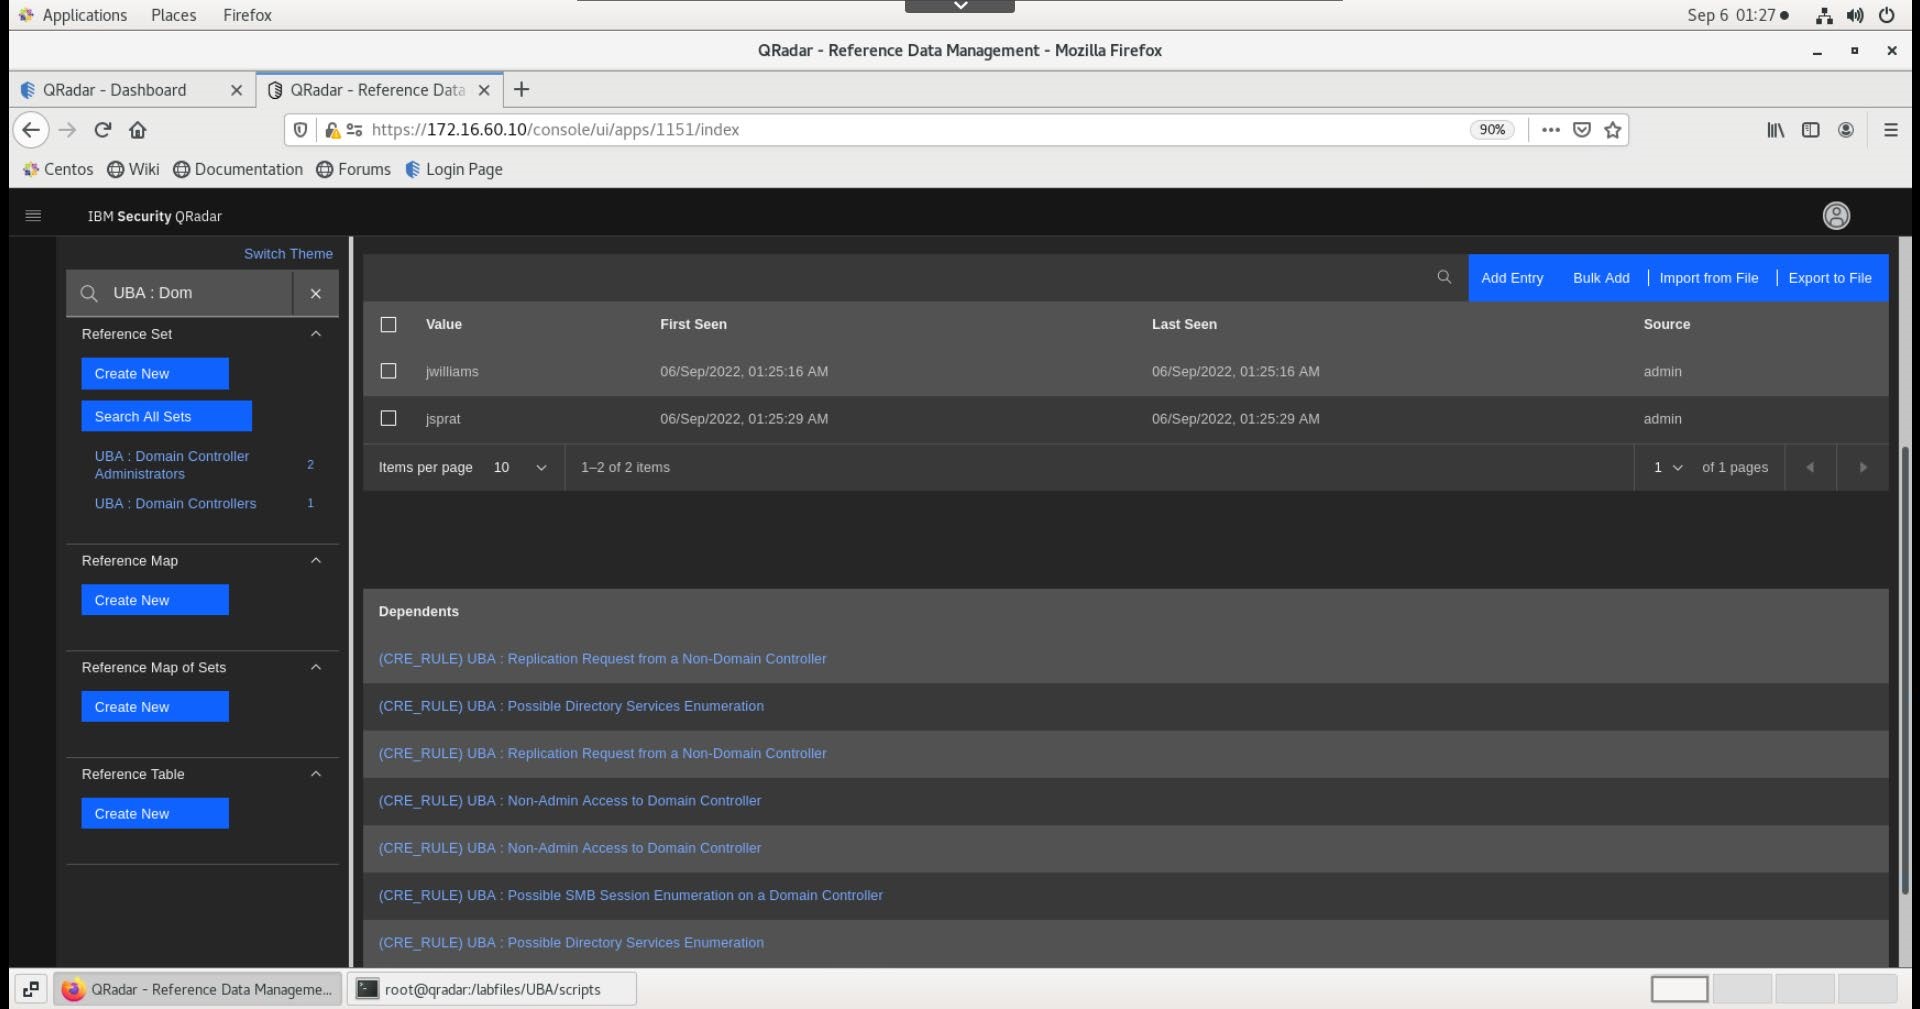
Click Save.
-
Confirm that the entries are added to the list. Also, note the UBA rules associated with this reference set.
Create a rule for the BlueCoat Events
After you have finished the work on the reference sets, navigate to the Use Case Manager app to create a rule for the BlueCoat events that trigger the offense when a user accesses a potentiality risky web site from the Domain Controller.
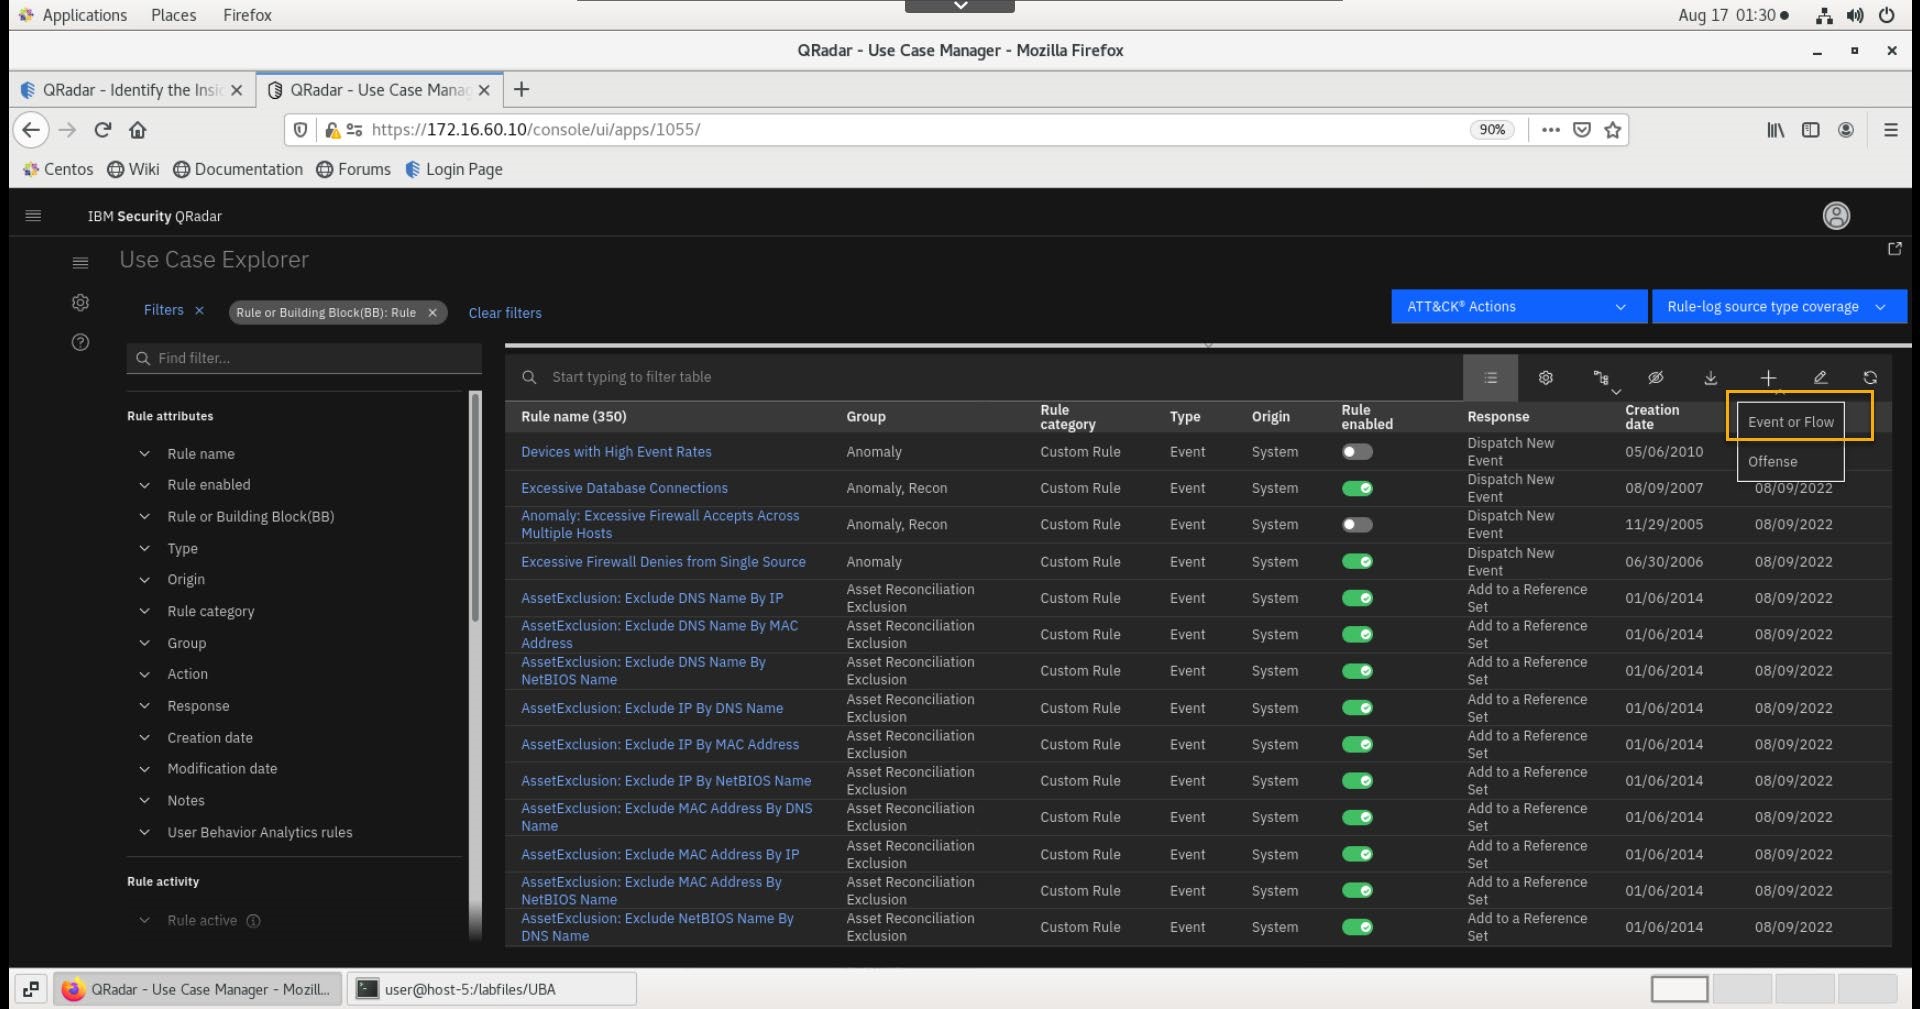
- Go to Main menu > Use Case Manager.
- In the UCM app, click Create rule > Event or Flow.
-
In the Rule Wizard welcome screen, click Next.
If you are not able to click the Next link to advance to the next page in the wizard, try using the Firefox browser. This may be broken in Chrome.
-
As the source of the rule, select Events and click Next.
-
In the Rule Wizard enter the rule name _BlueCoat event from Server.
-
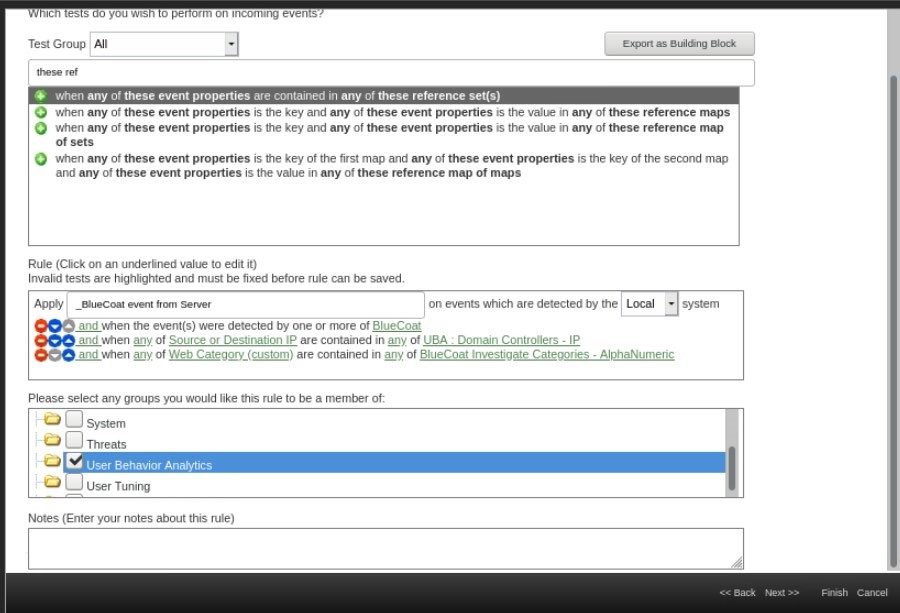
Select the following tests:
-
"when the event(s) were detected by one or more of [these log sources]" , then select the log source BlueCoat.
-
"when any of [these event properties] are contained in any of [these reference set(s)]"
In the event property field, select Source or Destination IP, and for the reference set select UBA : Domain Controllers - IP.
- Select again, "when any of [these event properties] are contained in any of [these reference set(s)]"
For the event property field, select Web Category (custom), and for the reference set select BlueCoat Investigate Categories - AlphaNumeric.
-
-
Scroll down and select the new rule to be a member of the User Behavior Analytics group.
Your final rule should match the following image.
-
Click Next.
-
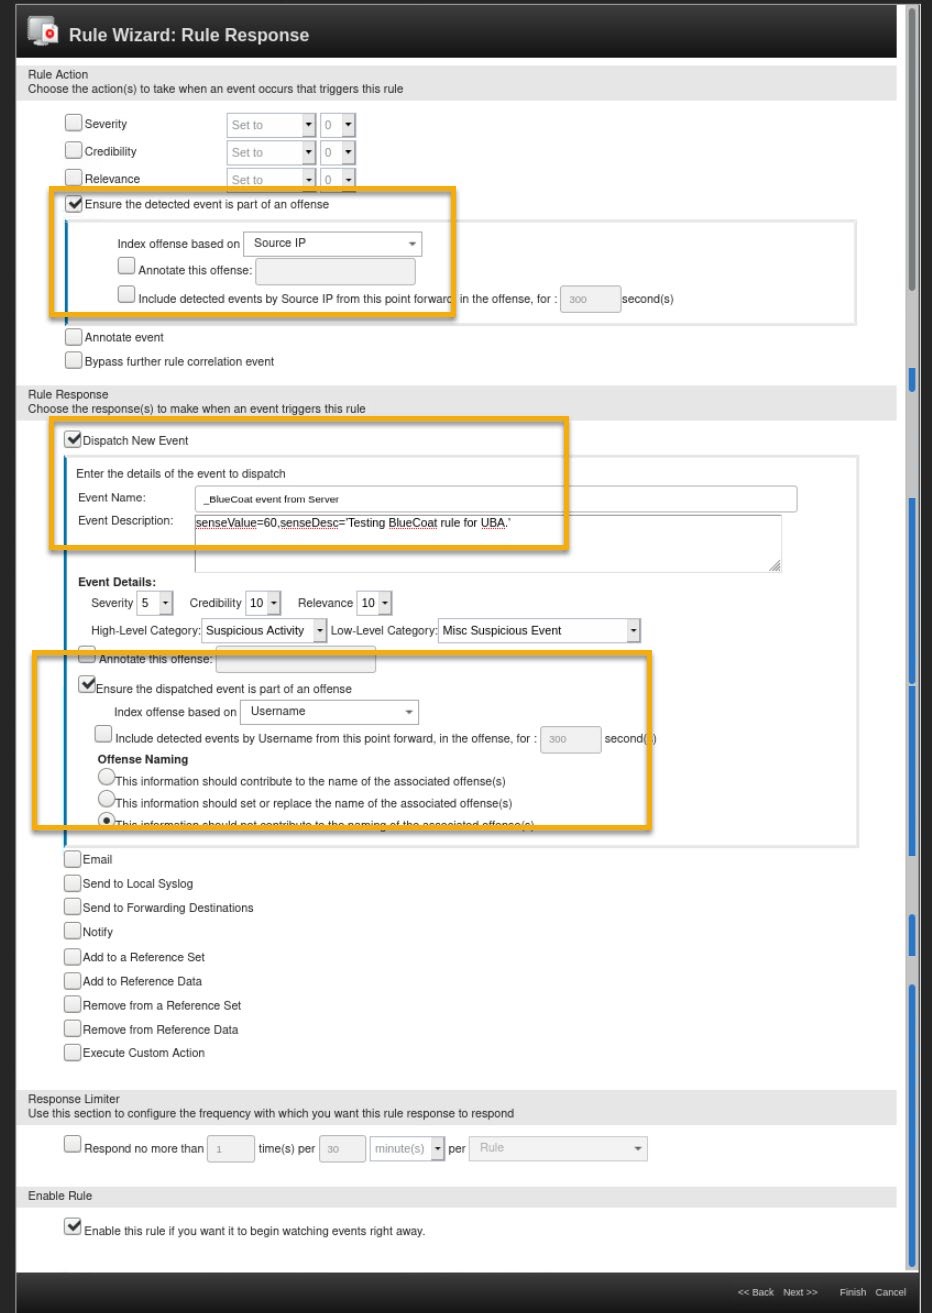
In the Rule Action section, configure as follows:
a. Enable Ensure the detected event is part of an offense.
b. Index offense based on: Source IP.
-
In the Rule Response section, configure as follows:
a. Select Dispatch New Event.
b. Event Name type: _BlueCoat event from Server
The Event Name should match the rule name otherwise it can impact the process time of the events in the UBA
c. Event Description type: senseValue=60,senseDesc='Testing BlueCoat rule for UBA.'
The default rules that come with UBA have the risk score (senseValue) parameter set between 5 to 25 points. You set this value higher in the lab for the demonstration purposes. However, you can adopt risk scores in your organizations based on the important activities that you would like to track.
The previous versions of UBA required that you create and modify UBA risk score using this method. In the latest version of UBA keeps the risk score in the UBA in a QRadar reference table and preferred way to modify and update the risk score is by using the Use Case Manager app. We demonstrate that in the next section "Modify the existing UBA rule".
d. High Level Category: Suspicious Activity.
e. Low Level Category: Misc Suspicious Event.
The previous versions of UBA required that High Level Category for the UBA related event is Sense. This is not the case anymore and you can pick any High-Level Category.
f. Select Ensure the dispatched event is part of an offense.
g. Index offense based on: Username.
Only offenses that are indexed by the username property are displayed on the UBA dashboard. Thus, you should index this offense by the username to have the proper lab outcome.
h. Offense Naming: This information should not contribute to the naming of the associated offense(s).
Your final rule settings should match the following image.
-
Scroll down and ensure that this new rule is enabled.
-
Click Next.
-
Review the rule settings and click Finish.
Modify the existing UBA rule
The IBM QRadar UBA application installs many QRadar rules that apply to various UBA use cases related to different user behavior. Some of the rules are disabled by default. One example is a rule named UBA : Non-Admin Access to Domain Controller.
To enable the use case that is supported by this rule, you must:
- Add all administrator accounts to the UBA : Domain Controller Administrators reference set.
- Add the IP address of the Domain Controller to the UBA : Domain Controllers reference set. - You did this step in the previous chapter.
- Enable the rule.
Because you have already updated the UBA : Domain Controllers reference set, and the test user is not in the UBA : Administrators reference set, you must only enable the rule to support the UBA use case.
To work with rules specific to UBA, perform the following steps in the UCM app.
-
In the Filter section, select User Behavior Analytics rules > Rule is related to the app.
-
Click the Apply Filters.
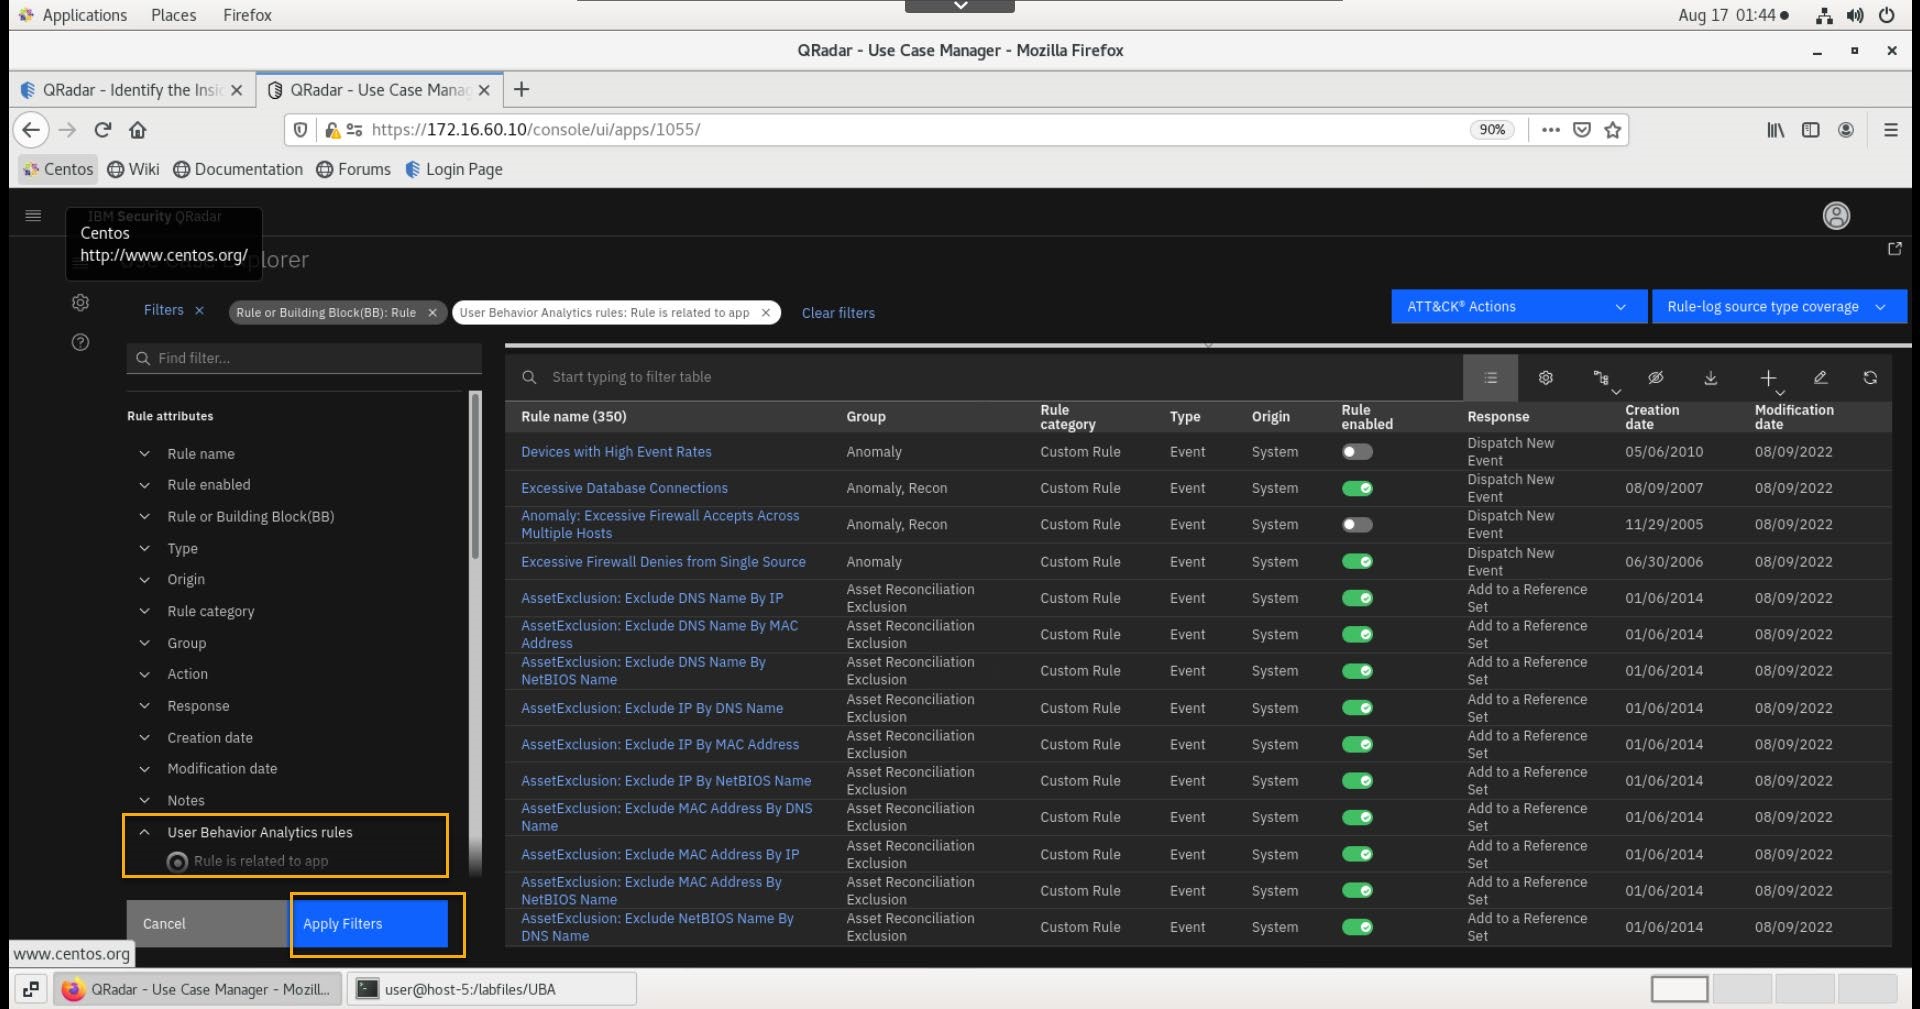
-
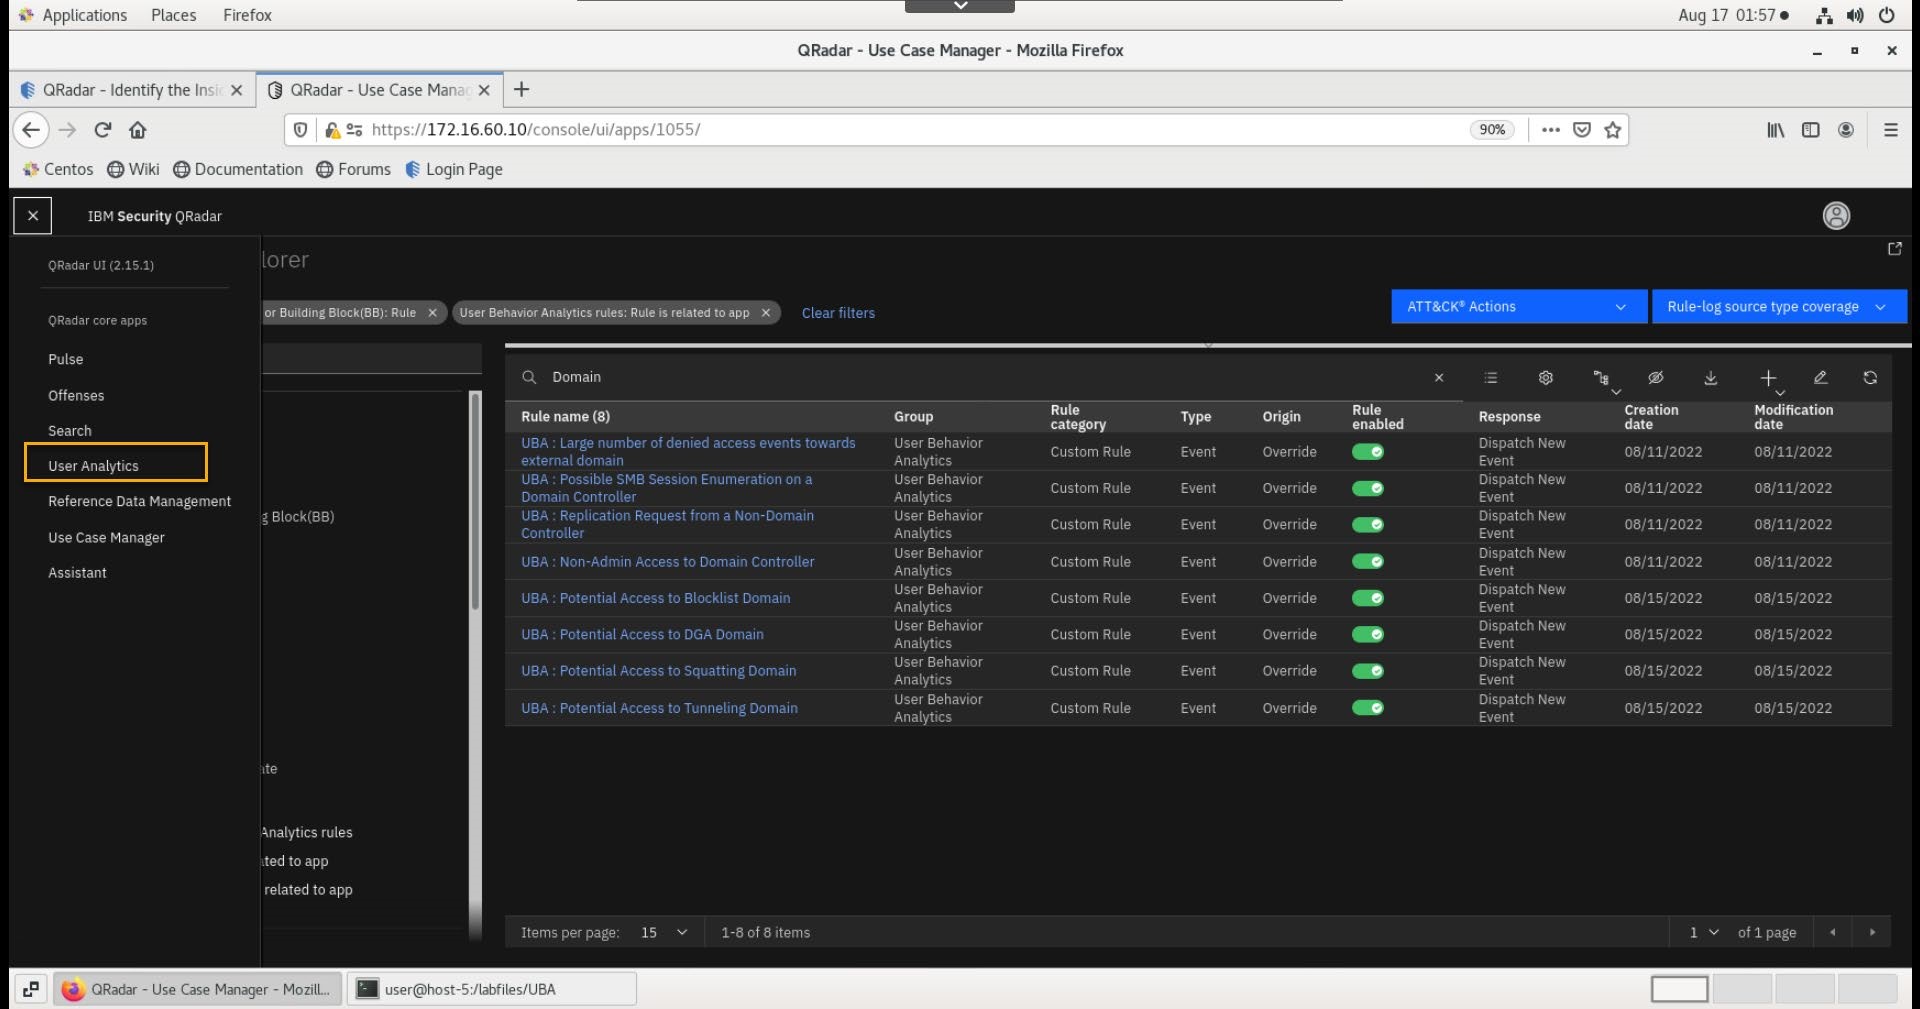
The right part of the screen displays the QRadar rules that are relevant for the UBA application.
-
In the filter table search field, type: Domain.
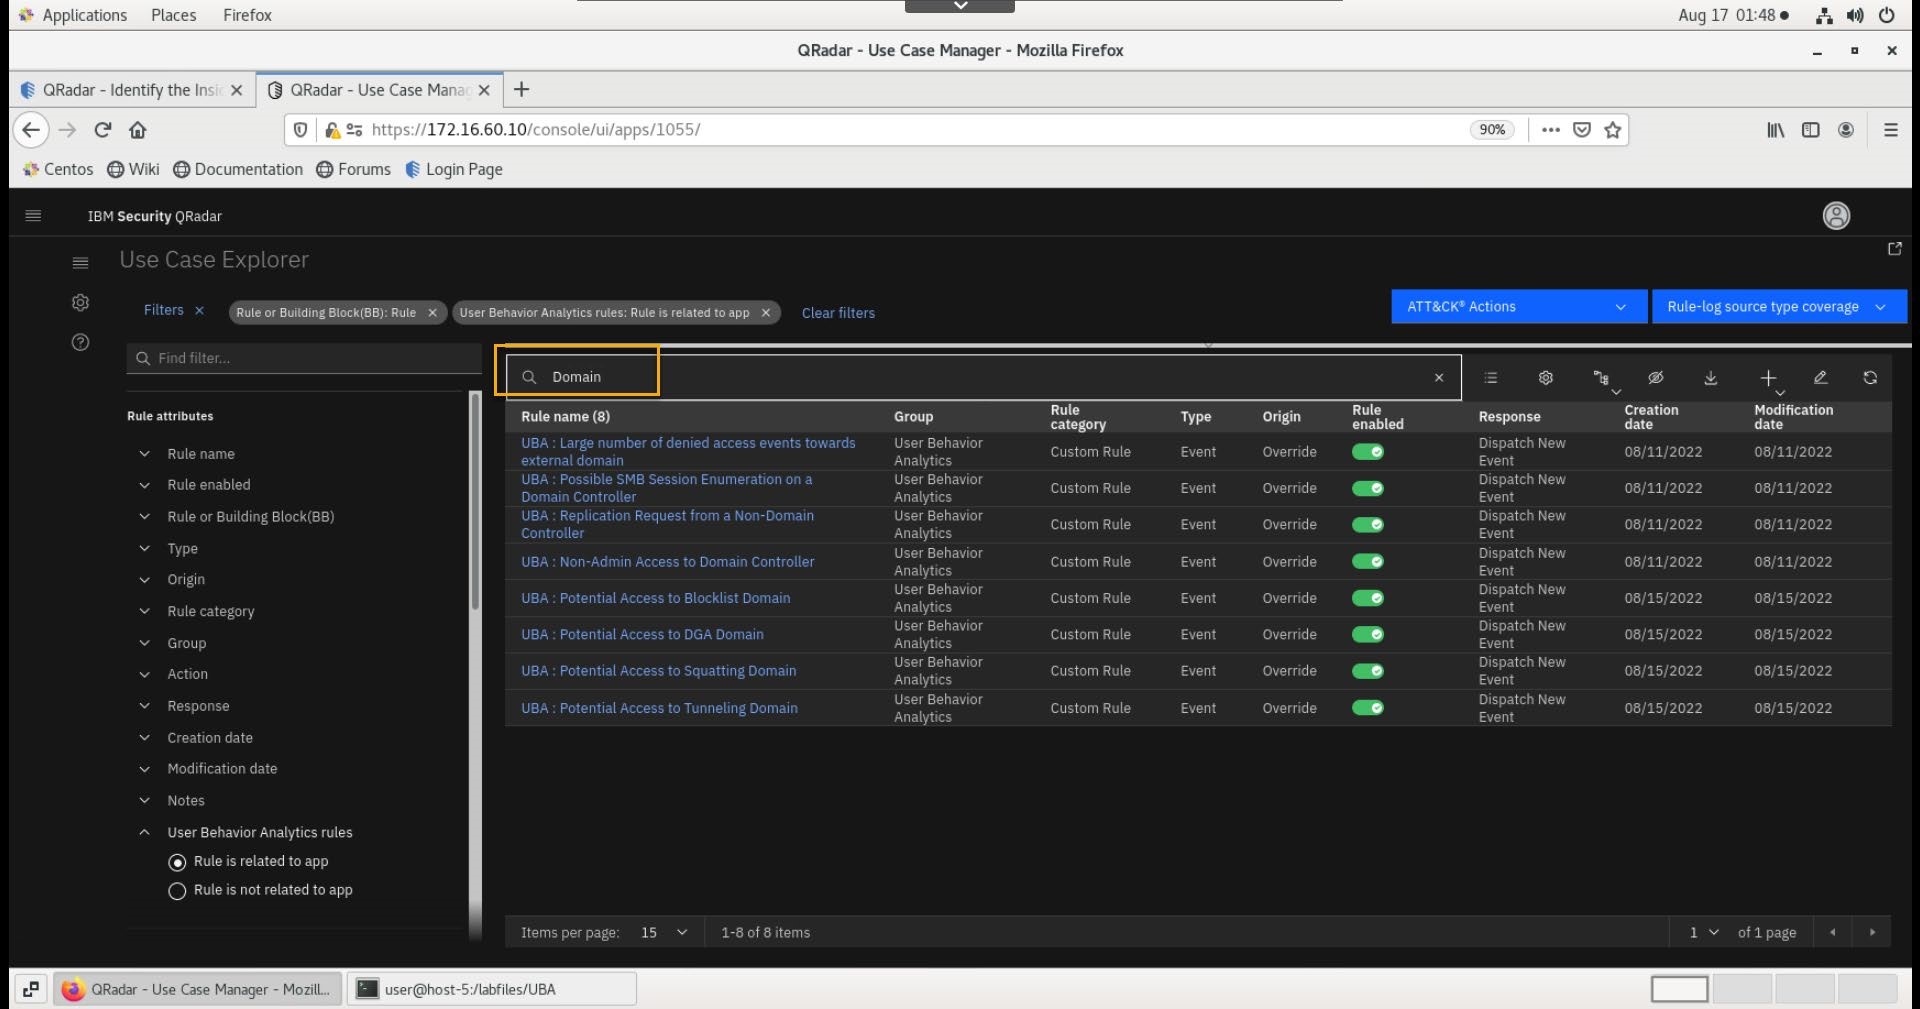
-
From the list of UBA rules related to domain, click the Non-Admin Access to Domain Controller rule.
-
In the Rule details window, open the User Behavior Analytics risk score section.
-
Increase the risk score to 30 points.
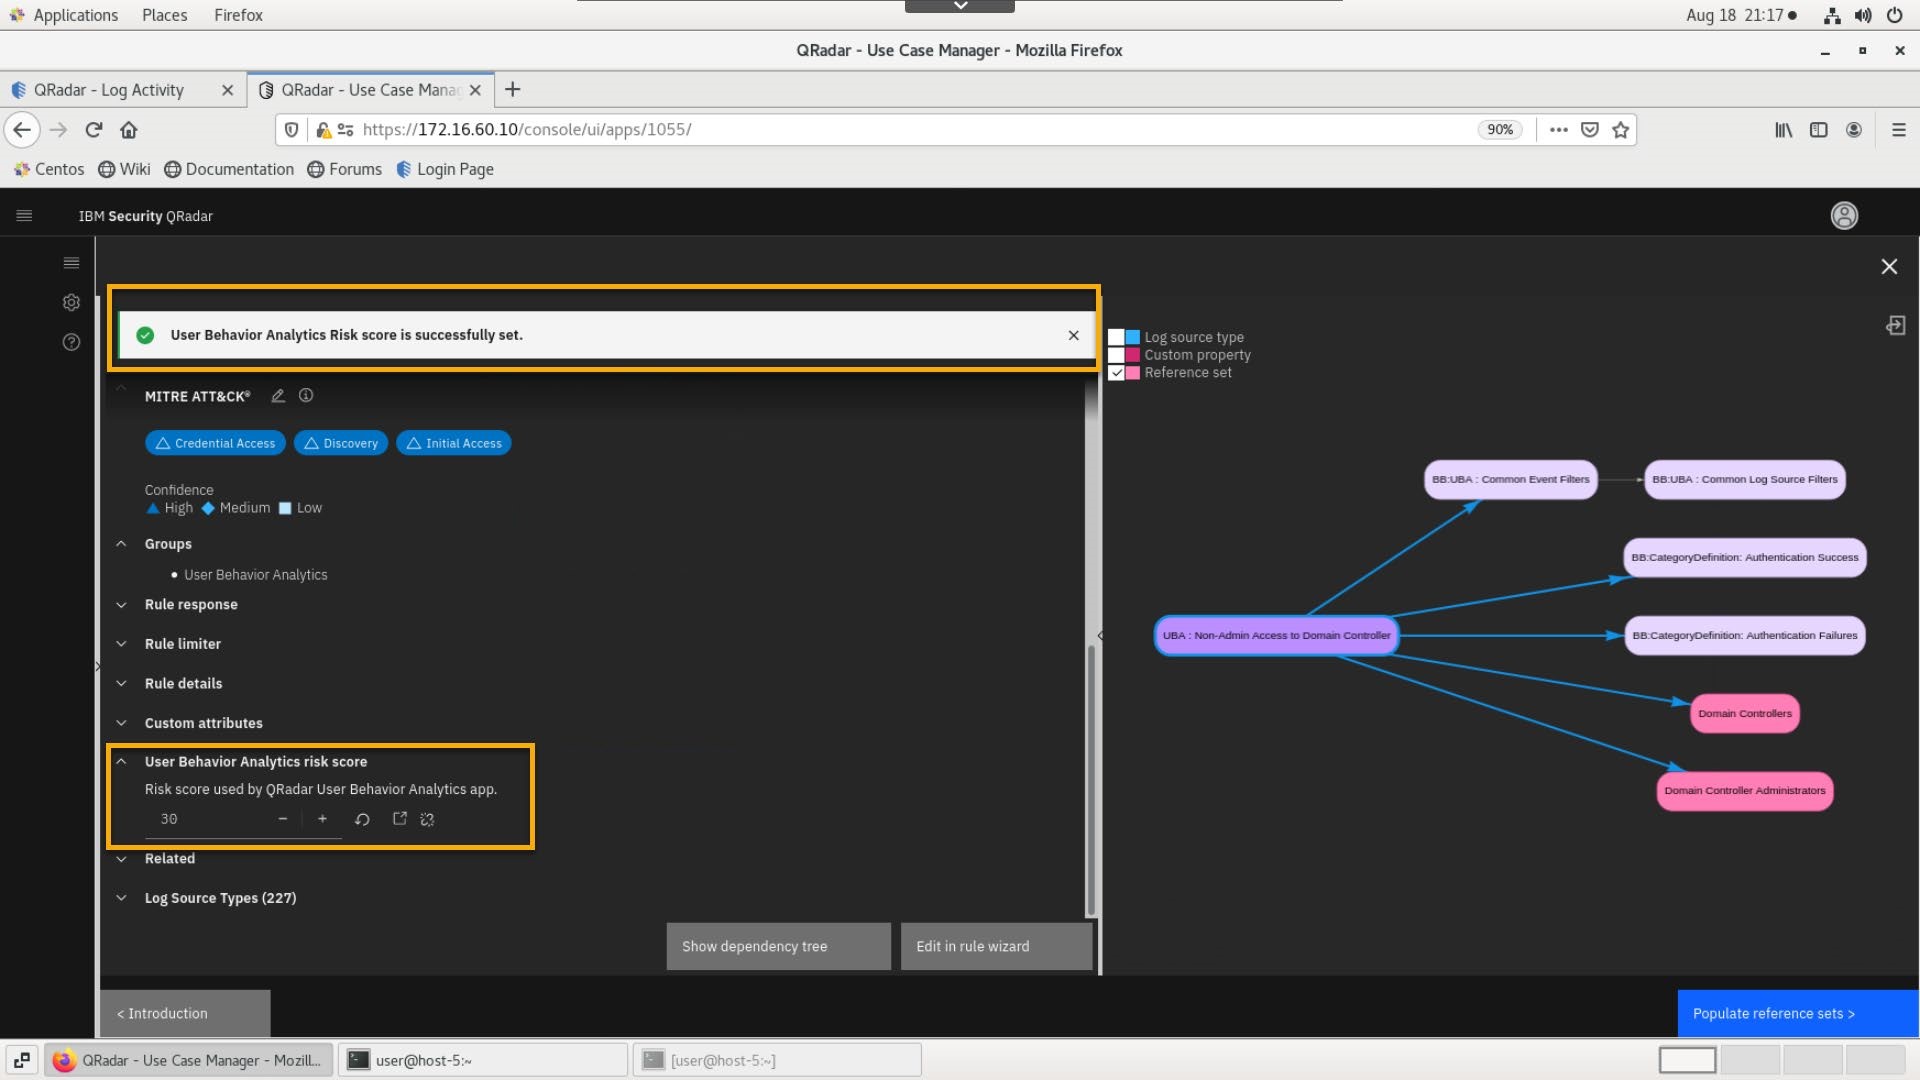
At the right side of the screen, note the dependencies between the rule and the reference set that you have just edited.
-
You can close the banner informing you about risk score changes
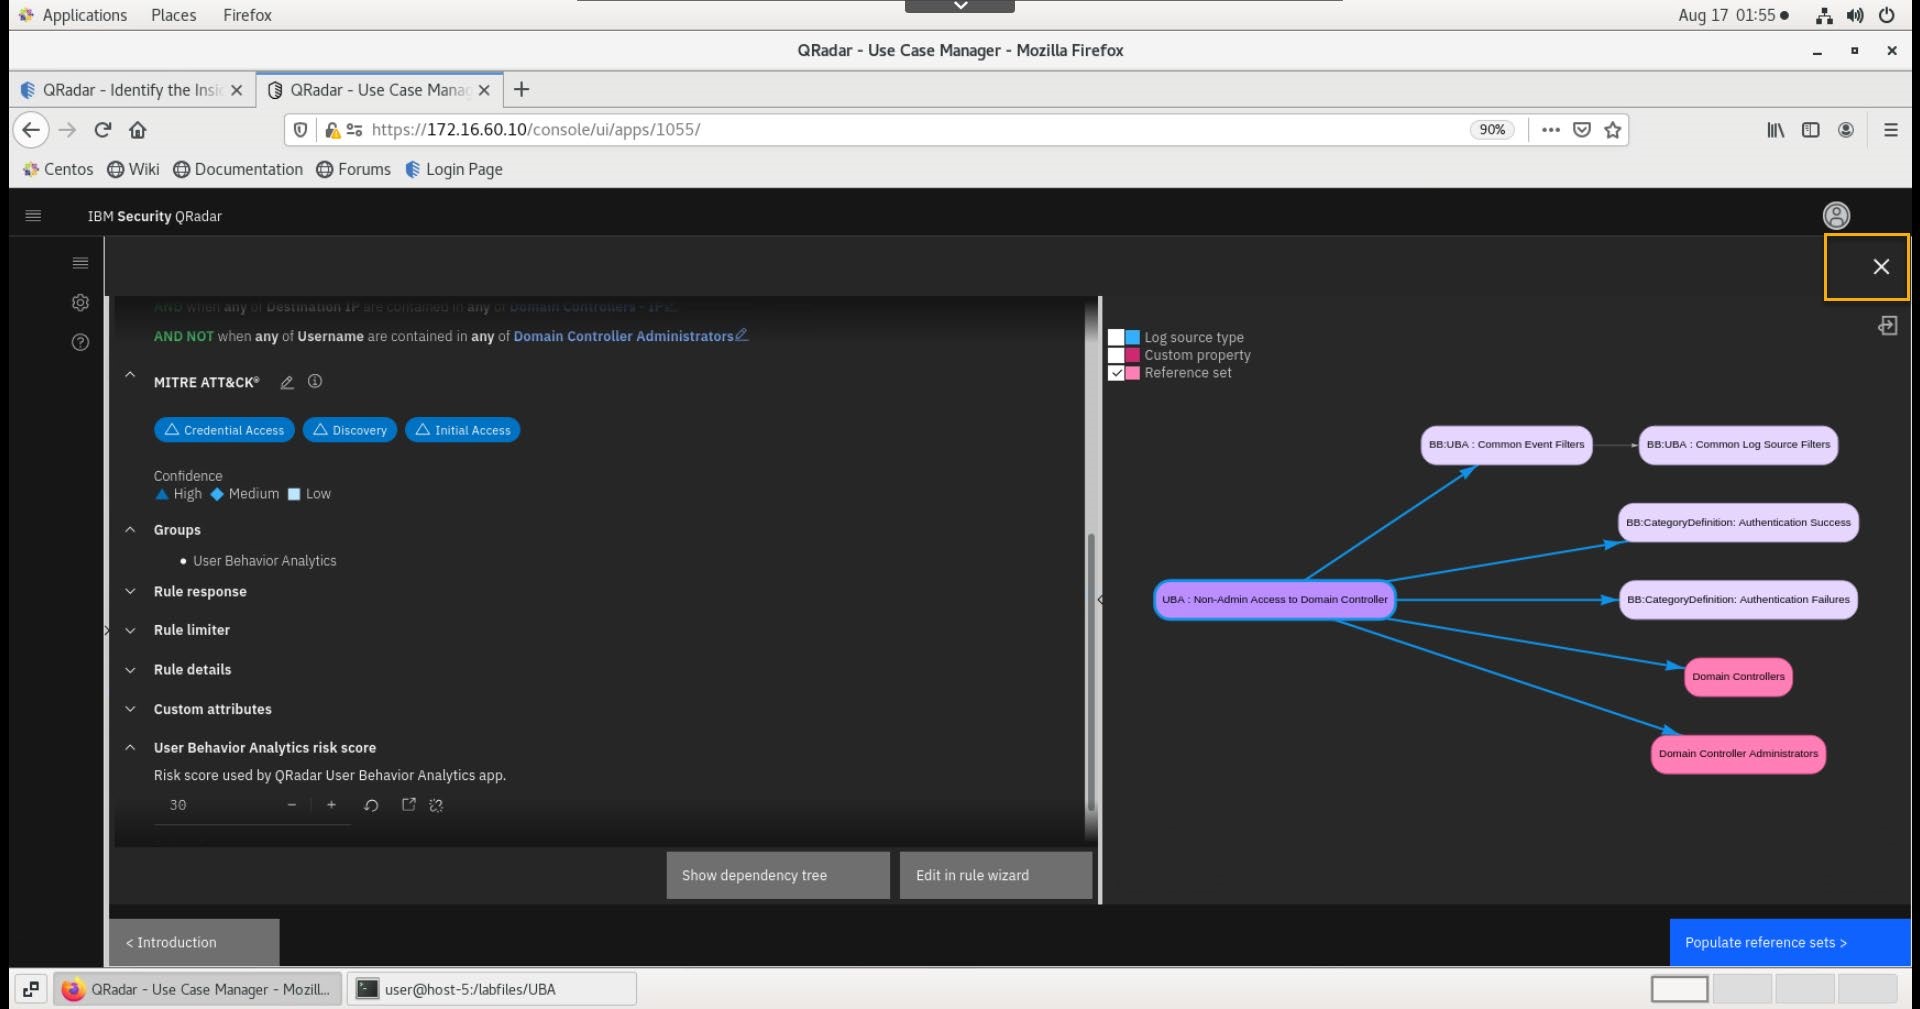
-
Close the rule details.
Modify UBA settings
Before you run the script for the investigation scenario, you must review the UBA settings and modify them:
- Go to the New UI Main menu > User Analytics.
- In the UBA dashboard, click the UBA Settings icon, located in the upper right corner.
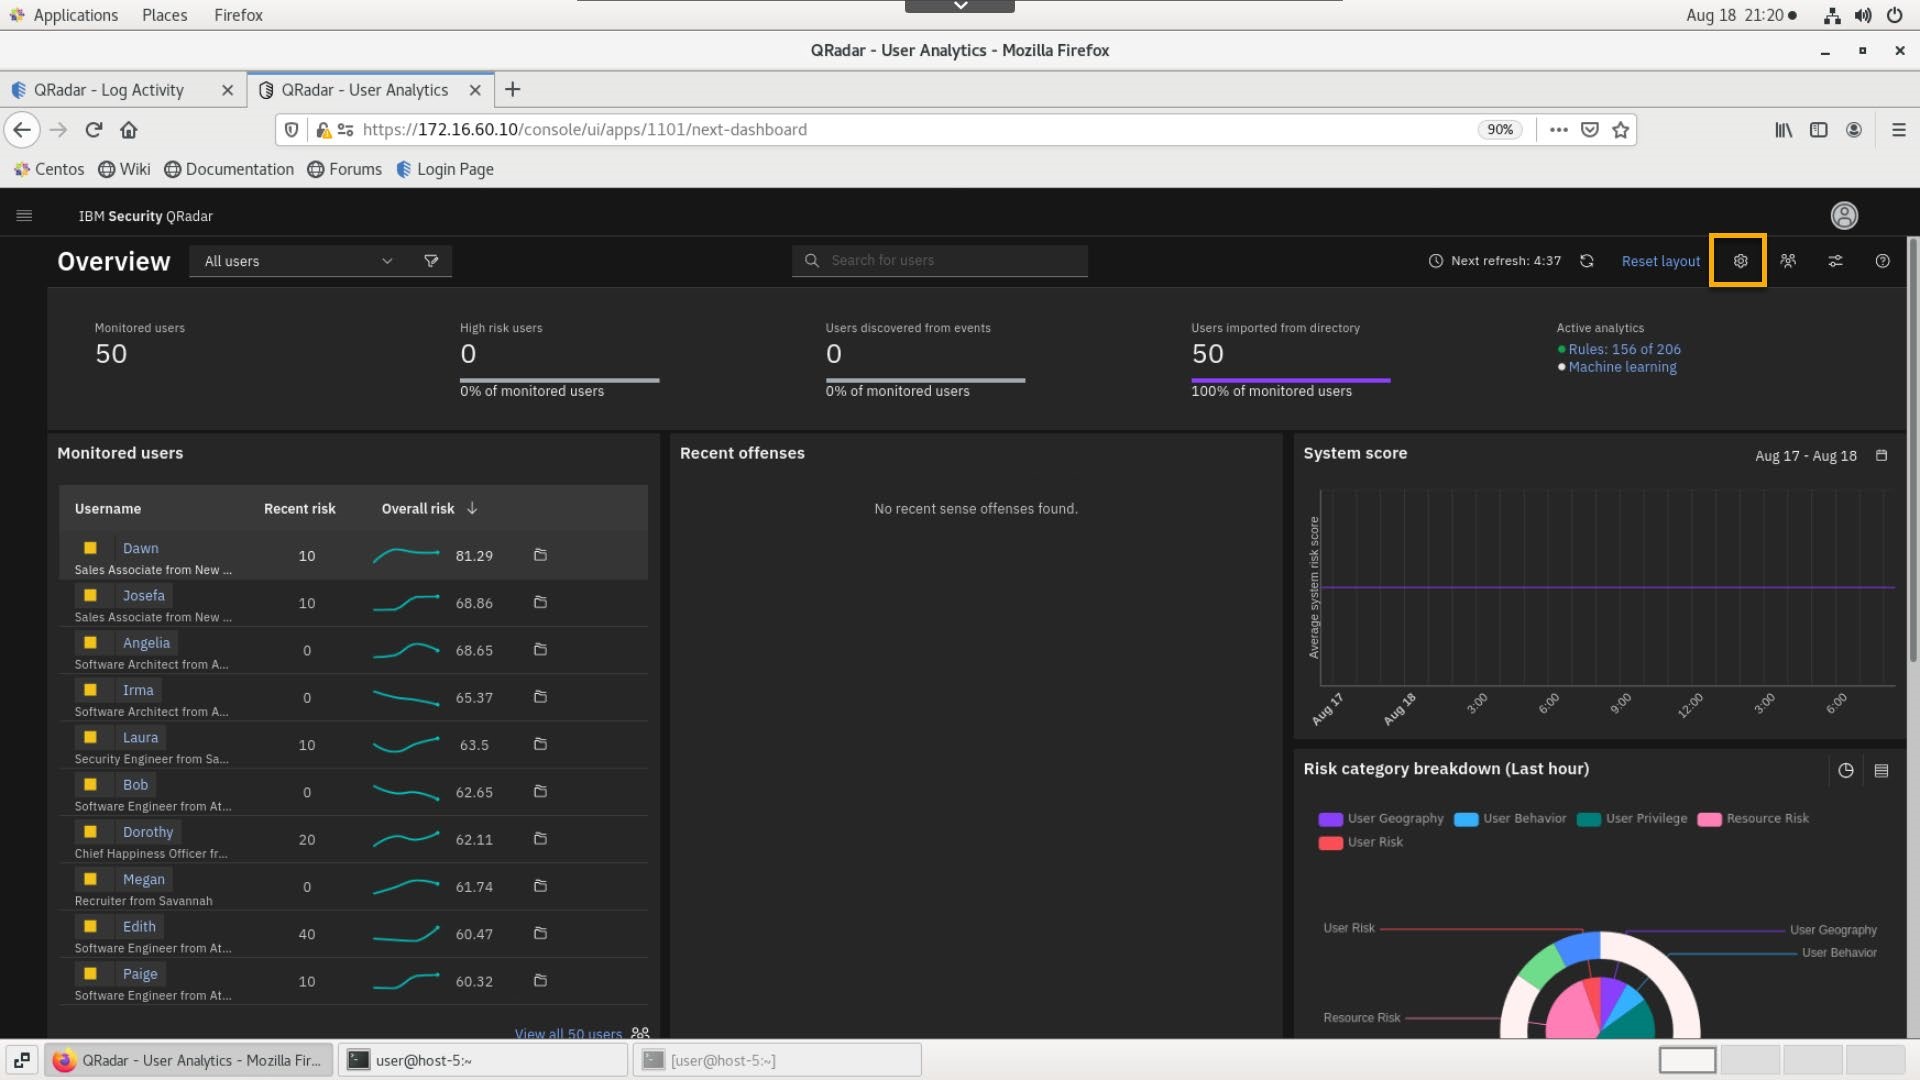
The UBA Settings page opens in a new browser tab.
-
In the Risk threshold to trigger field, change the value to 120.
-
Enable Generate an offense for high-risk users.
-
In the Decay risk by this factor per hour field, change the value to 0.5.
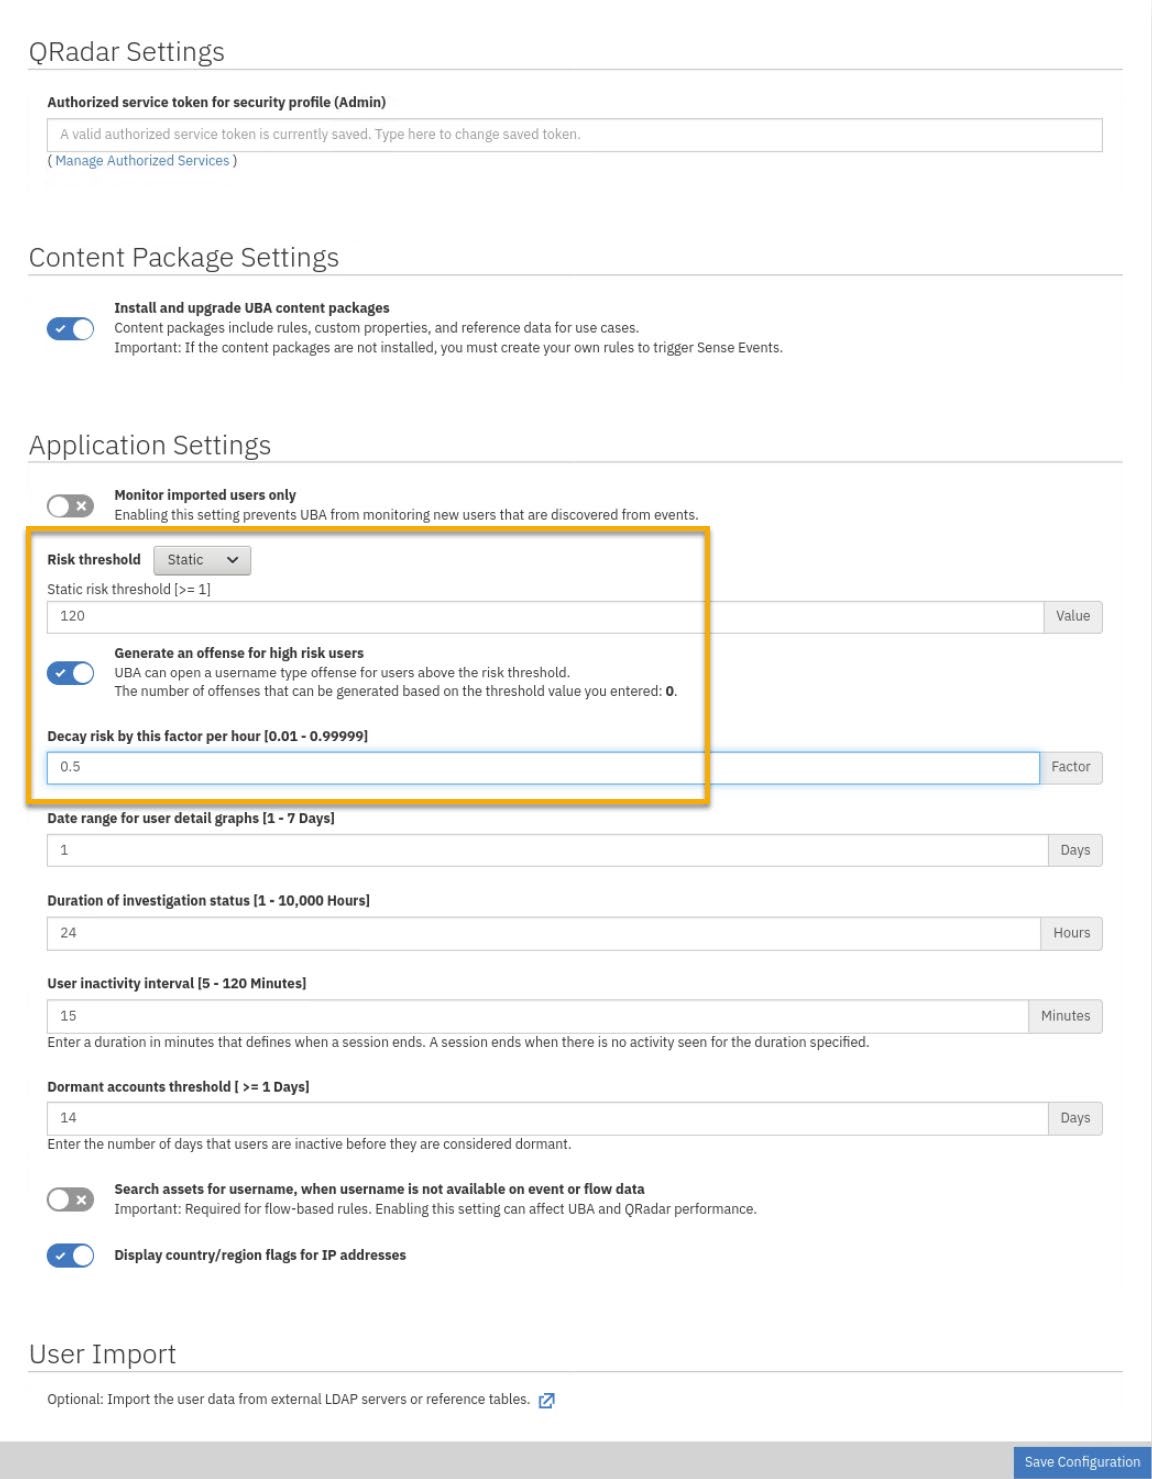
-
Review the other settings.
-
At the bottom of the page, click Save Configuration.
-
Close the UBA Settings browser tab, and switch back to the UBA dashboard.
Create a Watchlist
One way to assist in user investigations is to create watchlists. Watchlists can be used to monitor a particular set of users, for example service accounts, so they are more visible even if their scores are not high. Perhaps your admin's actions are more critical so you want to increase their scores to be five or ten times higher. Or you want to have HR department always monitored with machine learning. These things can be done by creating a watchlist for the users.
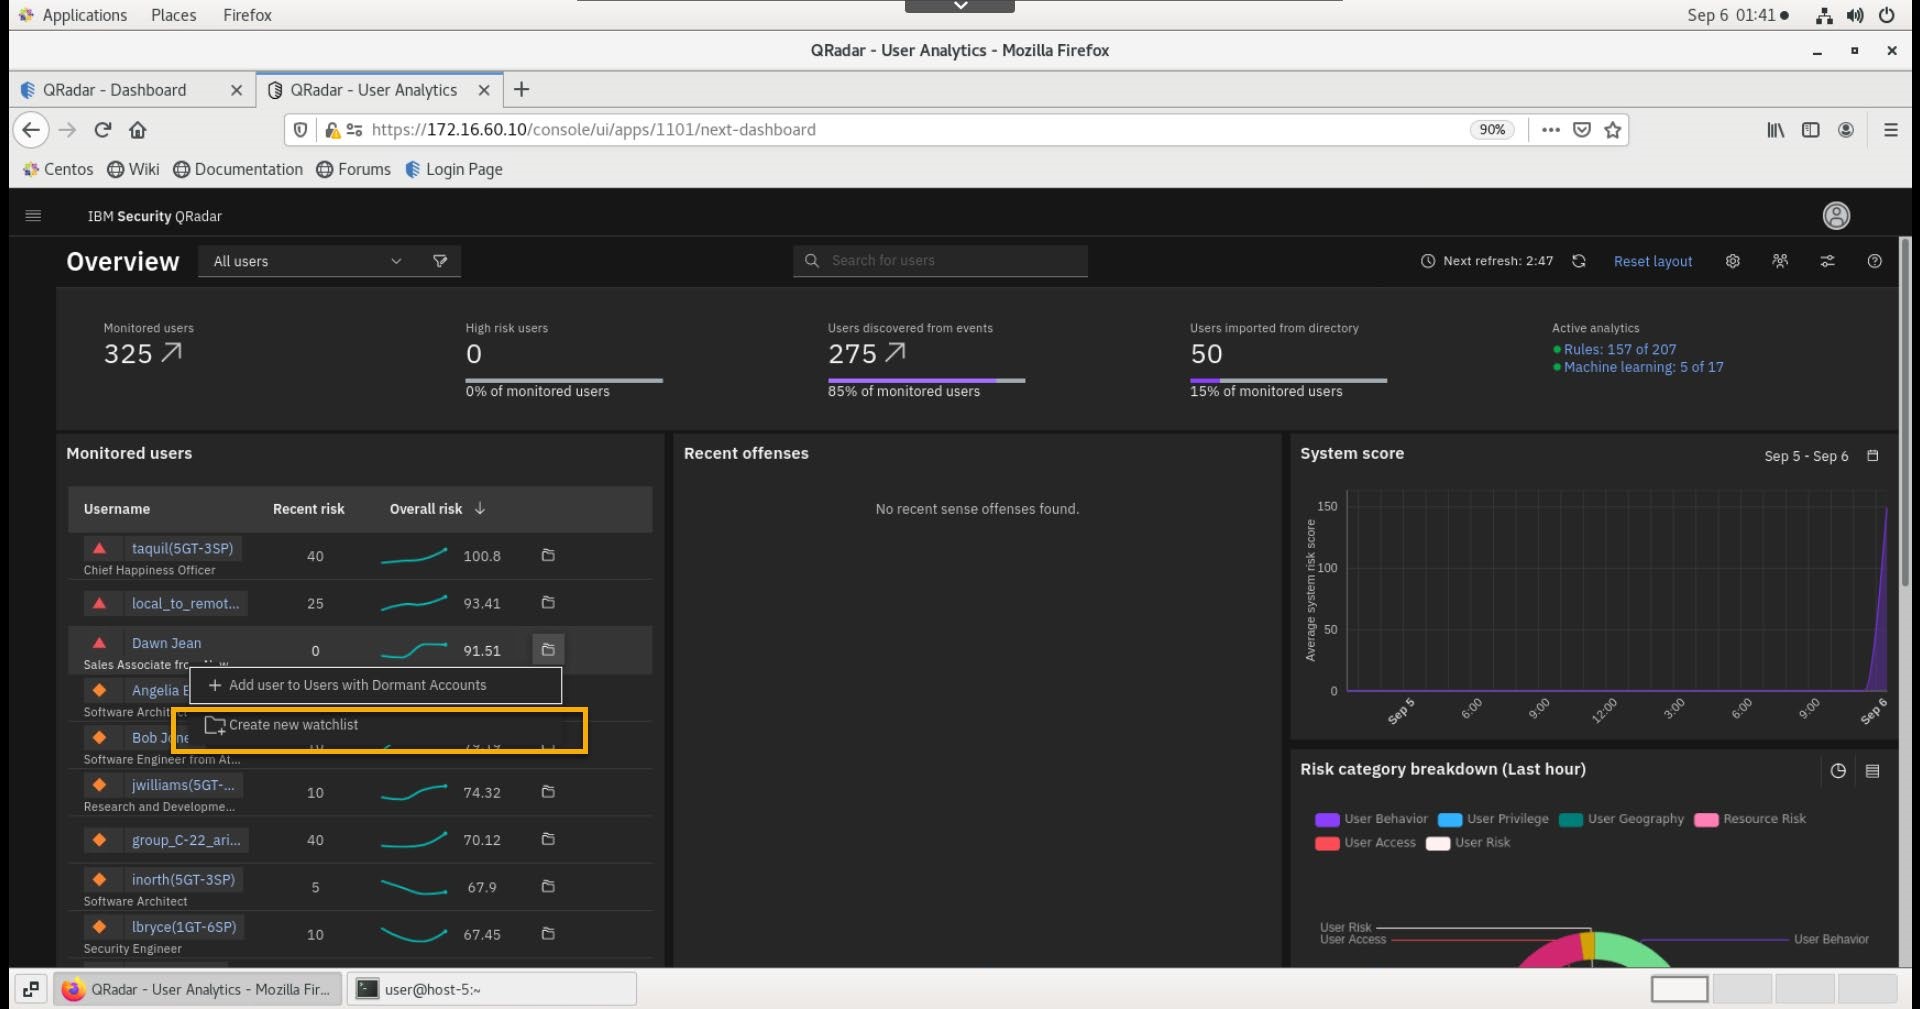
-
At the Overview page, select the Watchlist icon next to any user.
-
From the menu, select Create Watchlist.
-
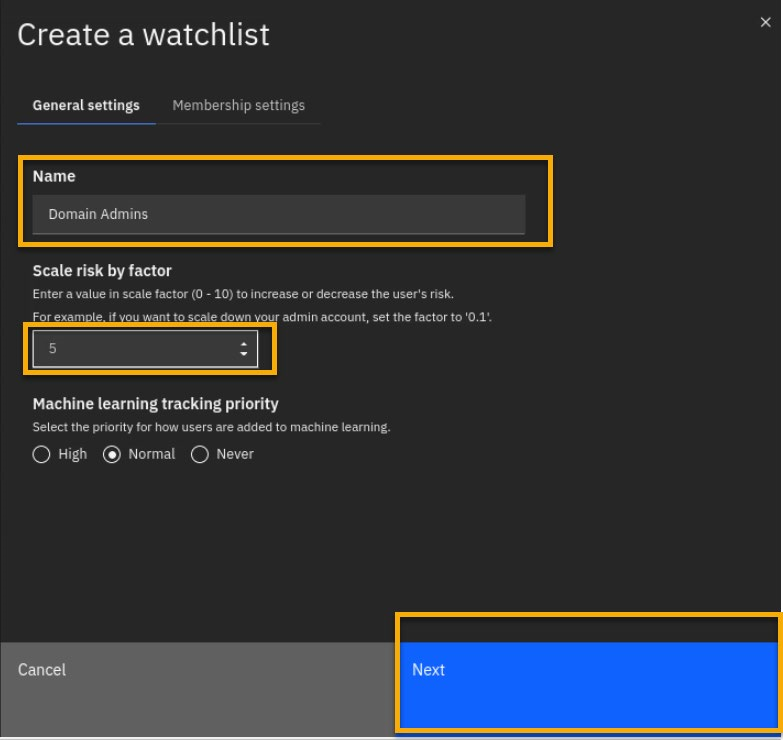
In the Create watchlist dialog, General settings tab, give the watchlist the name Domain Admins.
-
Under Scale risk factor, set value to 5. You can also select to give the users high, normal or no priority to be tracked by machine learning. We will leave it normal here.
-
Click Next.
-
On the Membership setting tab, in the search field under Import from QRadar reference set, type Administrators
-
From the list, select UBA : Domain Controller Administrators.
Note: watchlists can also be created by querying the UBA database for expressions in one of the fields imported from User imports.
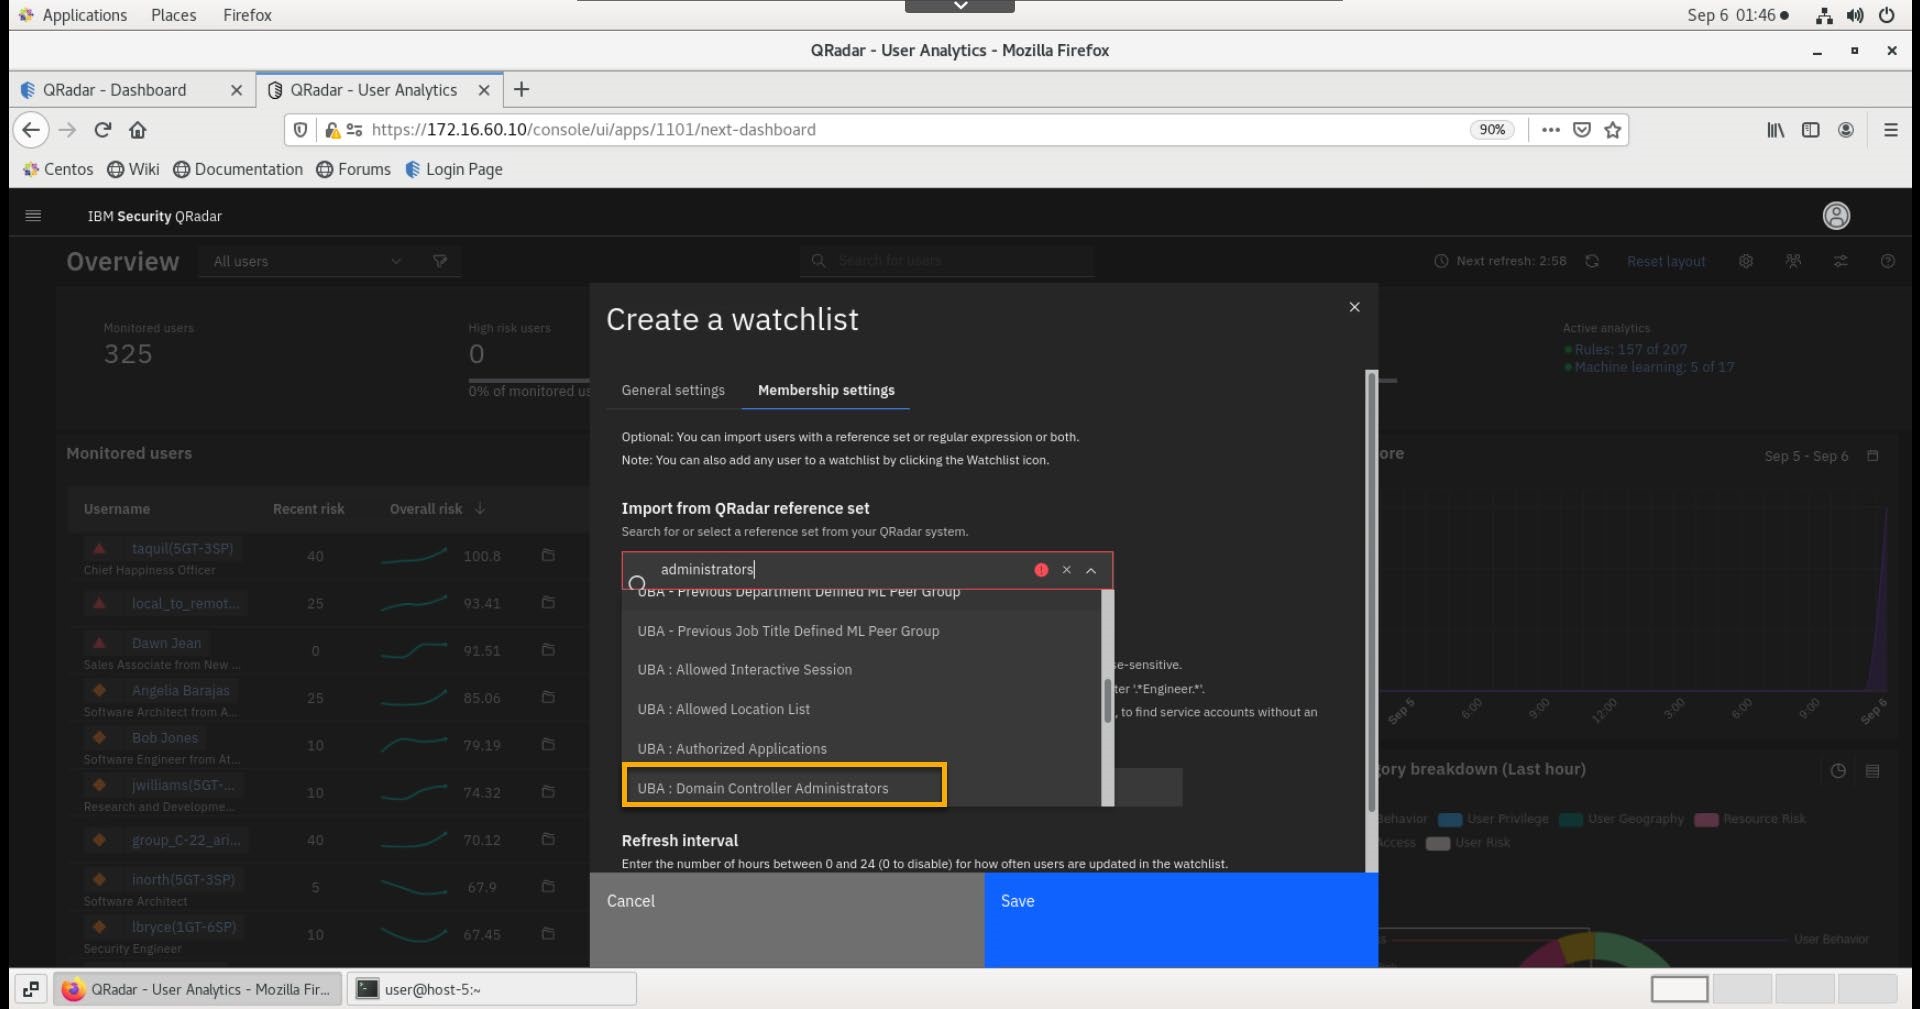
- Click Save.
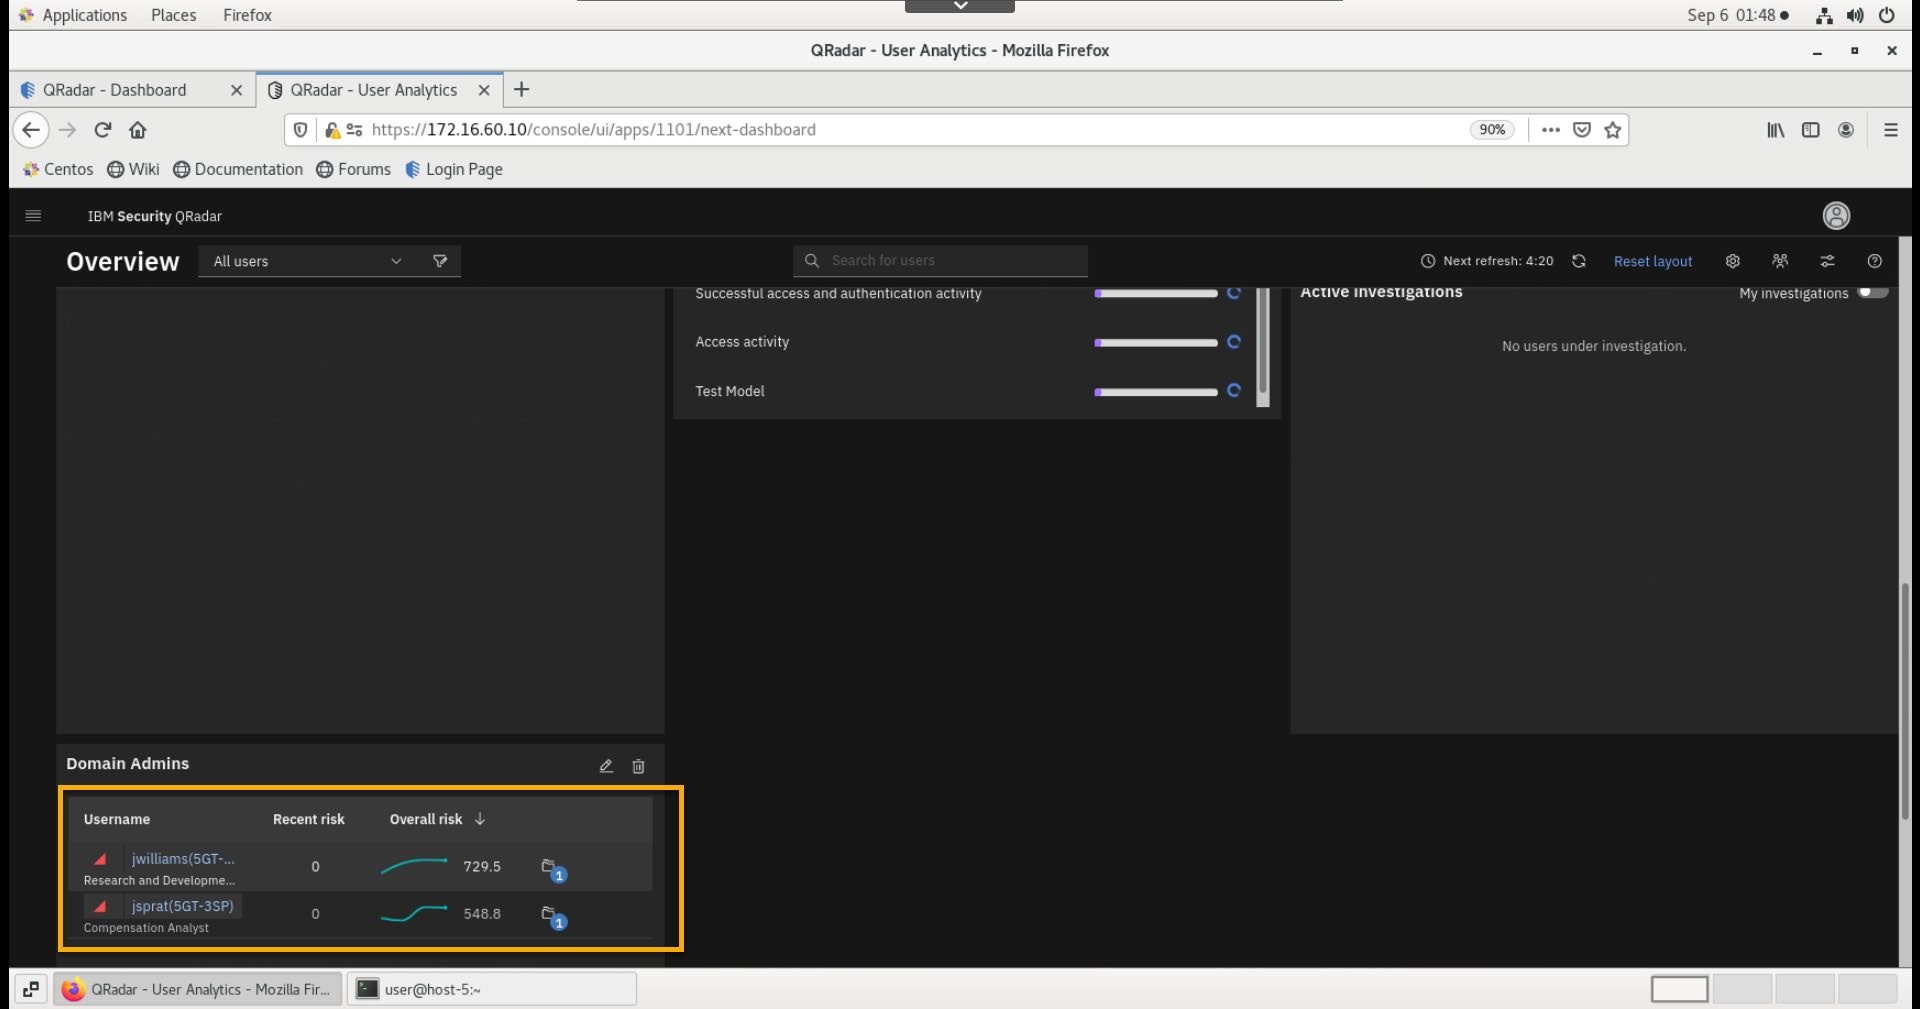
Note back on the UBA Overview page, a new watchlist named Domain Admins is created and the two admins added to the reference set earlier are listed in the set.
Investigate Users
After you have prepared the lab for the investigation, you perform the following tasks:
-
Generate logs that inject the scenario flow into the QRadar appliance.
-
Investigate users from the UBA dashboard.
Generate logs
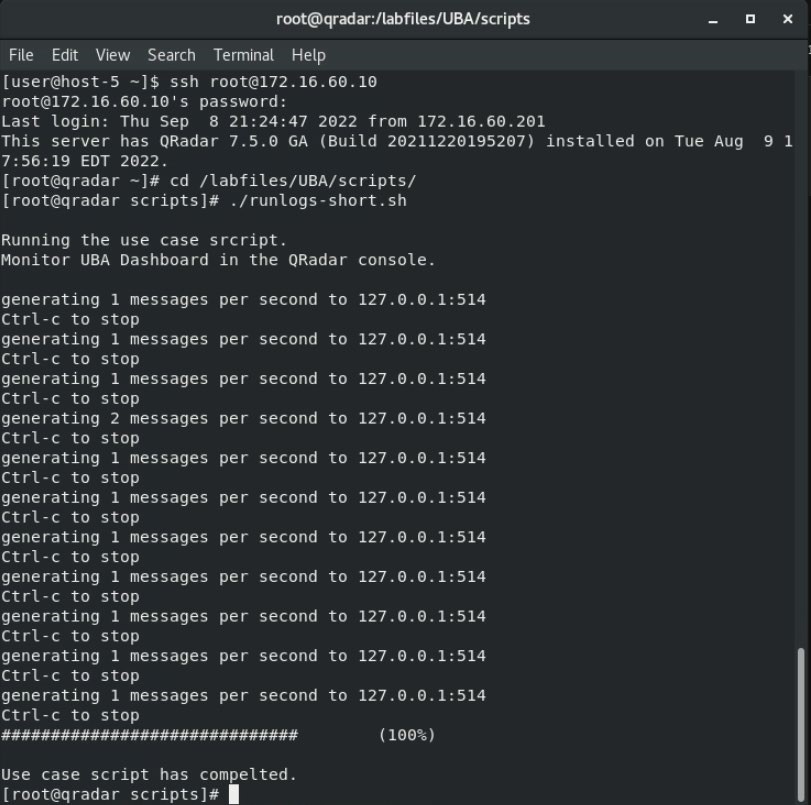
- On the Workstation, open the terminal window and run the following commands:
cd /labfiles/UBA/scripts
bash./runlogs-short.shbash
- Review the log output and wait for 1 minute.
Investigate users from the UBA dashboard
Because this is a demonstration system with limited resources, it might take a few minutes to process the logs, process relevant QRadar and UBA rules, and present the results in the UBA dashboard.
- Double-click a few times in the User Analytics tab, or use the Refresh button in the UBA dashboard, until you see the user mcoy (1GT-6SP) with a Risk Score of 120 or more, at the top of the Monitored users list.
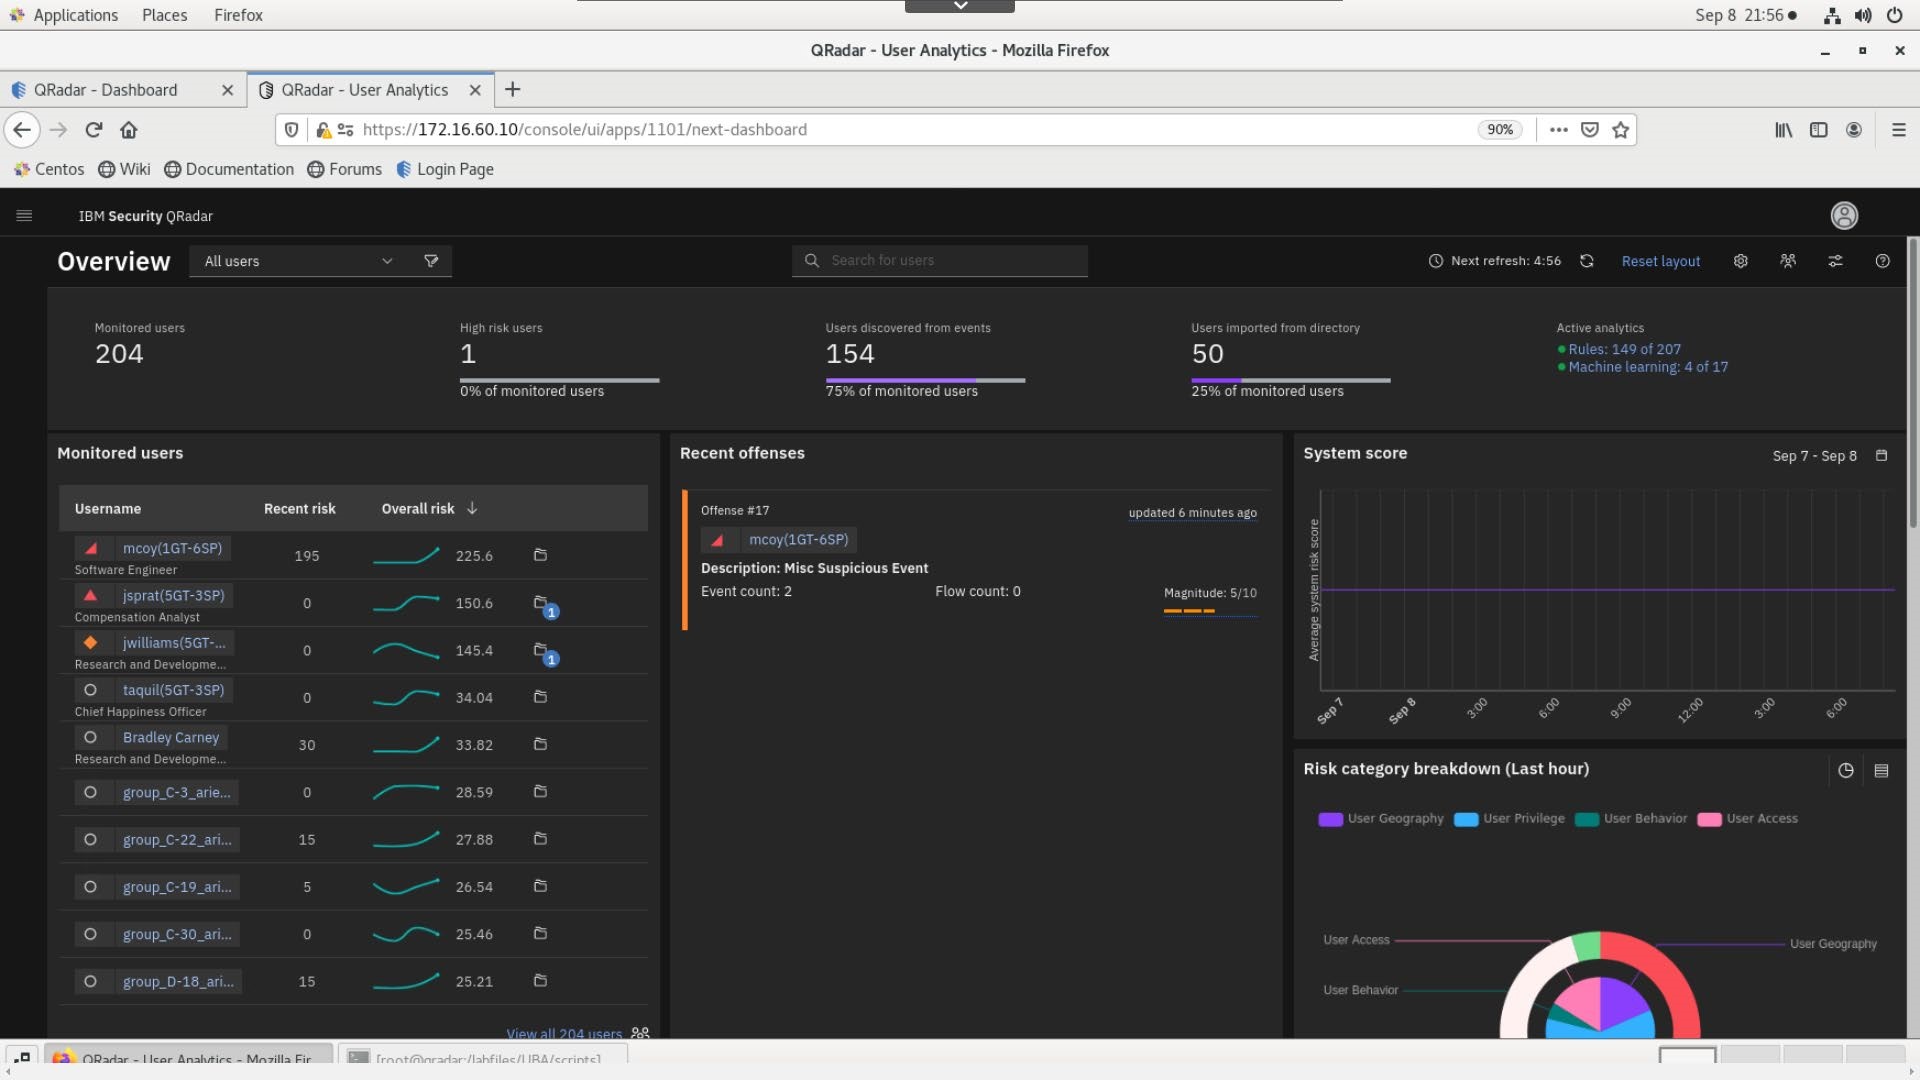
- Review the results on the dashboard and note the following:
-
The application monitors 50 users imported from a directory server (LDAP). The overall number of monitored users can be higher because some of them can be discovered through the events.
-
Mary Coy (mcoy) user displays a high risk level. The Risk score is shown in dark red.
The dashboard shows over 200 points for Mary's risk score, but your dashboard might show slightly different results, due to the decay factor and QRadar processing time of the events and offenses.
-
The Recent Offenses list shows the offenses related to user activity. In this case, Mary Coy is associated with two offenses:
-
Misc Suspicious Event
-
UBA Offense - User crossed risk threshold
-
The System Score chart is empty because this lab environment was started recently.
-
The Risk Category Breakdown diagram presents an overall snapshot of user activity from the last hour.
In the screen capture, you can see that User Privilege, Resource Risk, and User Geography are the most critical categories.
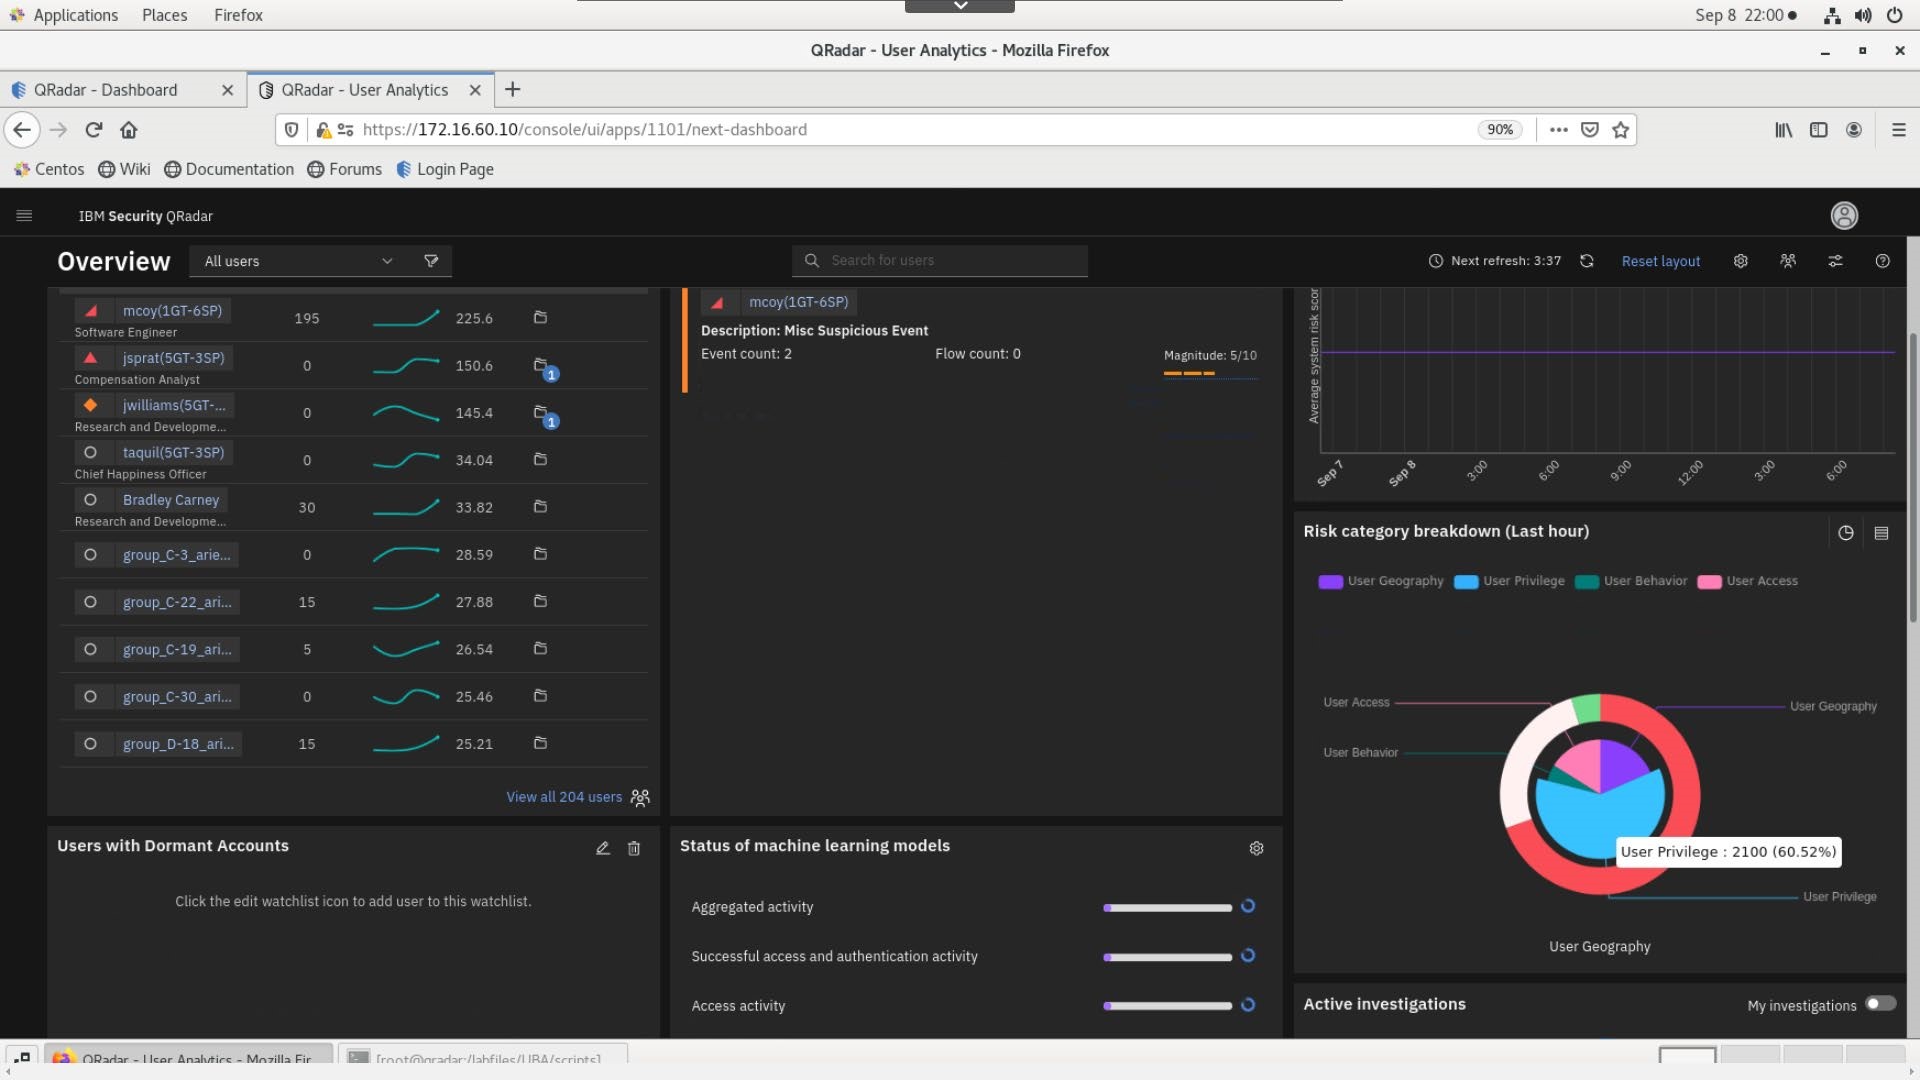
- Because the
playuba.shscript generates random user activity into QRadar, this diagram, and the monitored user diagram might show different results in your lab instance.
Analyze Mary Coy's user details in the UBA dashboard
Mary Coy shows as a high risk user with an associated offense. Review the user activity for Mary Coy in more detail.
- From the Dashboard > Monitored Users list, click Mary Coy.
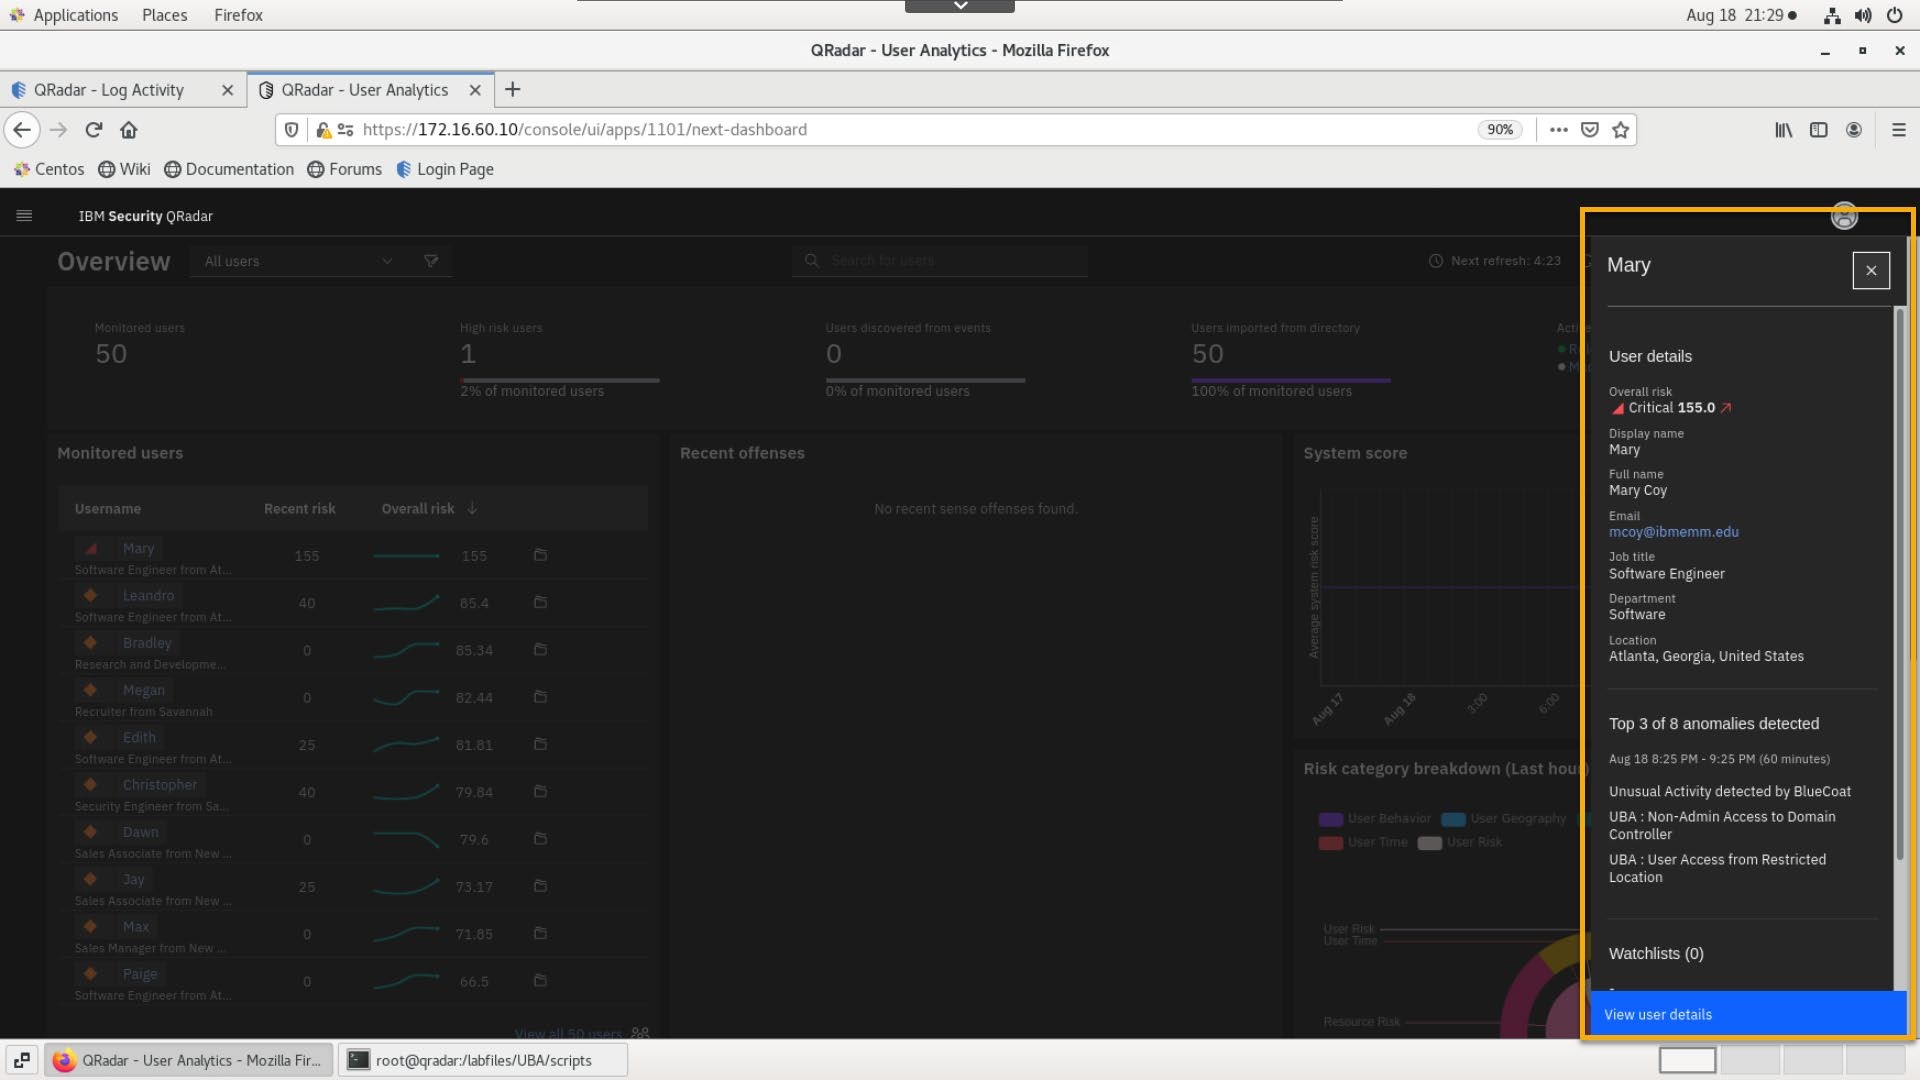
- Review user details in the side panel and click View user details.
Note: At this point of time, ML graphs are not yet generated.
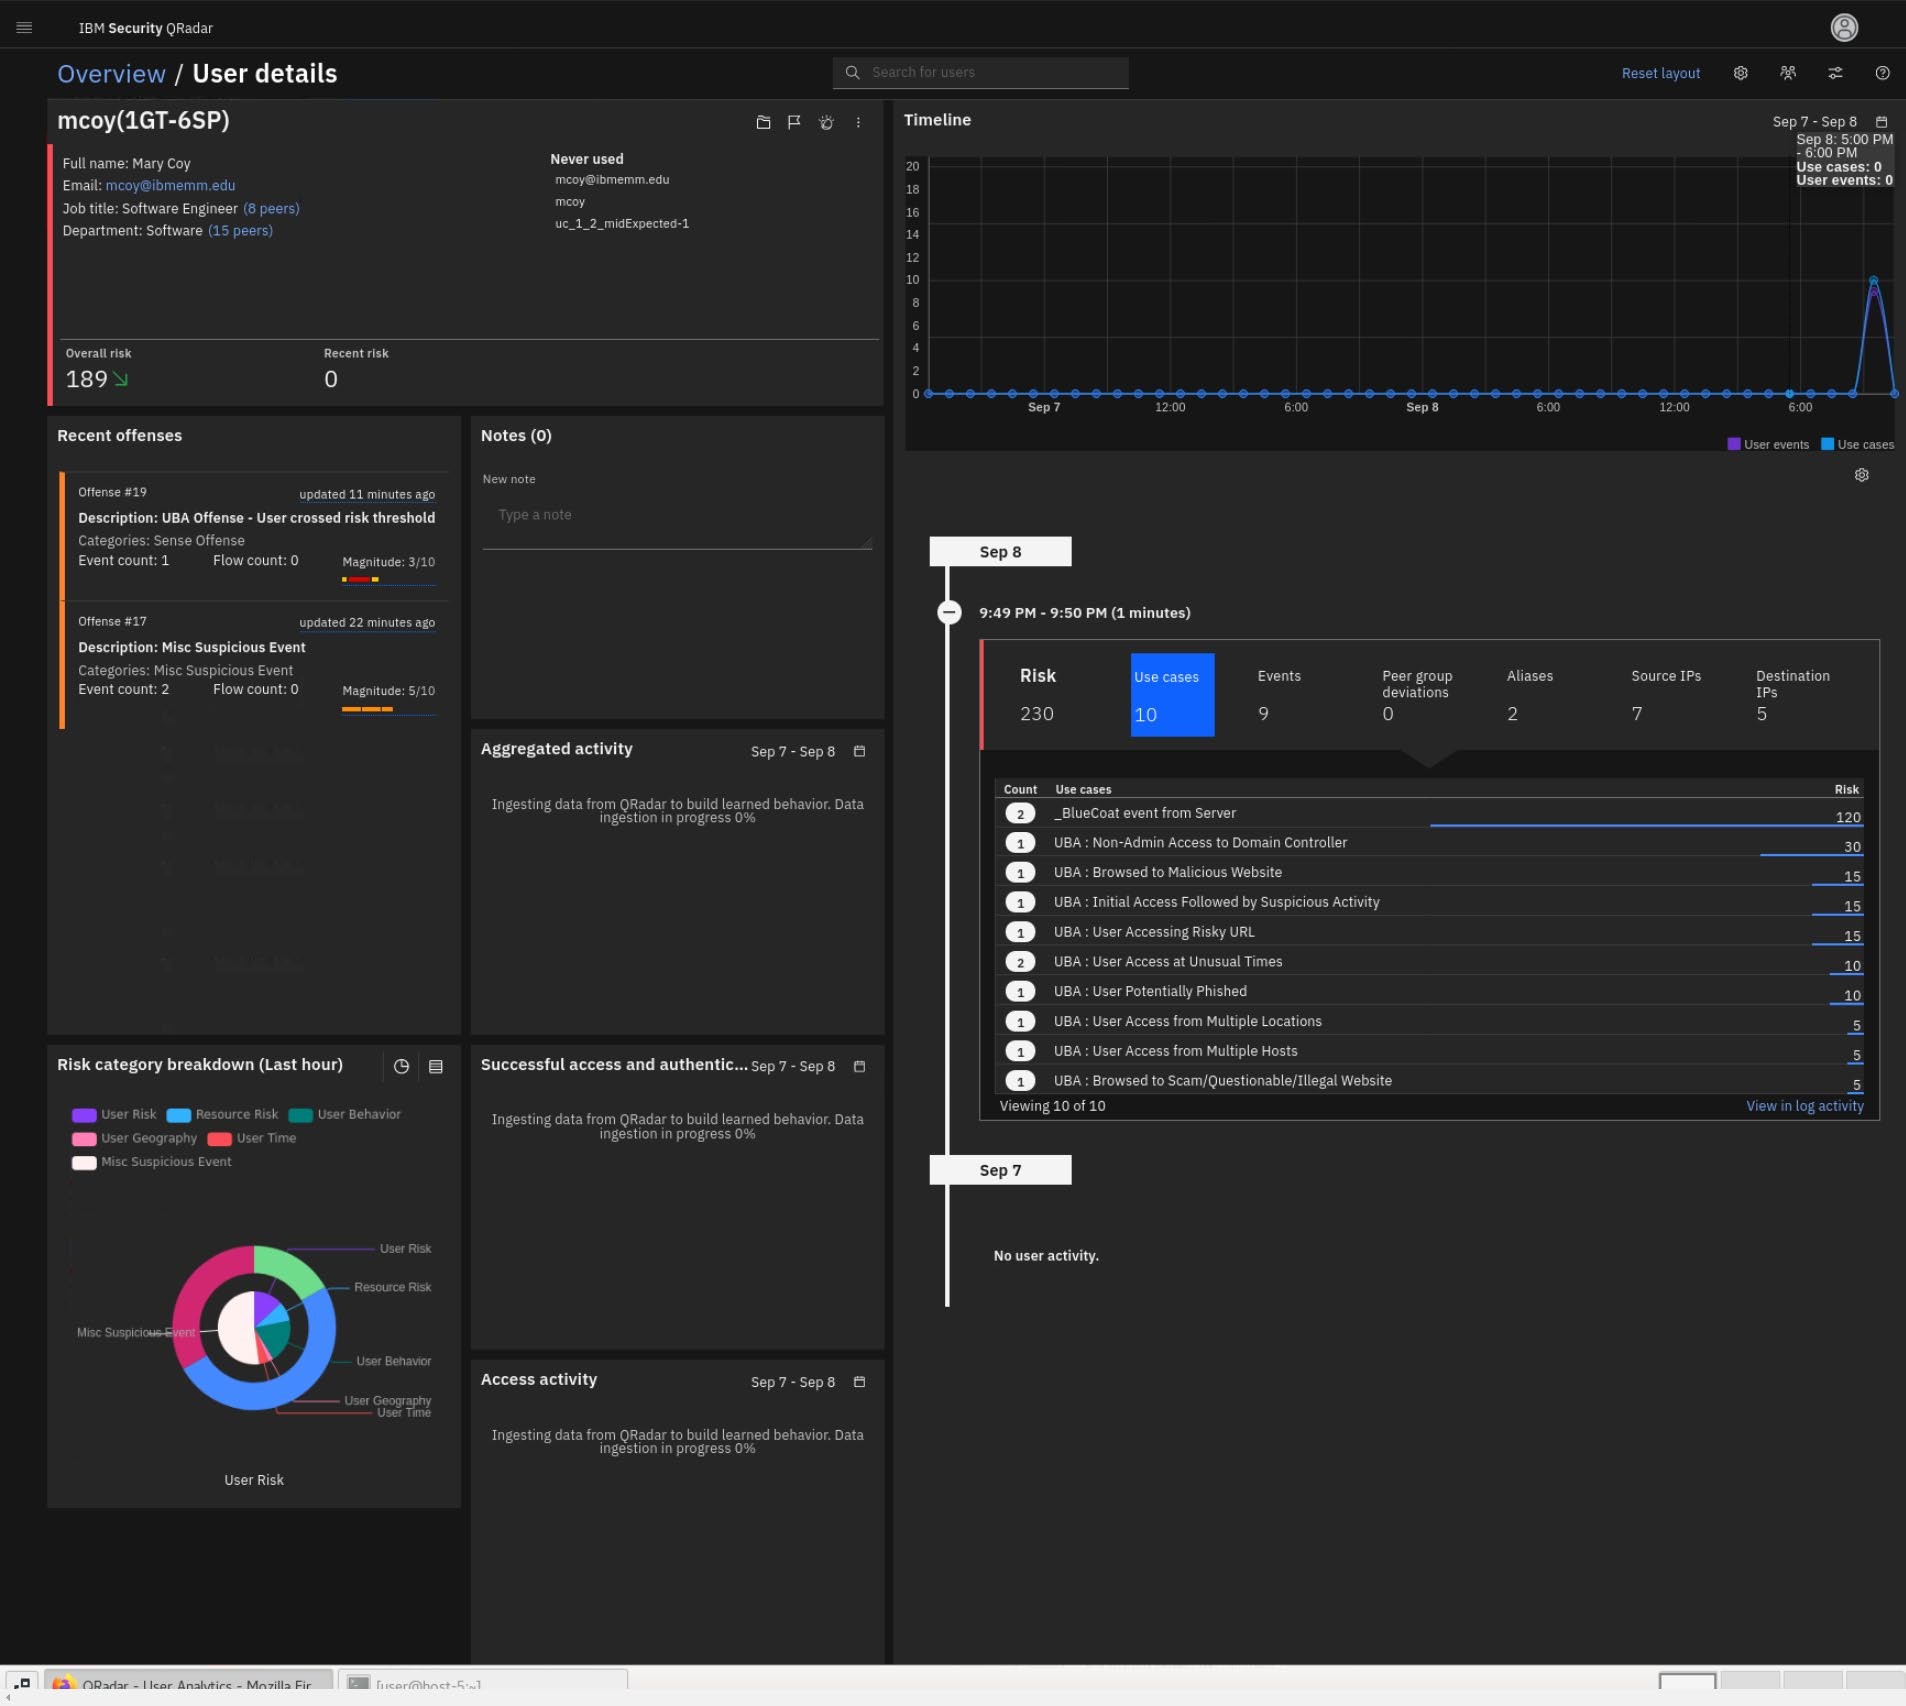
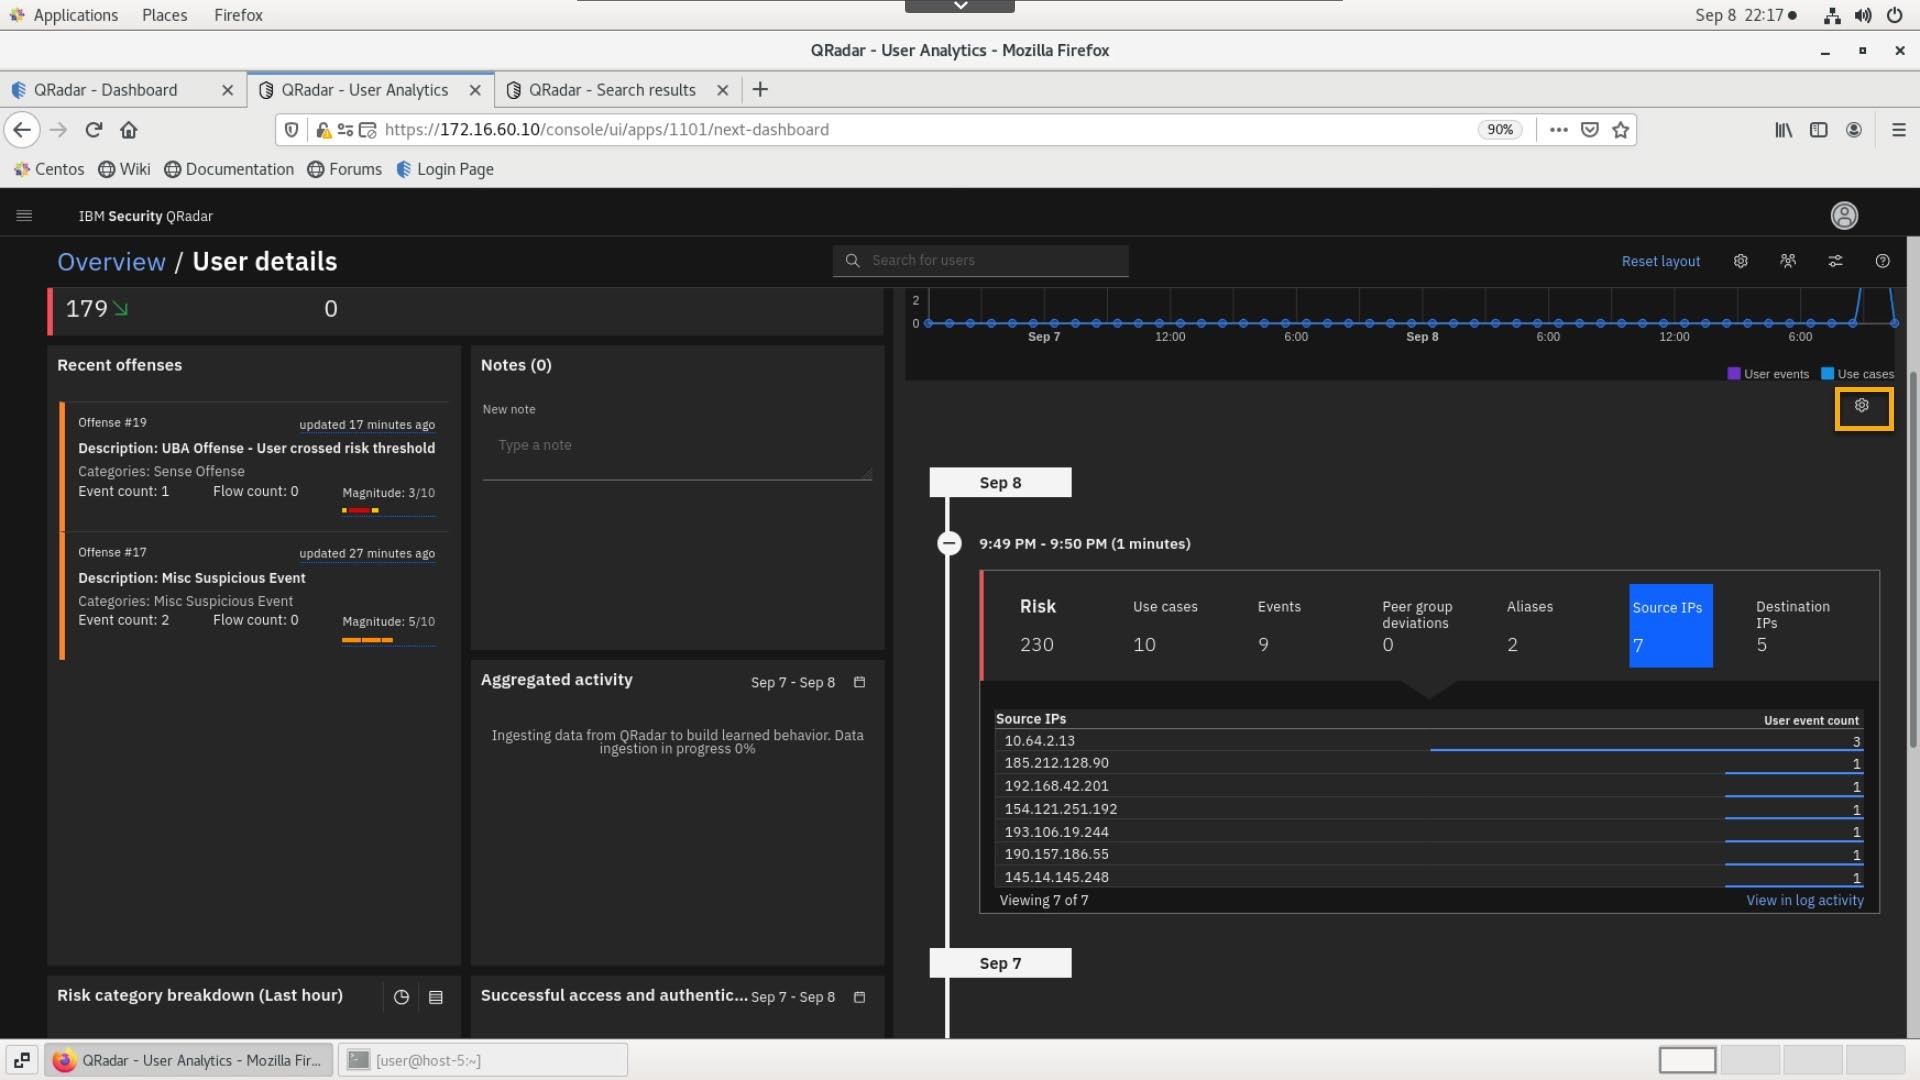
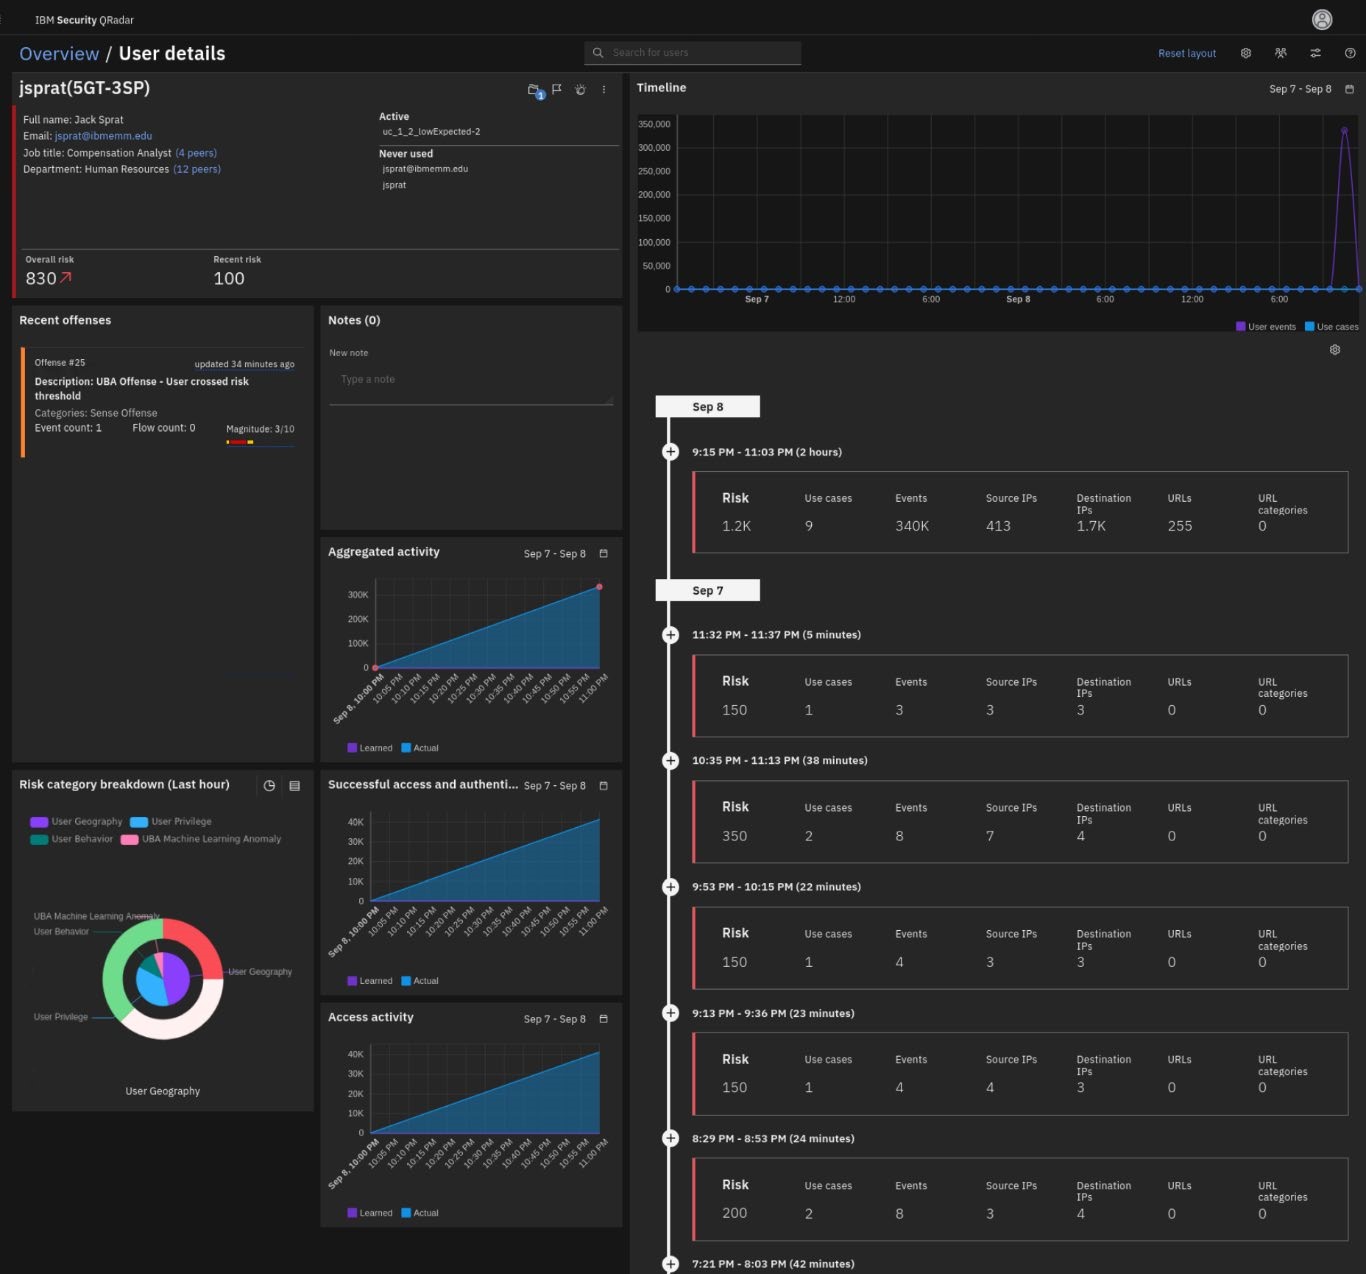
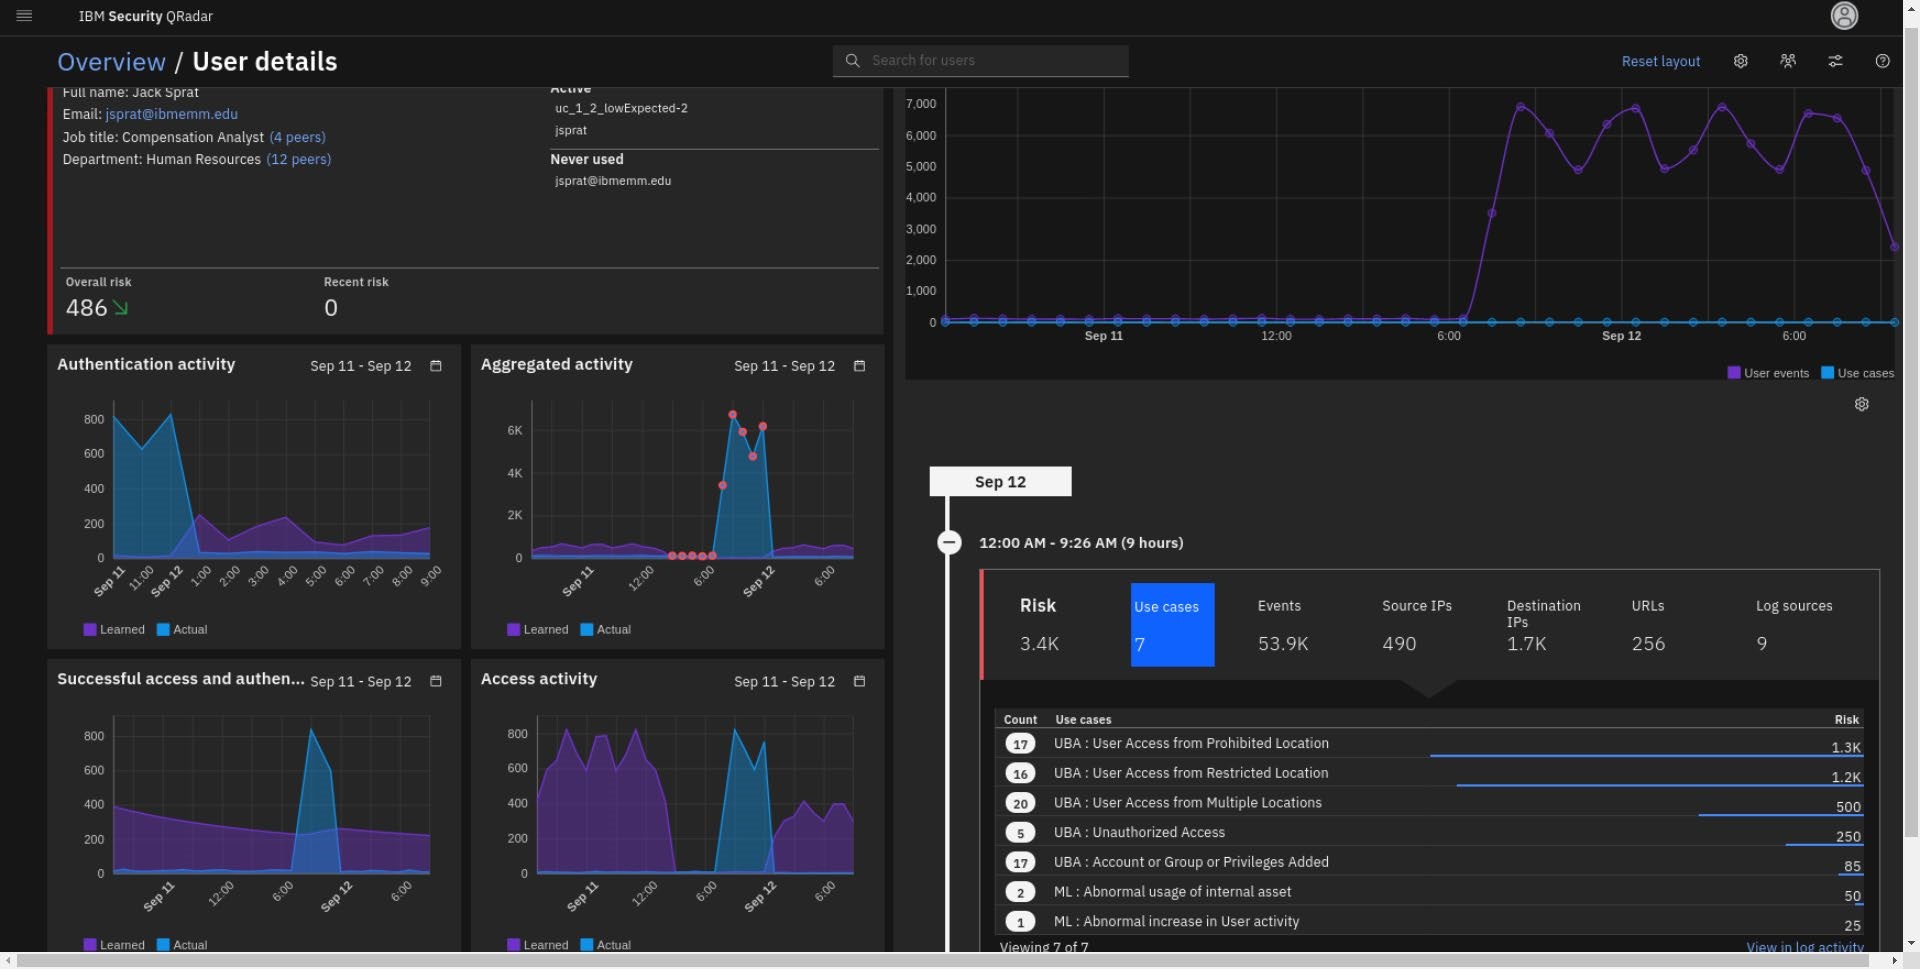
- From the User Details dashboard, note the following:
-
The Timeline presents the user total events including the risky events.
-
Note the recent offenses. One indicates that user went over the risk score that you have setup. The other one address risky behavior identified in the rule you have created (this will be addressed more in the investigation later).
Note: Sometimes takes a bit time for QRadar engine to load offenses into the UBA dashboard. If so, wait a few minutes and refresh your browser.
-
In the Risk category breakdown graph, you can observe what types of risky behavior this user practices including the behavior category generated by the rule you have created Misc Suspicious Event.
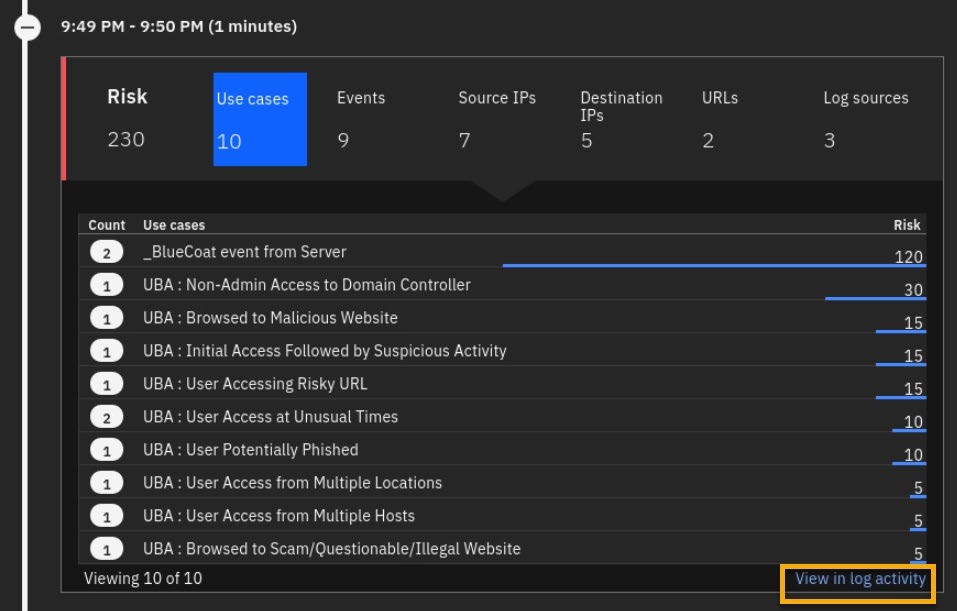
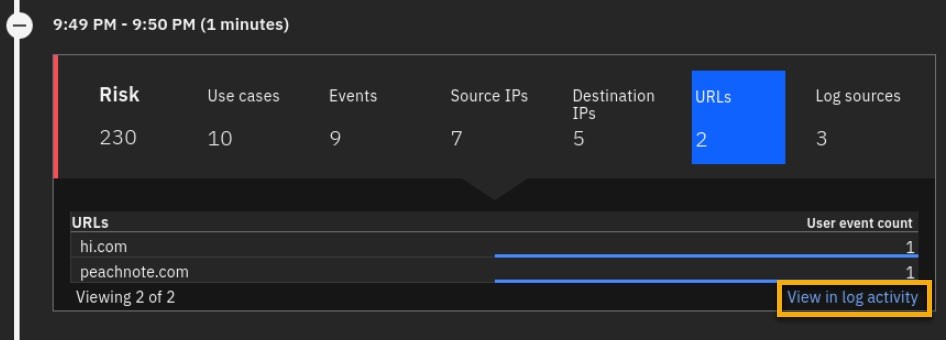
- On the right side of the dashboard, open the latest risk score, 230 per screen capture (your score might be a bit different depends on the UBA activity/rules that has been detected) and note the following:
-
_BlueCoat event from Server contributed the highest number of points to the risk score. The score is high because you created a rule with senseValue=60 earlier in this lab.
-
Non-Admin Access to Domain Controller is in second place for the use case risk. However, remember that the senseValue has been updated to 30 points.
-
The other events that you have not modified (they have default settings) are also triggered such as:
-
Access to malicious and illegal site, risky URL, potentially phished account alert and user account is used from multiple hosts and Geo location.
With this information you might conclude that this user account has accessed a malicious site, has become compromised, the account is stolen and used by bad actor(s) across the world.
Note: Unusual time probably will not trigger as you are taking the lab in the regular day time/work time.
-
Observe some other statistics on the risk associated with this user are: two aliases, 9 risky evens that triggered 6-8 UBA use cases with 7 source and 4 destination IPs involved.
-
Click some other metric category, for example, the Events category. Note the name and number of the events that are contributing to this risky behavior score.
-
Click the config icon to review other metrics categories that can be displayed in this widget.
- To understand what malicious site the user has access let's replace Aliases and Source IP metrics with add URLs and URL Categories
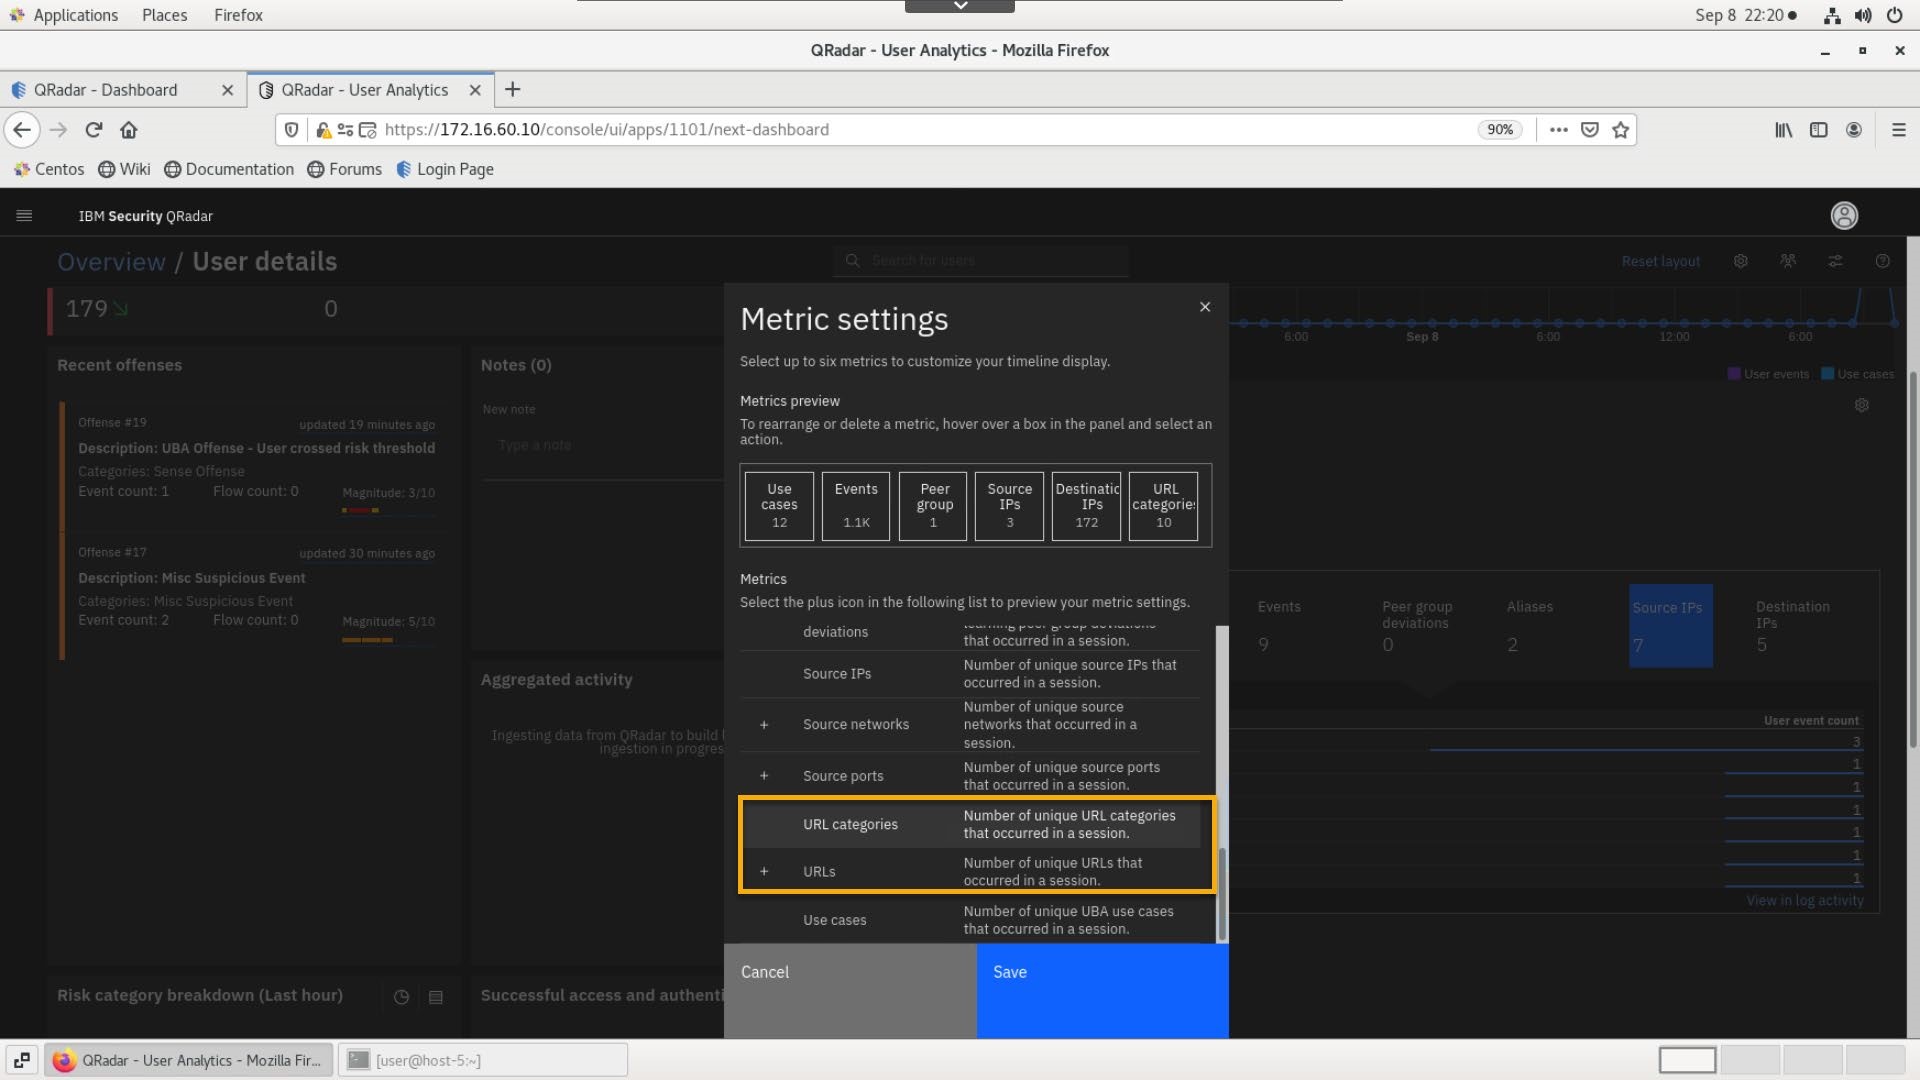
-
In the Metric Settings window, click Save.
-
Click the URLs metric and note the two websites that mcoy has visited.
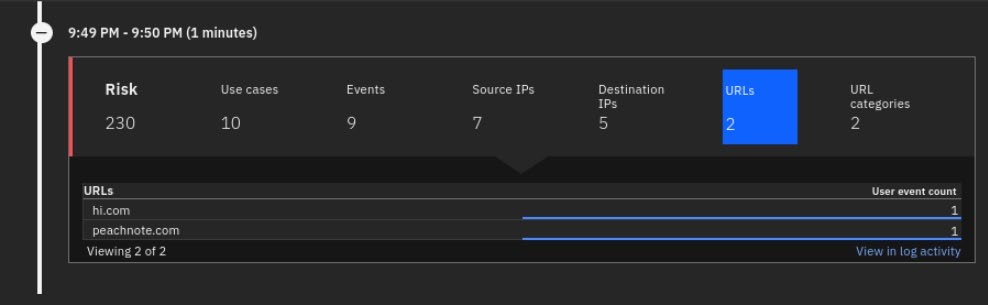
- Review the peachnote.com site in the X-Force Exchange.
[https://exchange.xforce.ibmcloud.com/url/peachnote.com]
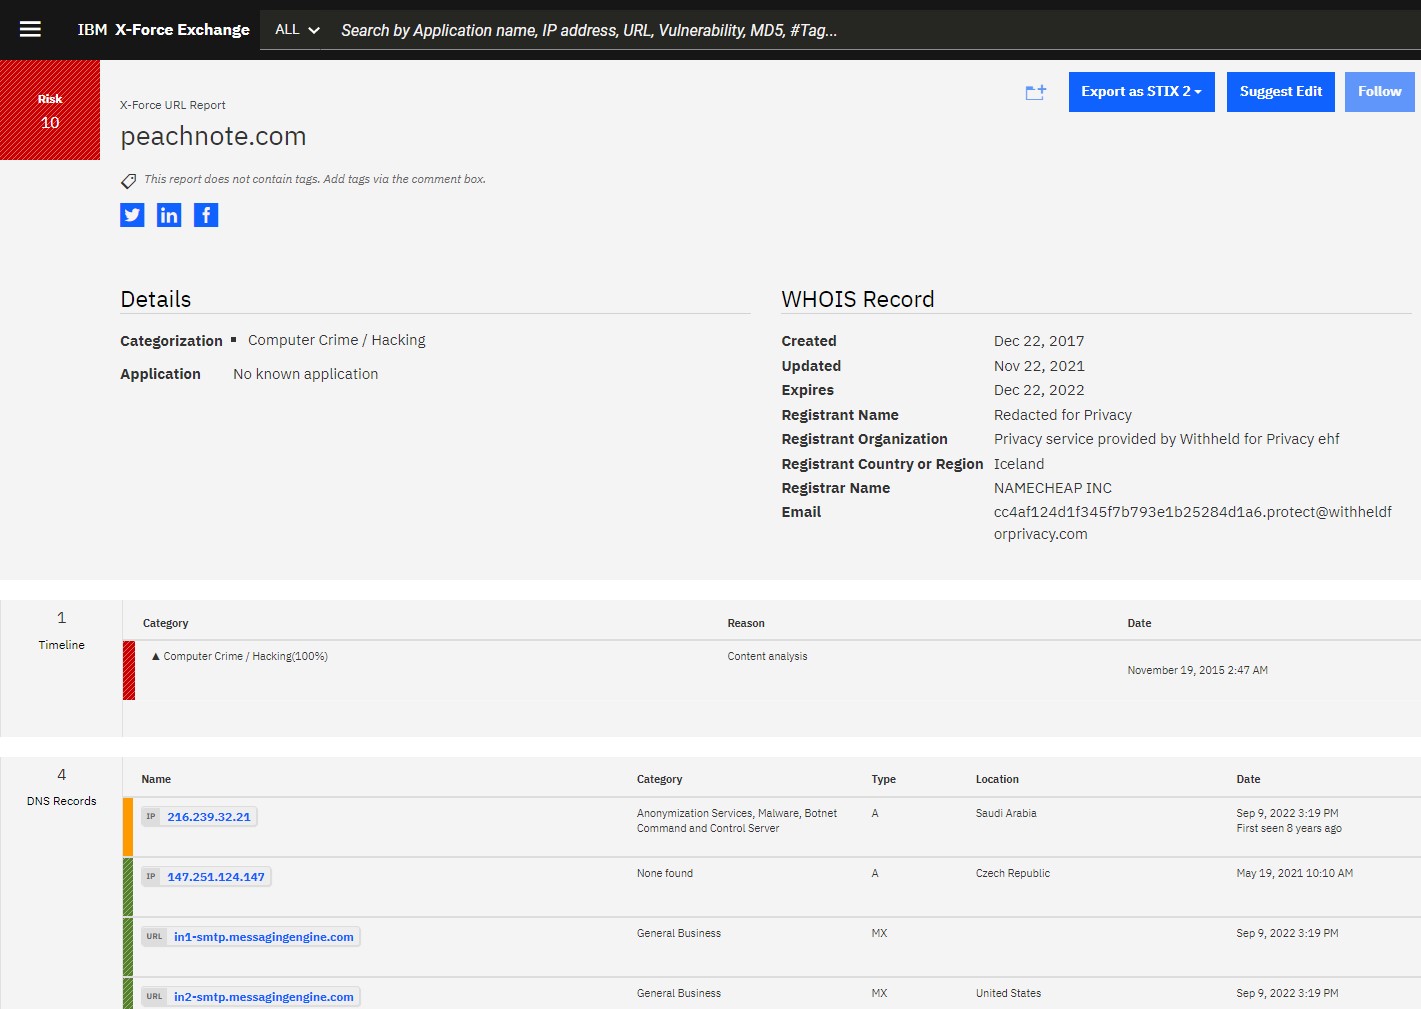
Note: Early in 2023, X-Force has reclassified the site. The screen shot shows previously when X-Force had flagged the site as malicious which explains why some other UBA events/rules are triggered.
- Click the Destination IPs metric.
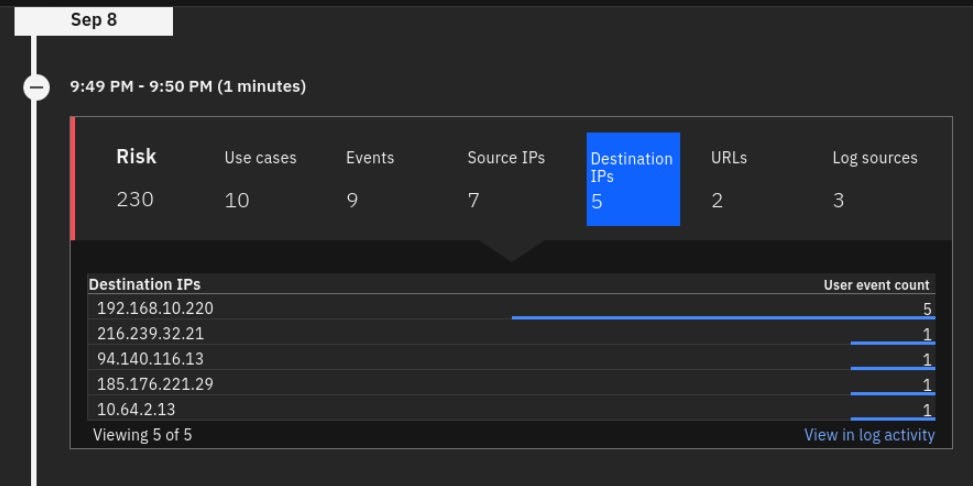
Note that IP address from the previous XFE report is also detected and associated with this user activity.
Optionally, modify metrics to review what log sources detected this user activity.
Advanced User Investigation Methods
In this part, let's explore some advanced techniques of user investigation with the UBA app.
Expand on mcoy investigation
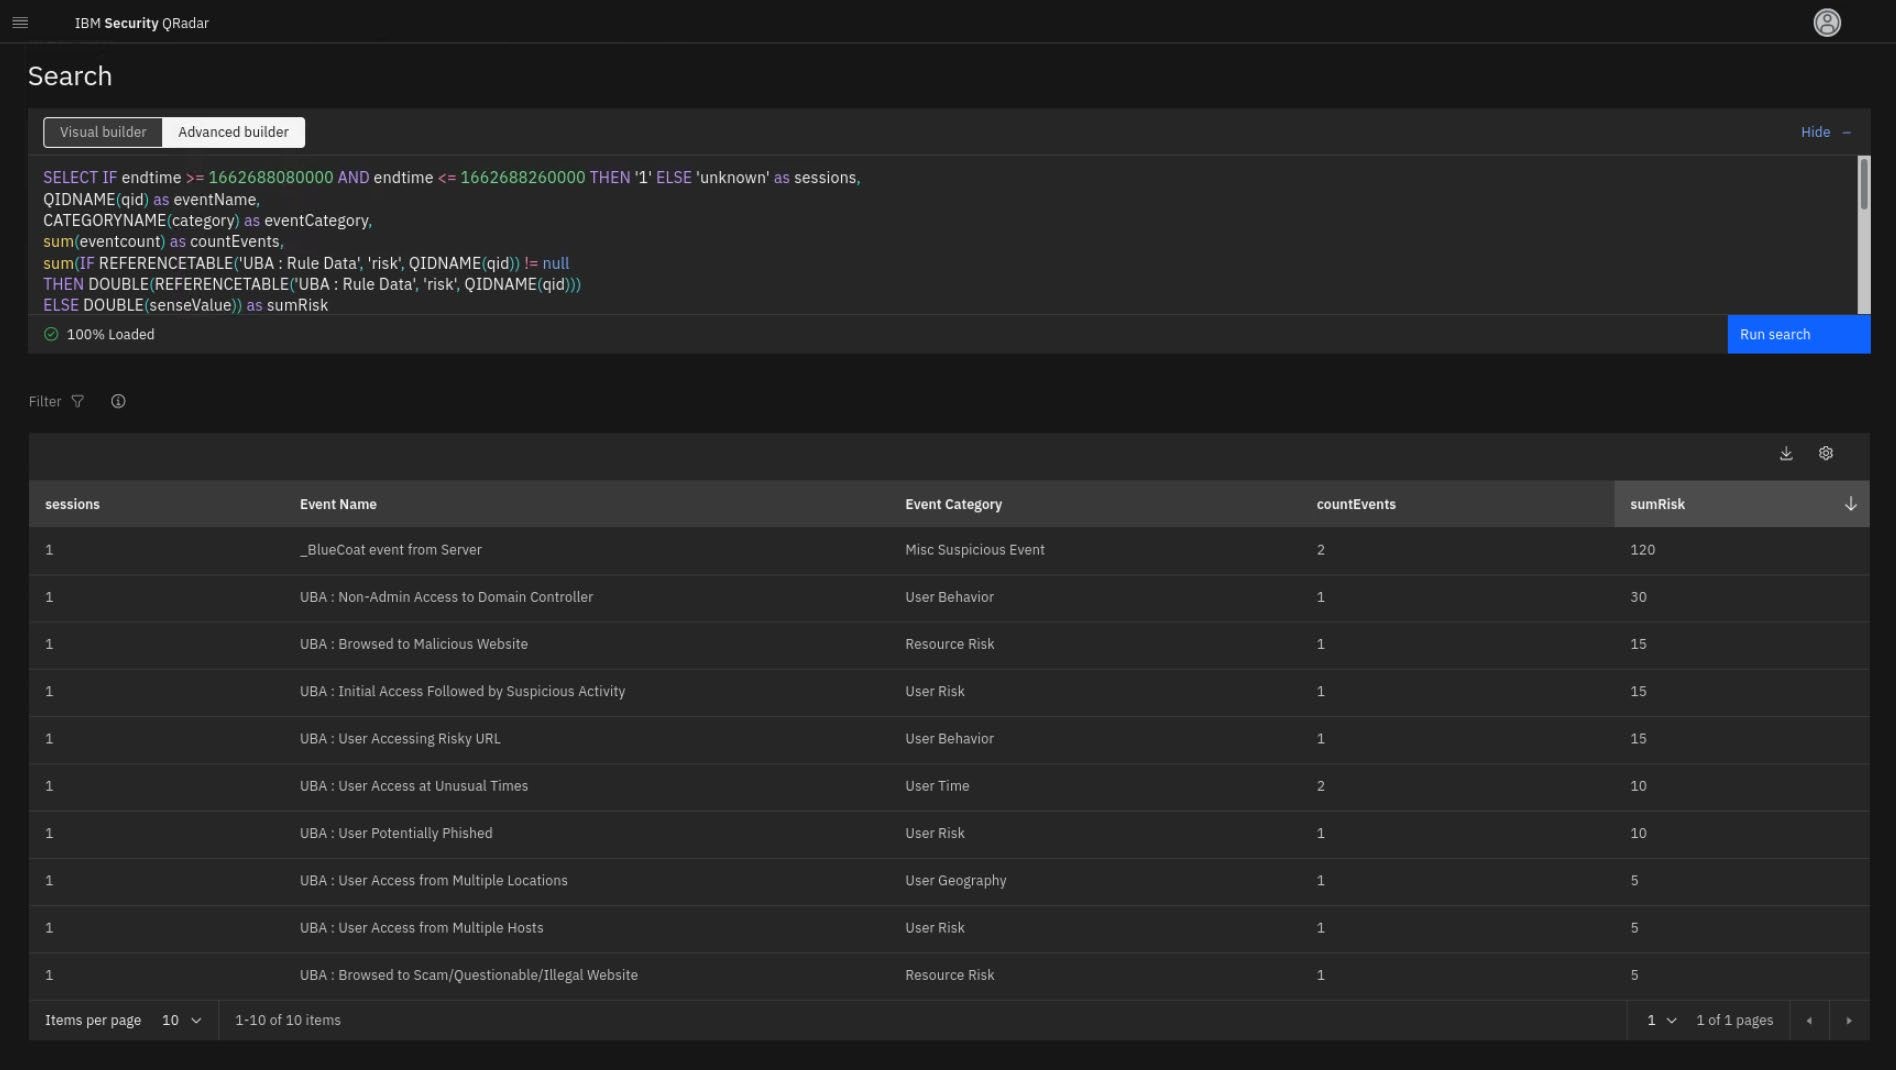
- Again, expand the timeline with a 230 risk score (or whatever score you have) and click View in log activity.
- The new browser tab opens with an AQL search, which is used to generate the timeline for the Use Cases table.
Review the AQL query. Note that a similar query helps build the Risk category breakdown graph. Remember that you can modify the AQL to expand your search on user behavior (which is demonstrated later).
-
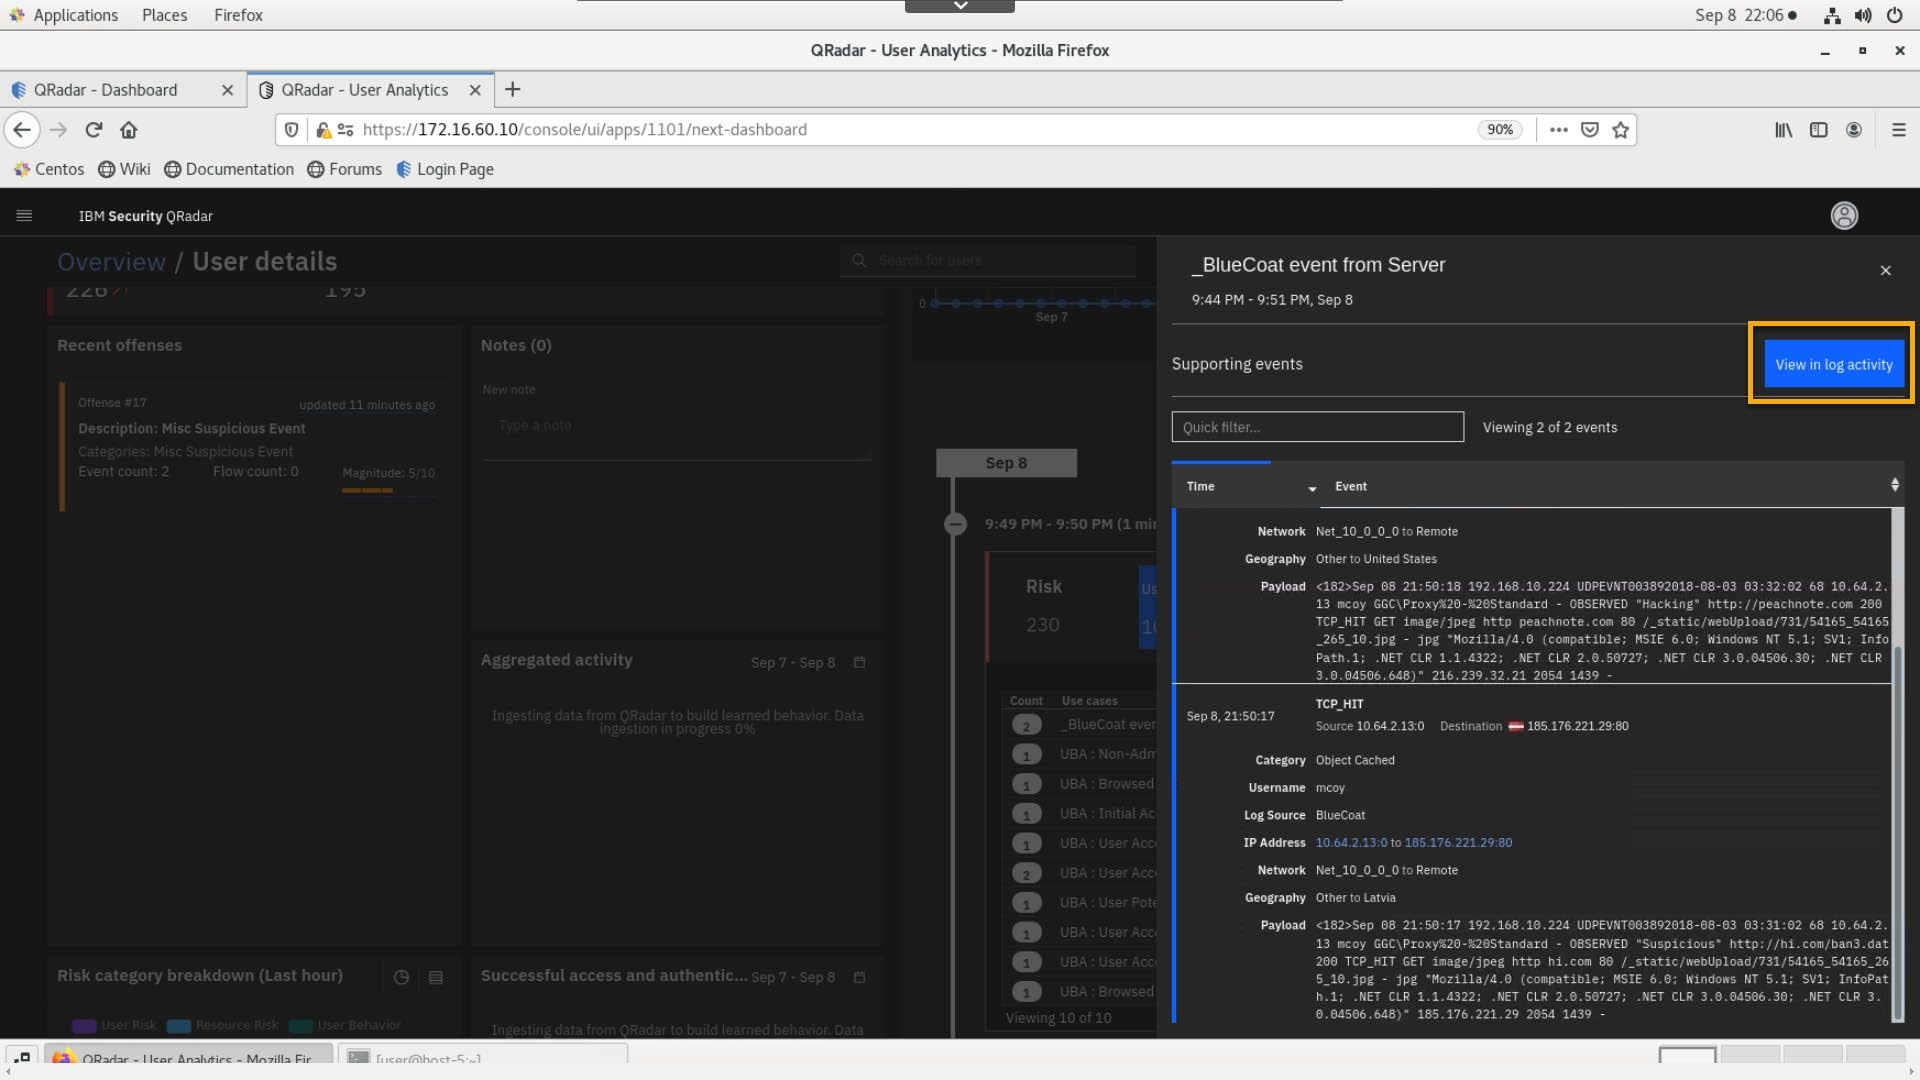
Close the search tab and go back to the Timeline > Use cases table and click the _BlueCoat event from Server use case.
-
Expand two events and analyze the payloads.
-
Then, click View in log activity.
-
Review the AQL query and the data in the results table.
-
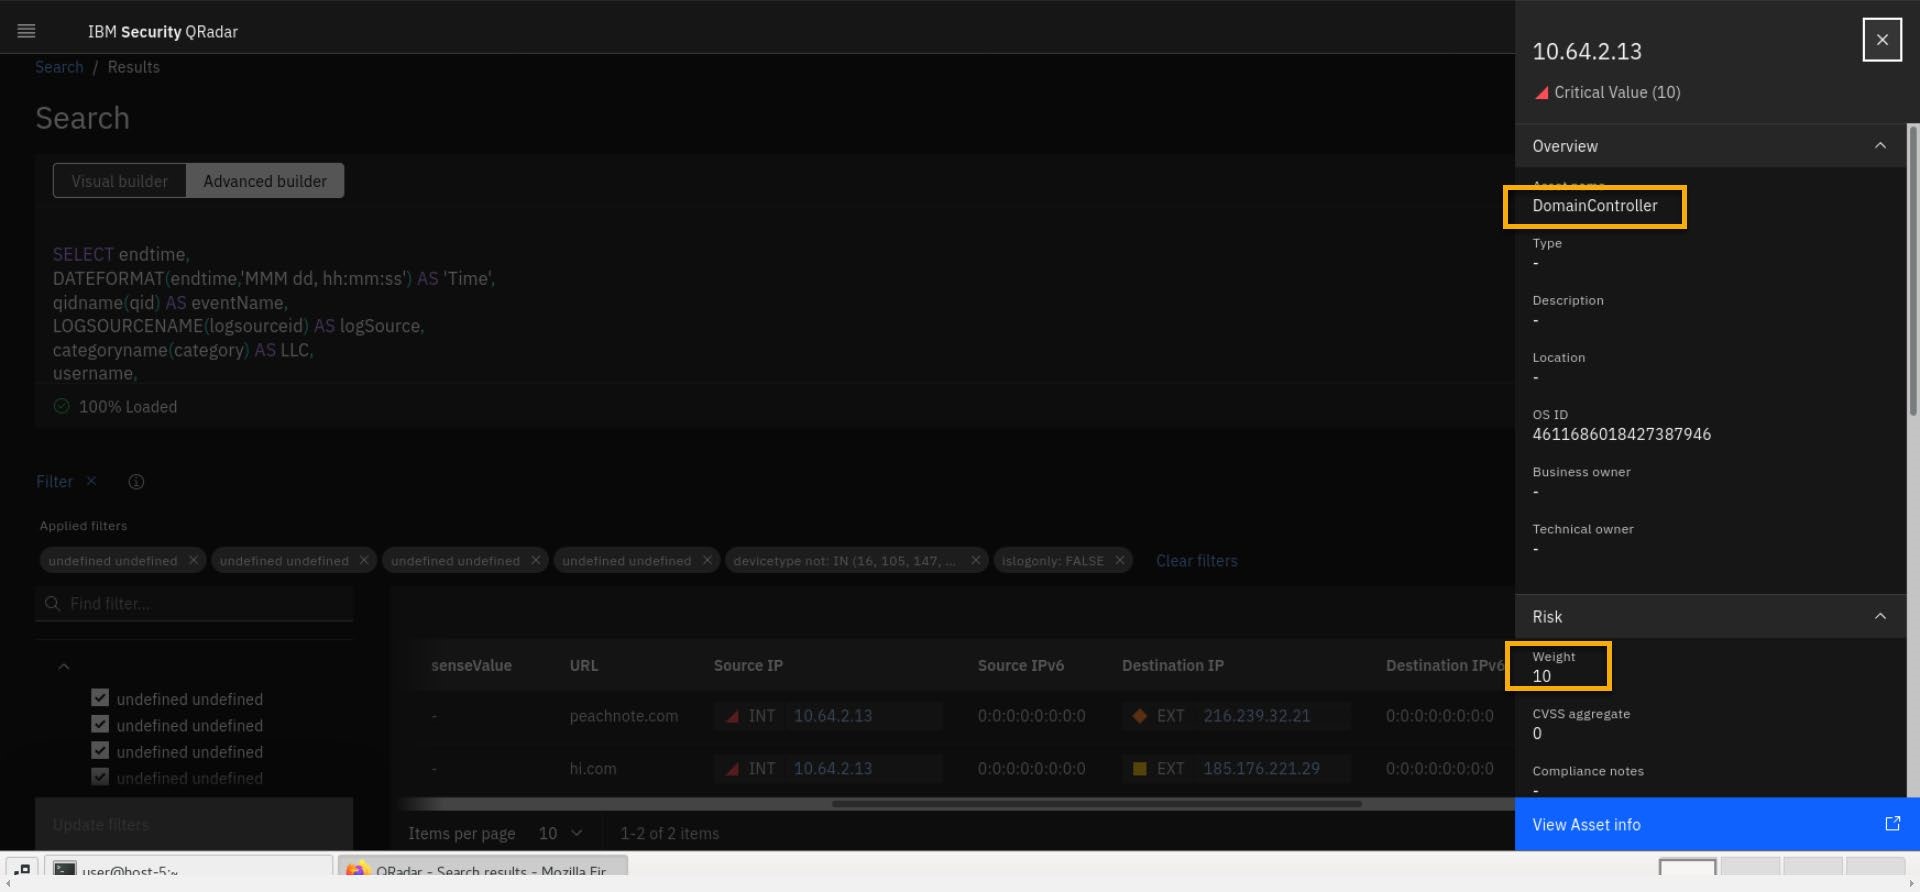
Click internal (INT) IP 10.64.2.13 and note that the internal asset has a weight of ten, and it is labeled as a Domain controller.
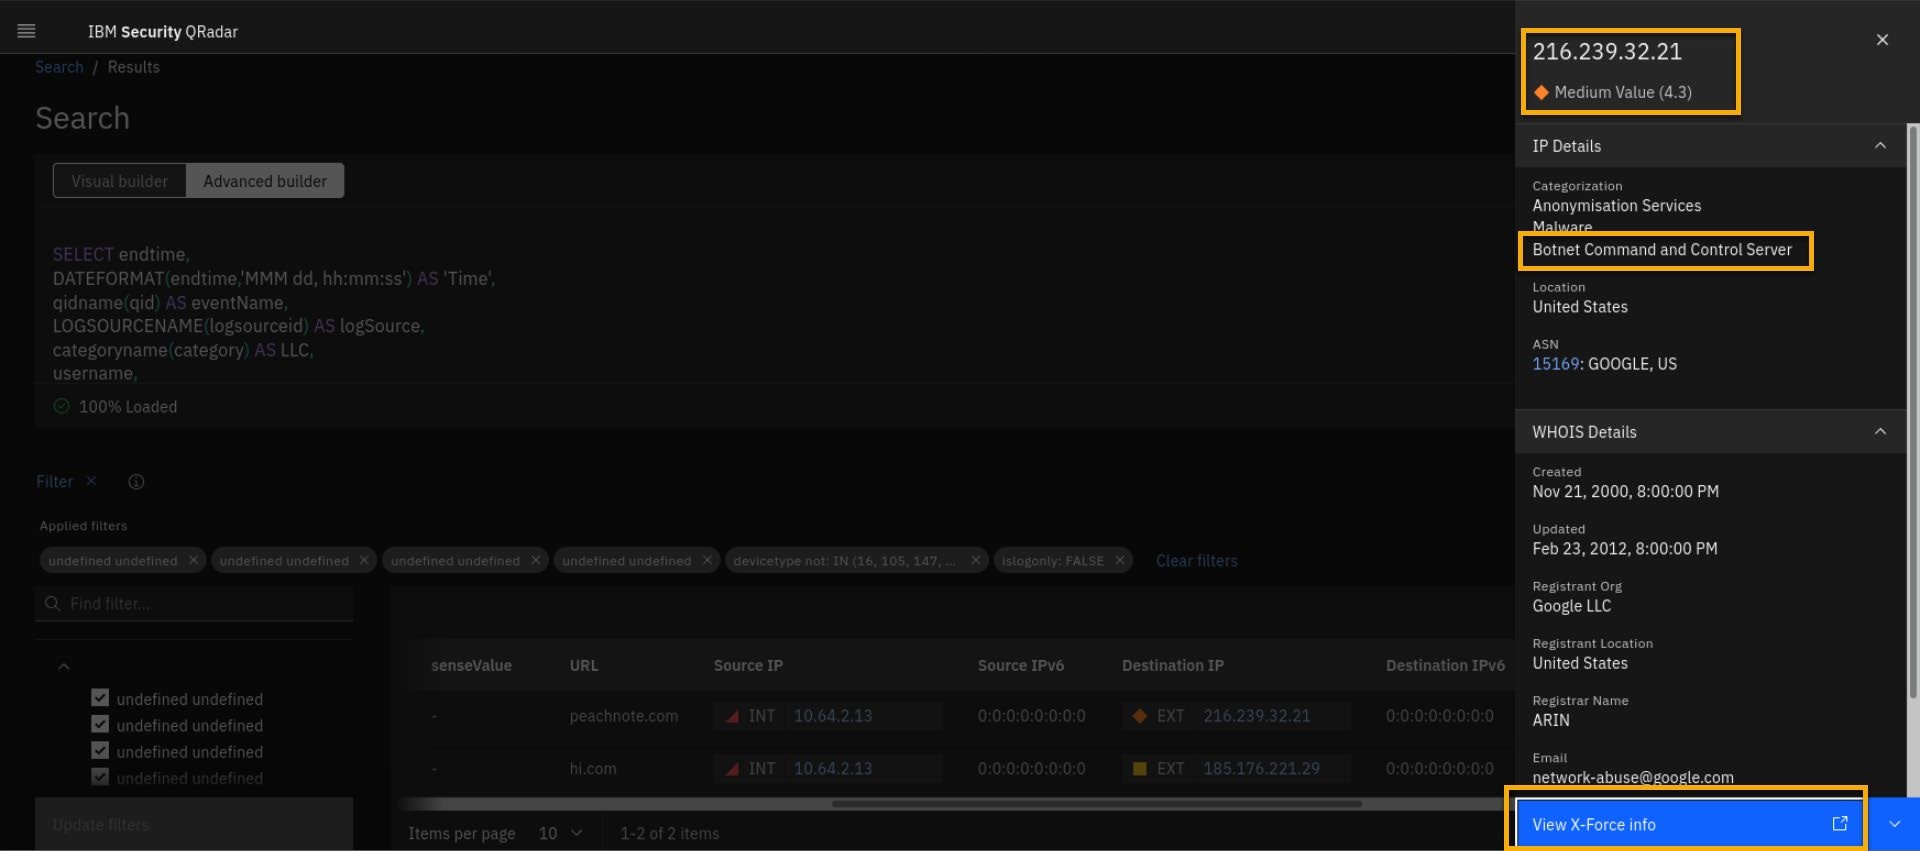
- Select the external IP 216.239.32.21 with a diamond shape and orange color. Note that it has X-Force threat intel risk score set to medium.
Note that from the time that this example incident was created, that the current risk associated with the IP address has reduced. However, you can explore history information on the IP address by going to the X-Force site.
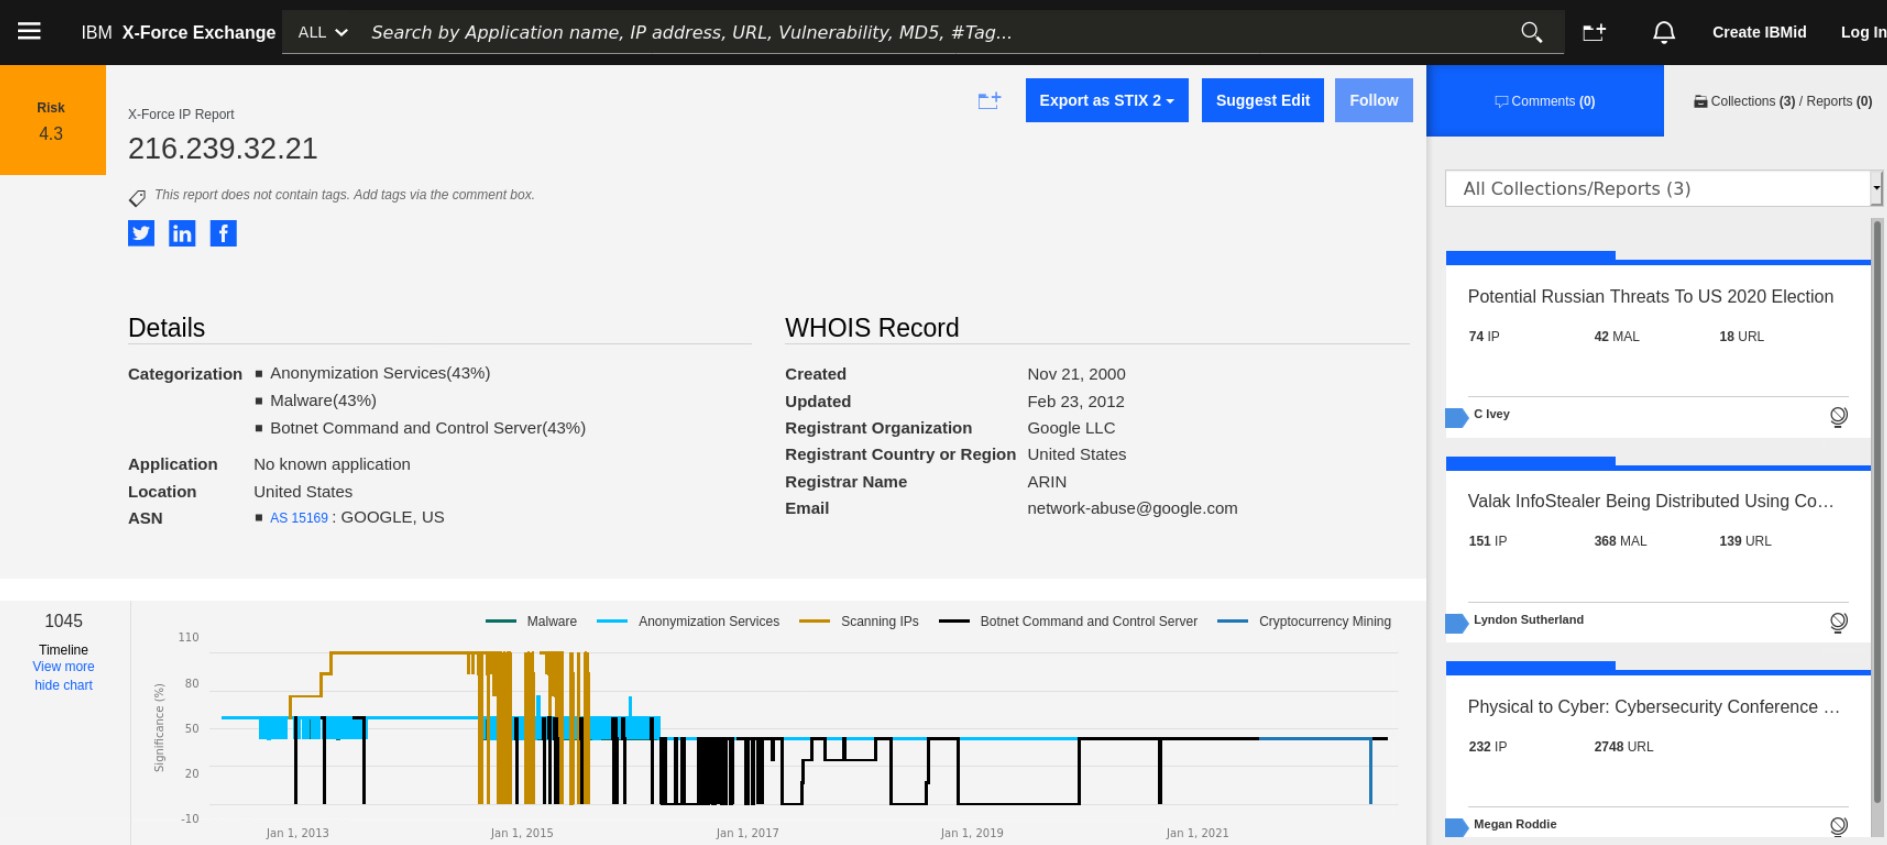
- To get more X-Force intelligence data for that IP, click View X-Force info
- Review the other threat intelligence related to this IP asset. Then close the X-Force Exchange browser tab.
-
Close the AQL search tab too.
-
From the Timeline, select URLs and then View in log activity.
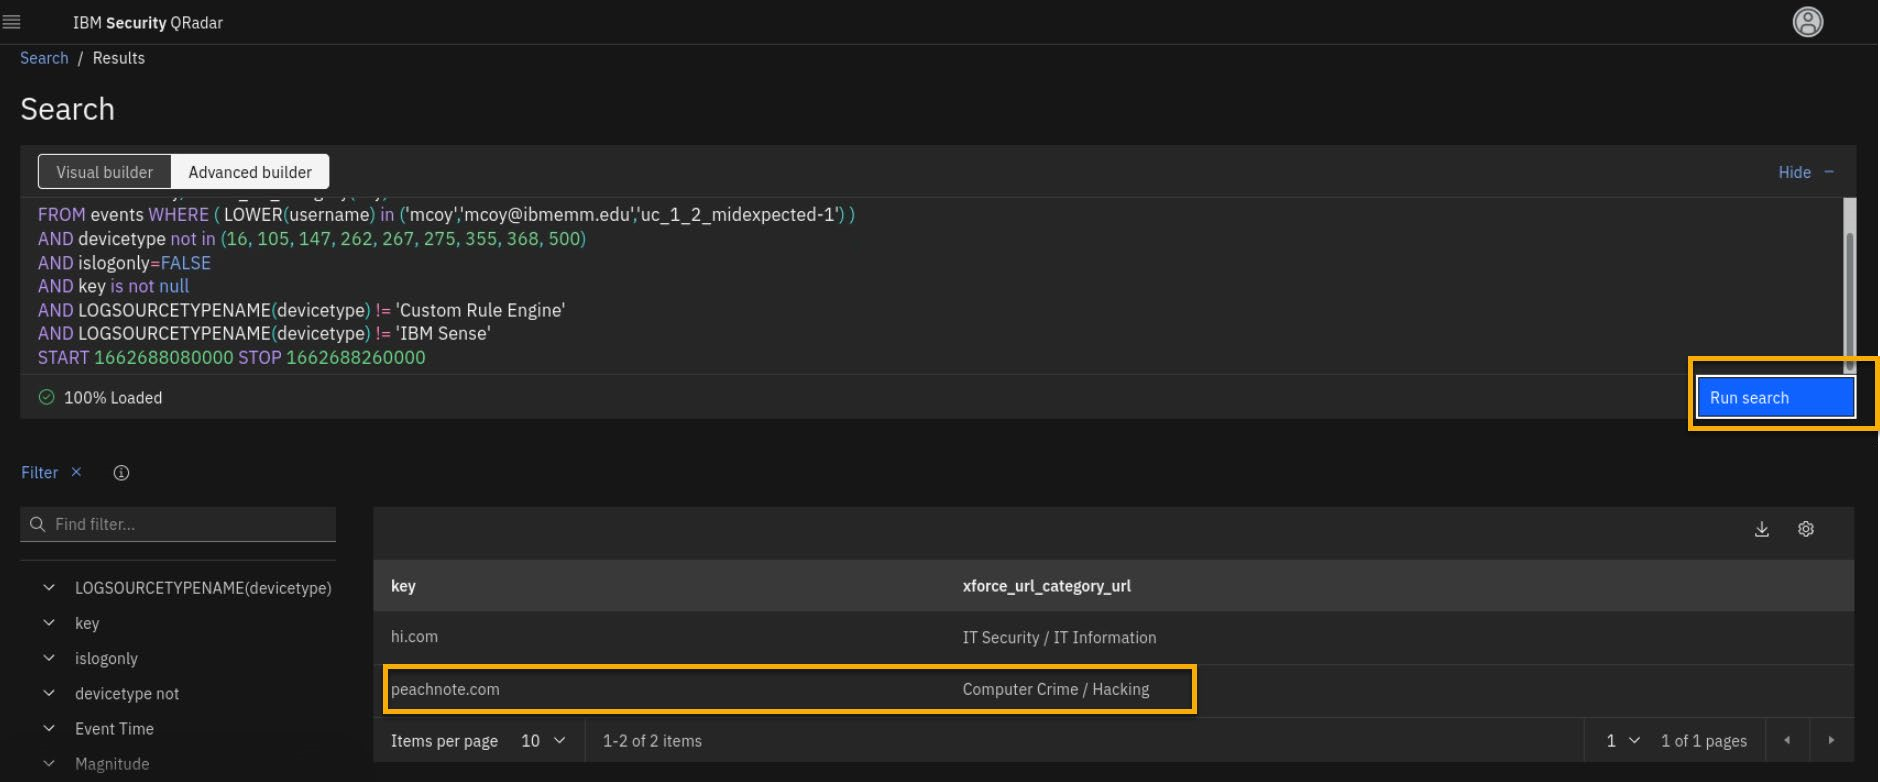
- To check on the X-Force reputation of detected URLs, reformat AQL as follows
SELECT url as key, xforce_url_category(key) FROM events WHERE ( LOWER(username) in ('mcoy','mcoy@ibmemm.edu','uc_1_2_midexpected-1') ) AND devicetype not in (16, 105, 147, 262, 267, 275, 355, 368, 500) AND islogonly=FALSE AND key is not null AND LOGSOURCETYPENAME(devicetype) != 'Custom Rule Engine' AND LOGSOURCETYPENAME(devicetype) != 'IBM Sense' START 1686628740000 STOP 1686628920000text
Keep the default Start and Stop time values in the AQL query. Do not modify them.
- Click Run search and observe the results.
- Although you are deep in the investigation, you want to alert another UBA analyst that you are analyzing this user activity.
Thus, click the "flag" to start the investigation.
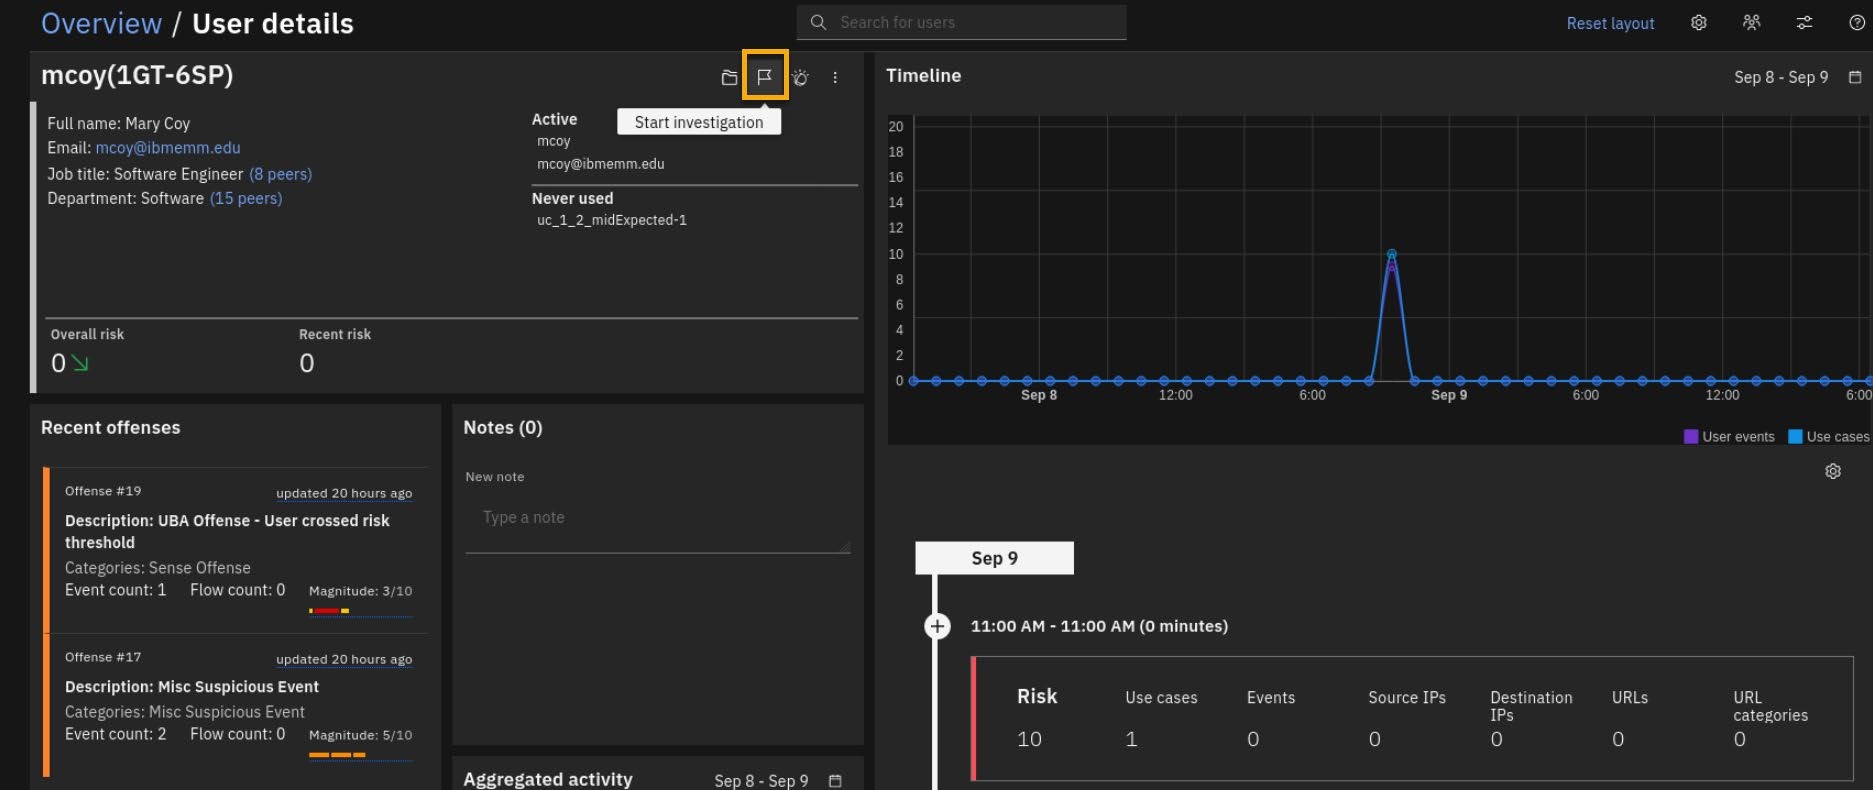
- Click the UBA dashboard overview and note that a new widget is created named Active Investigations with the mcoy user added to it.
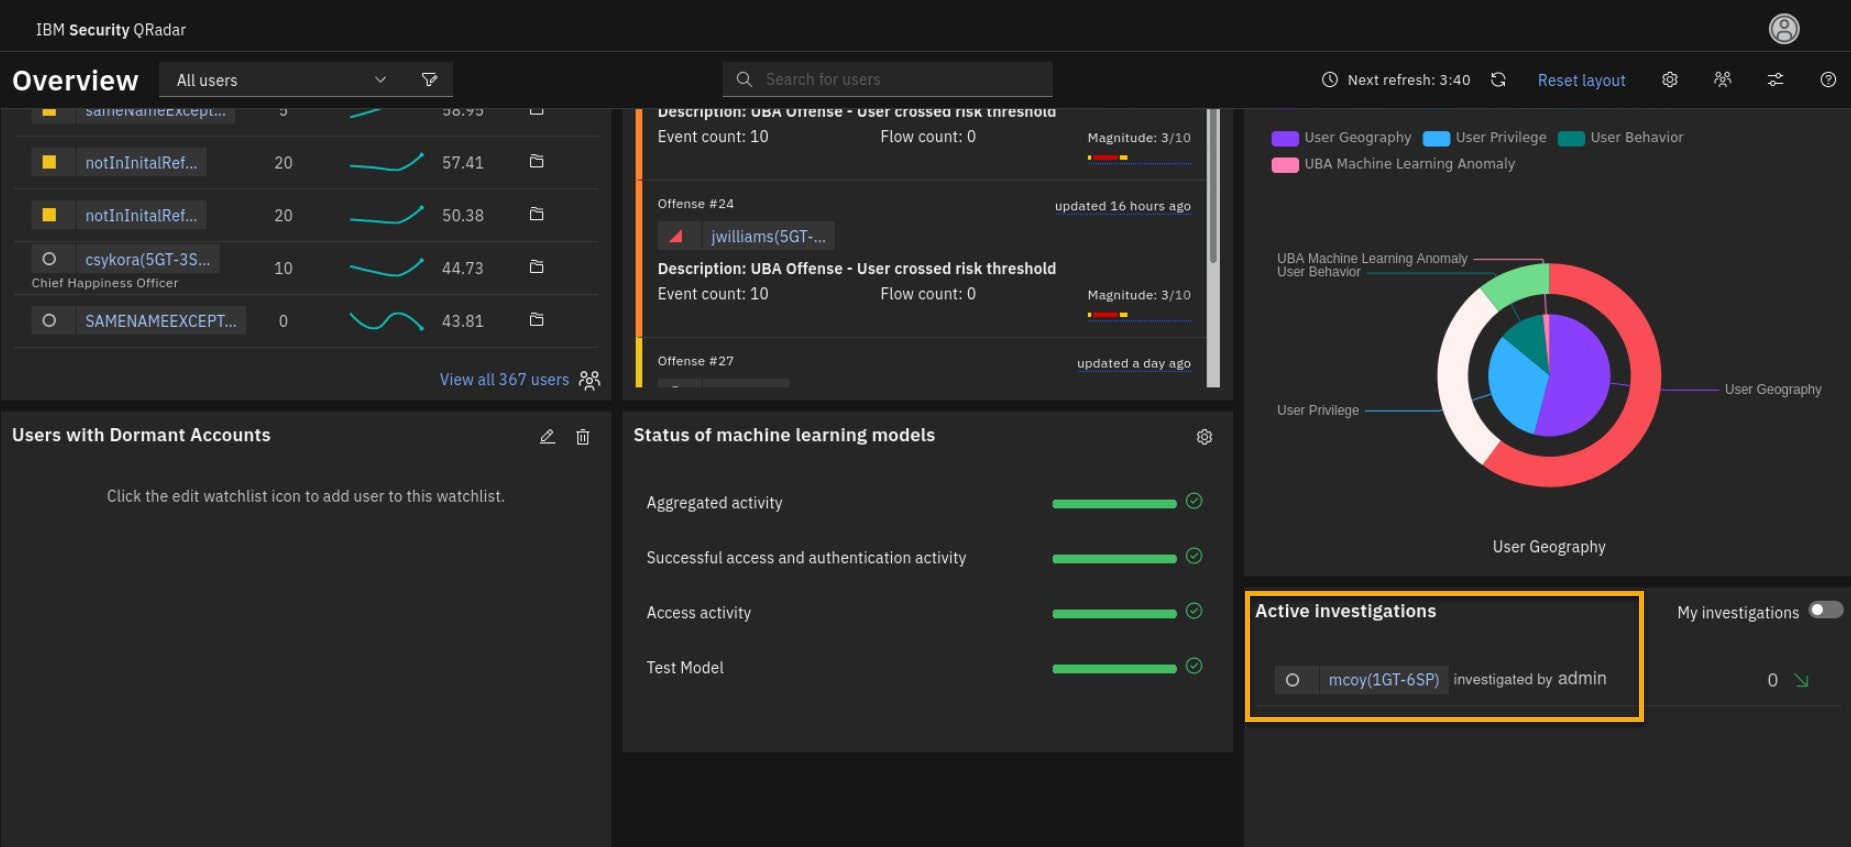
-
Finally, you can check what IP addresses have been accessed through your VPN Gateway. From the user overview timeline (note you can re-open this by clicking on the user name in the Active Investigations widget) select Log Sources.
-
Then click View in log activity.
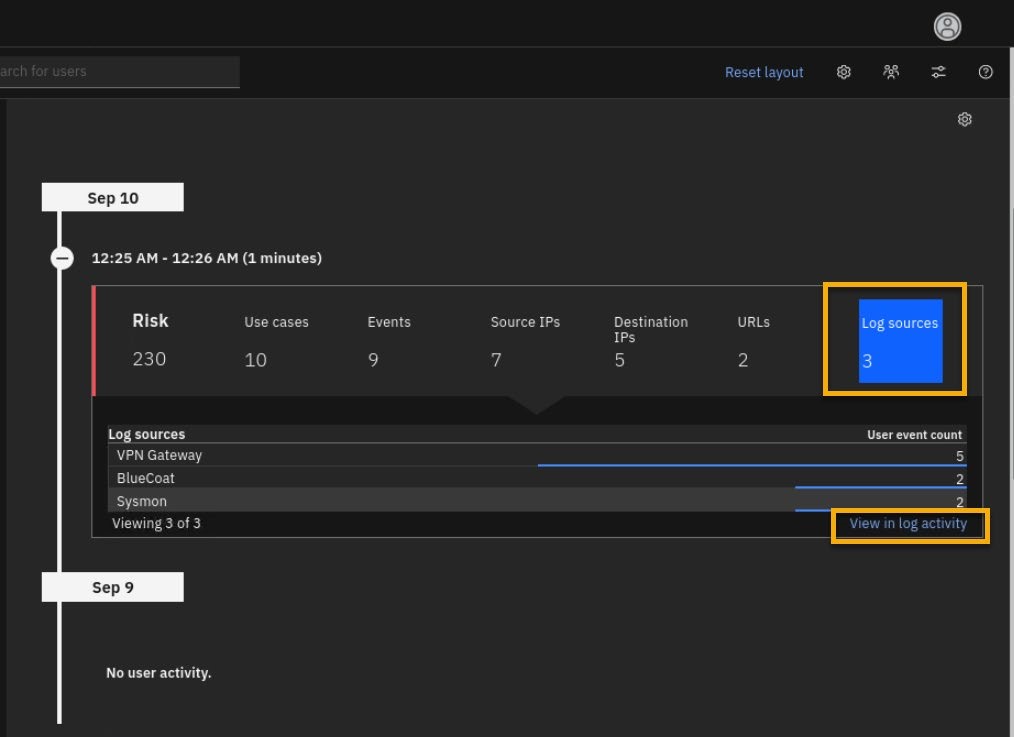
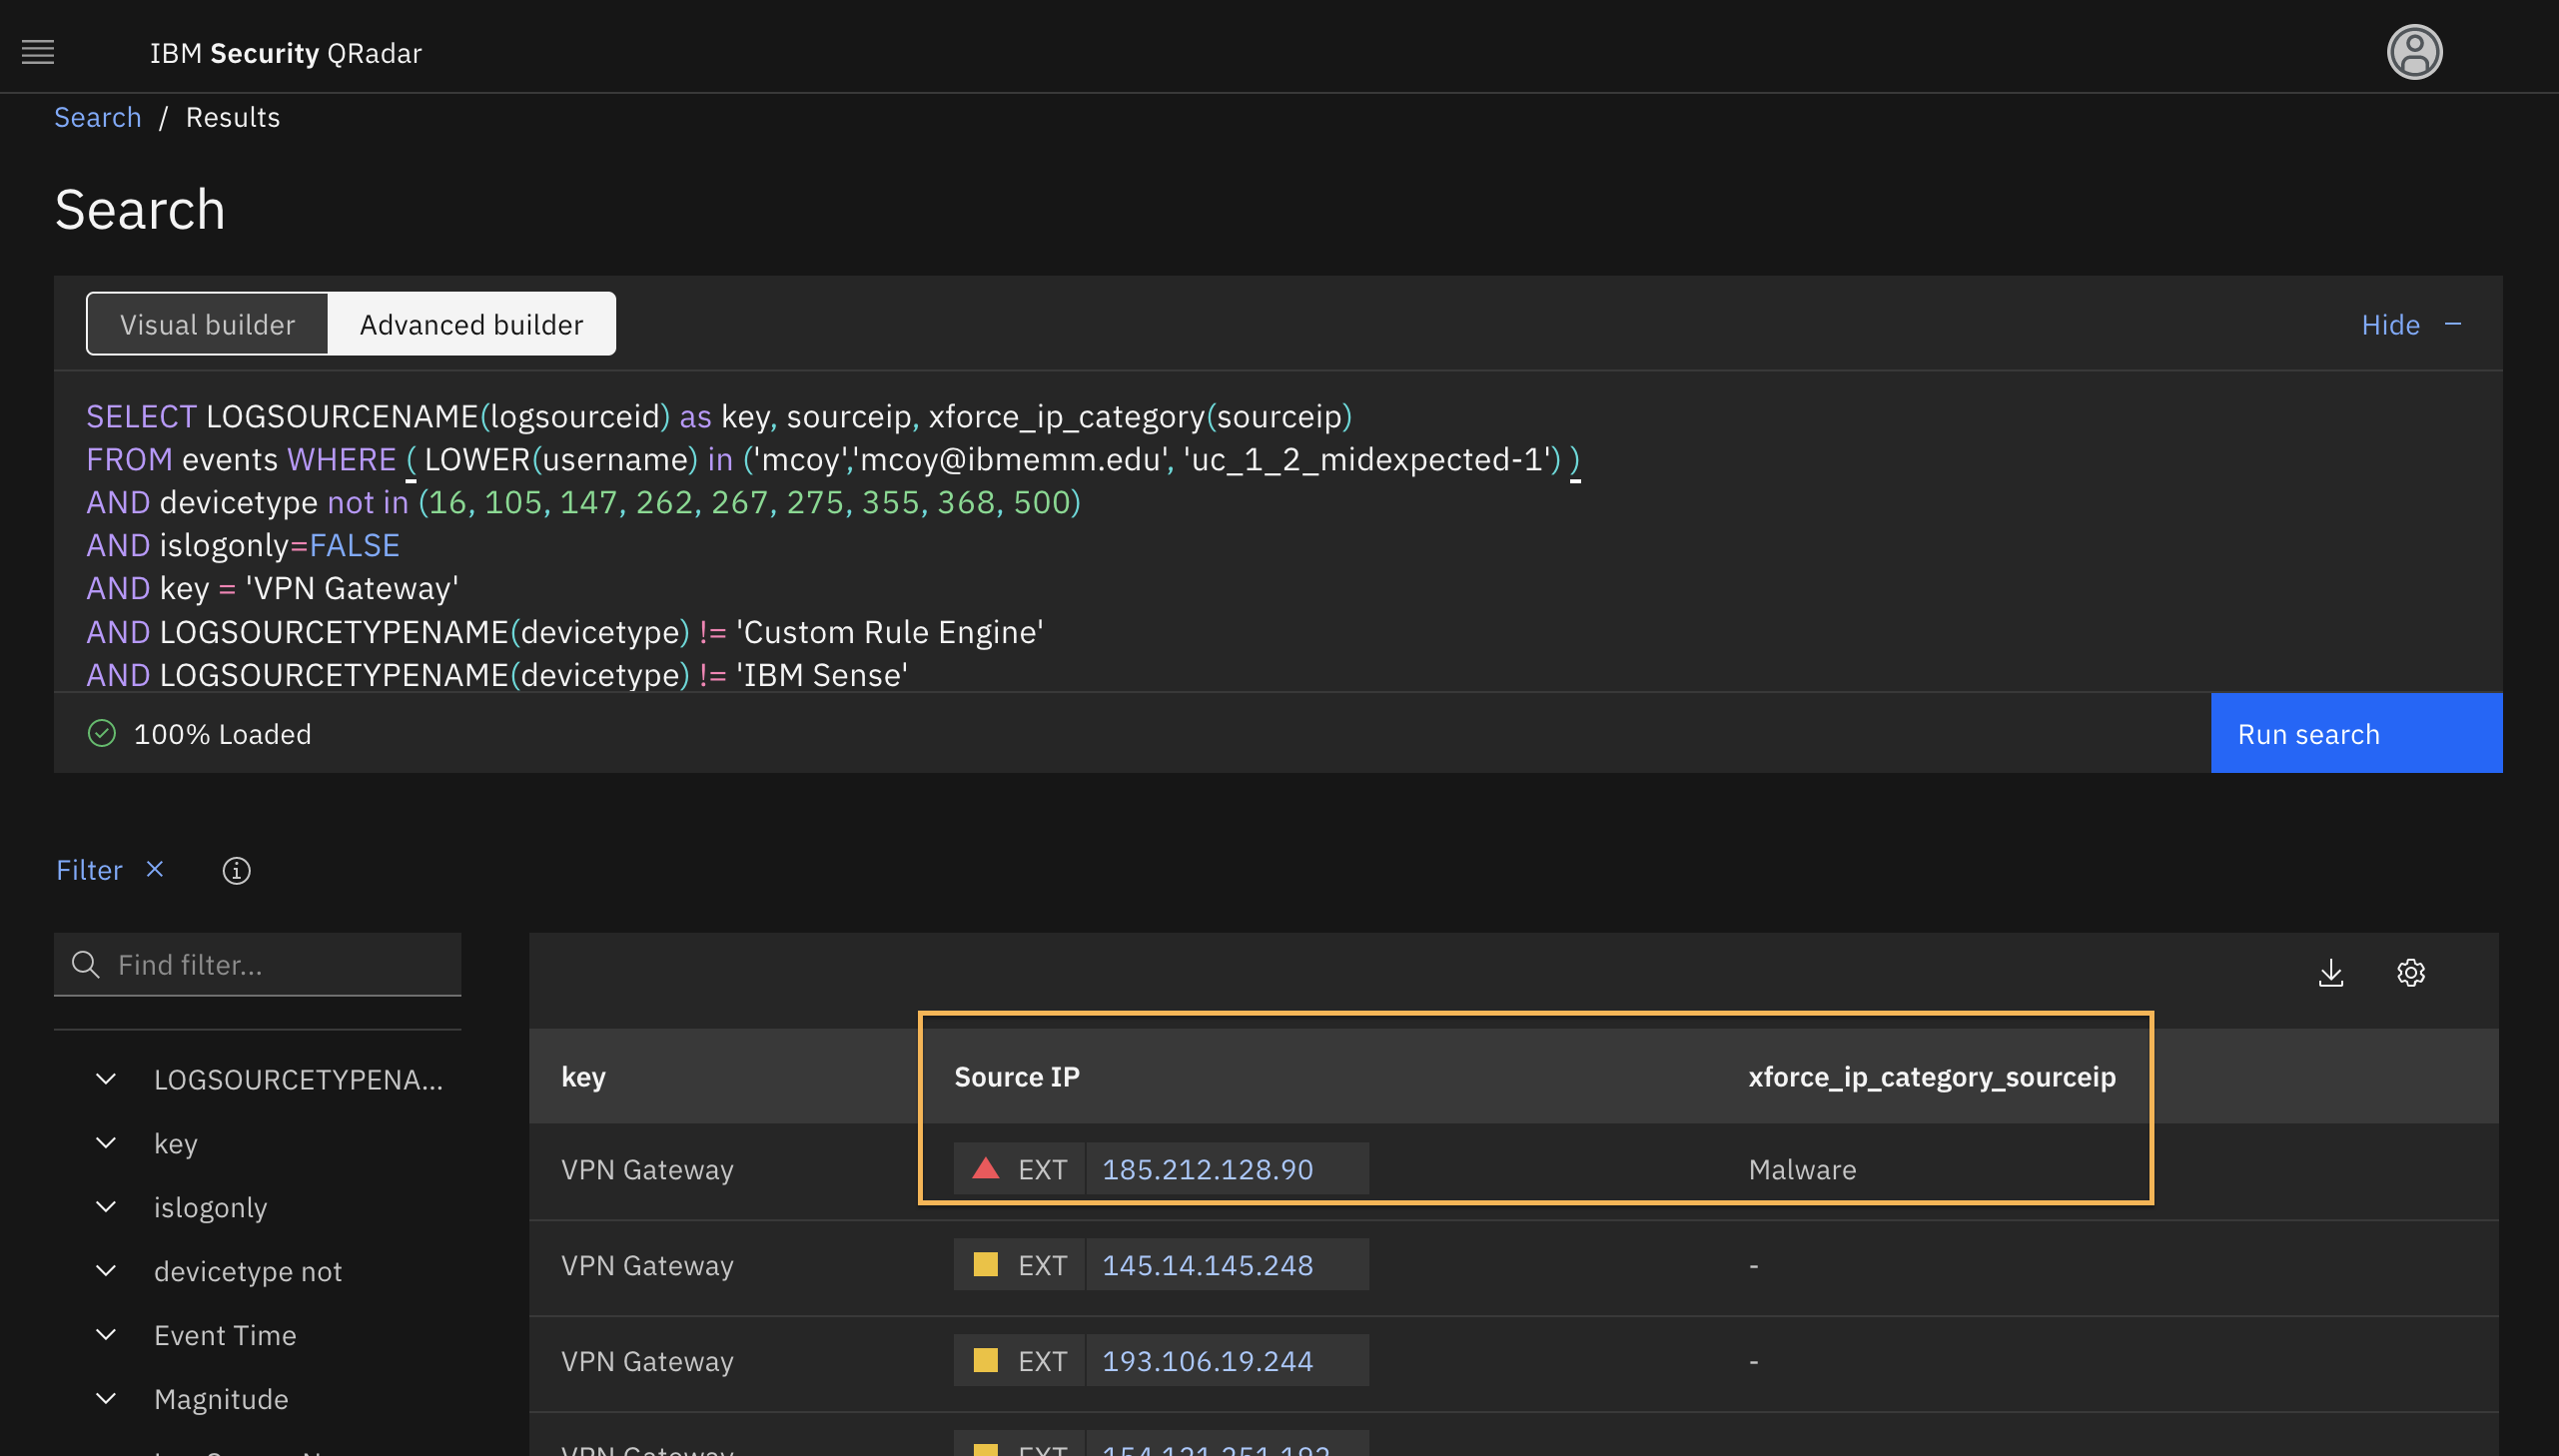
- Modify the default AQL query as follows
SELECT LOGSOURCENAME(logsourceid) as key, sourceip, xforce_ip_category(sourceip) FROM events WHERE ( LOWER(username) in ('mcoy','mcoy@ibmemm.edu', 'uc_1_2_midexpected-1') ) AND devicetype not in (16, 105, 147, 262, 267, 275, 355, 368, 500) AND islogonly=FALSE AND key = 'VPN Gateway' AND LOGSOURCETYPENAME(devicetype) != 'Custom Rule Engine' AND LOGSOURCETYPENAME(devicetype) != 'IBM Sense' START 1686628740000 STOP 1686628920000text
Keep the default Start and Stop time values in the AQL query. Do not modify them.
- Click Run Search and review the results.
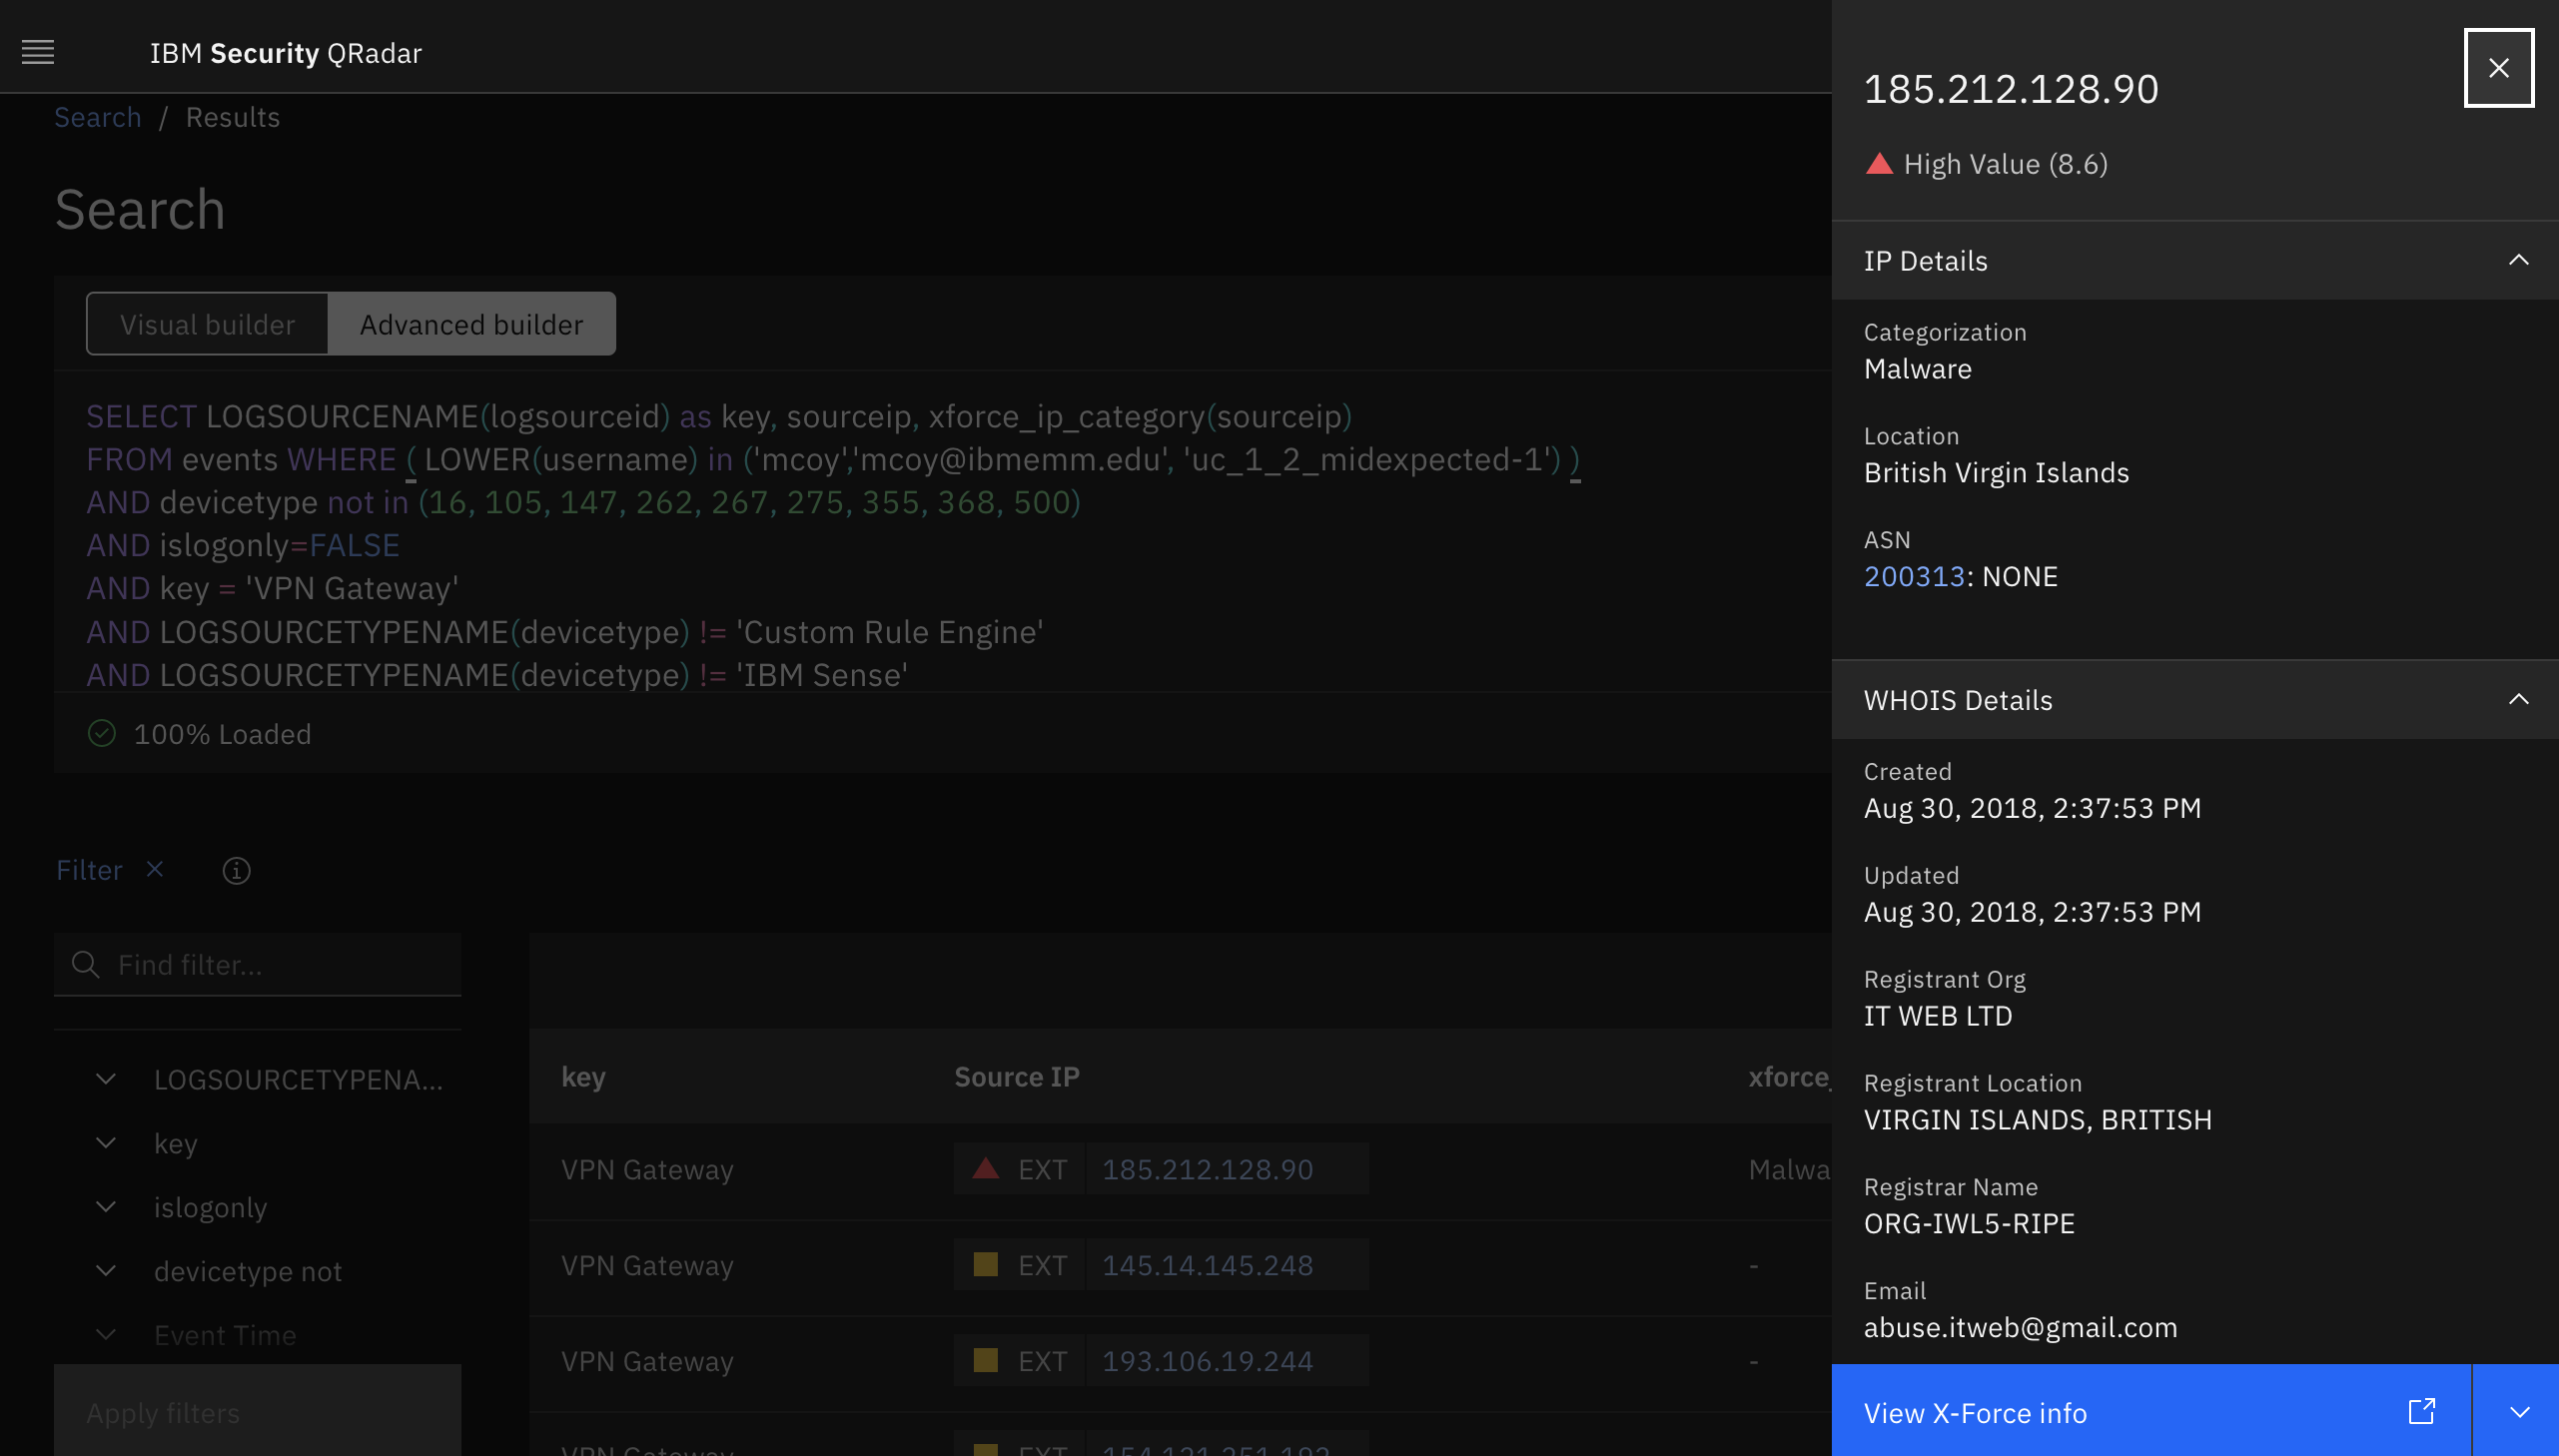
- To look up the X-Force threat intel score, click the IP address.
Investigations and montoring behavior using the watchlists
-
Back on the UBA Overview page, scroll down to the Domain Admins watchlist.
-
Notice the two users listed as Domain Admins are also high-risk users. The watchlist makes it easier to track specifics groups of users.
A few notes:
-
Watchlists can be used to scale users scores up or down. They also can be used to give users a higher or low priority of being monitored by machine learning.
-
Watchlists can be created:
- from a list of users found in a reference set
The watchlist is updated as users are added or removed from the reference set.
The default Dormant accounts watchlist is based on the UBA : Dormant Accounts reference set, which must not be edited or removed.
- by setting an expression based on a field imported with User imports.
For example, create a watchlist for all users with Department set to HR.
Another example, all users with username starting with svc (^svc)
- from a list of users found in a reference set
Machine Learning investigation
With machine learning models, you can see the variety of activities for a user. The graphs for each model appear on the user details page. They indicate the status of the models. Once the model is built, it presents the data on the graph with learned and actual activity patterns. If the users' activity changes from their regular pattern, an anomaly is triggered and indicated on the graph with a red circle.
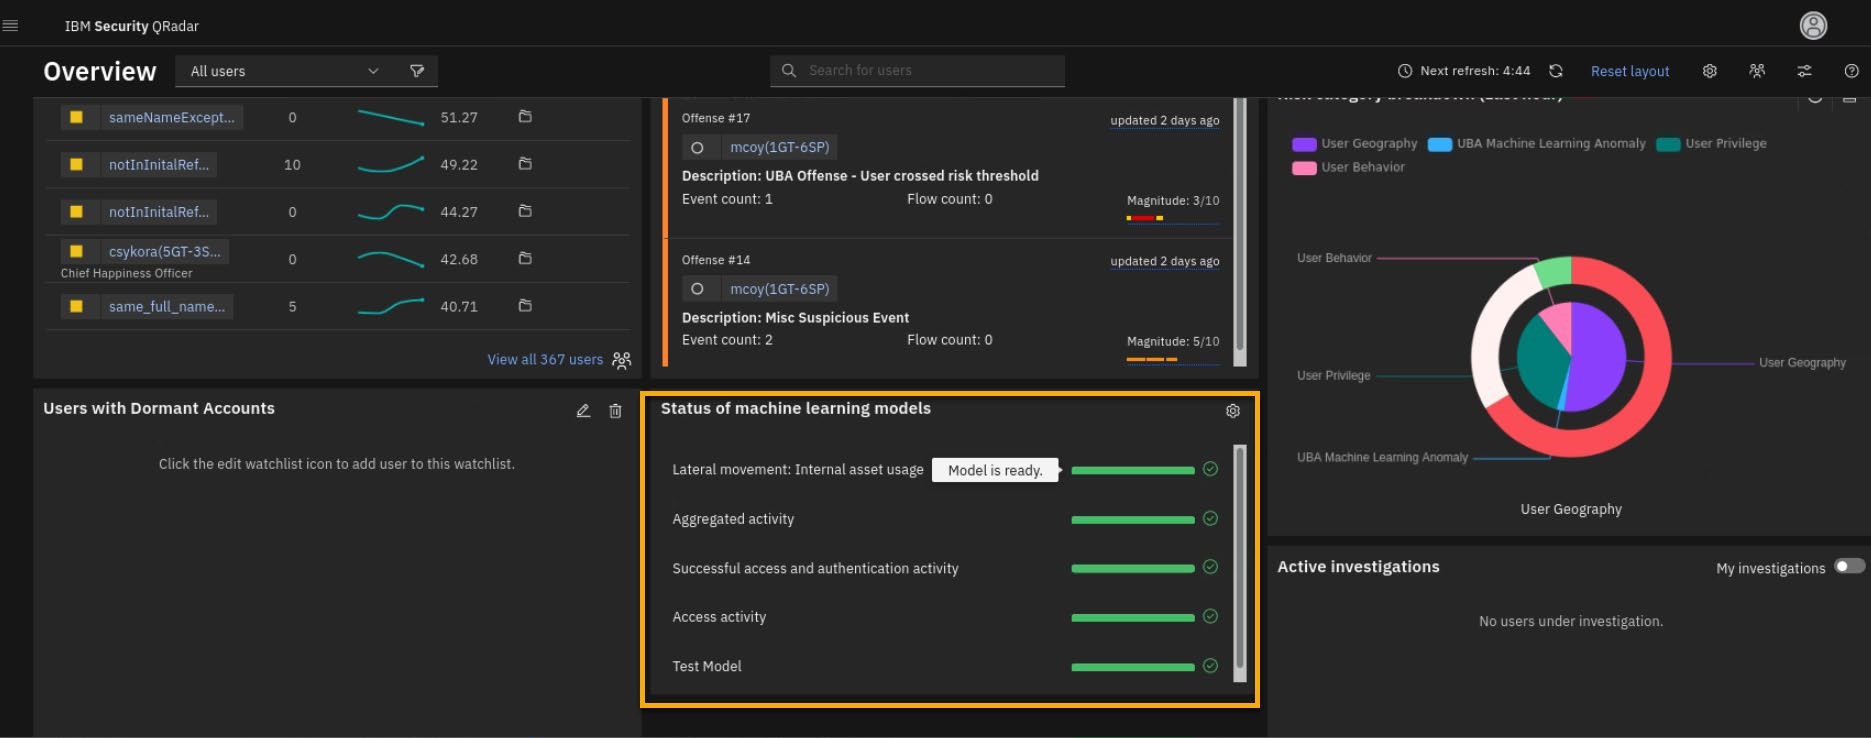
- On the UBA Overview page, locate the Status of Machine Learning widget. The widget indicates when the models are complete or if there is an issue.
When all models are successfully built the widget will look like the following screen capture.
-
From the UBA Dashboard, select a user, jwilliams(5GT-3SP), and right-click to navigate to their profile page.
-
Notice the machine learning graphs on his page.
If your models have just been completed, you might have a graph similar to the following screen capture.
If the models in the lab have had enough time to complete building, the charts will look similar to the following screen capture.
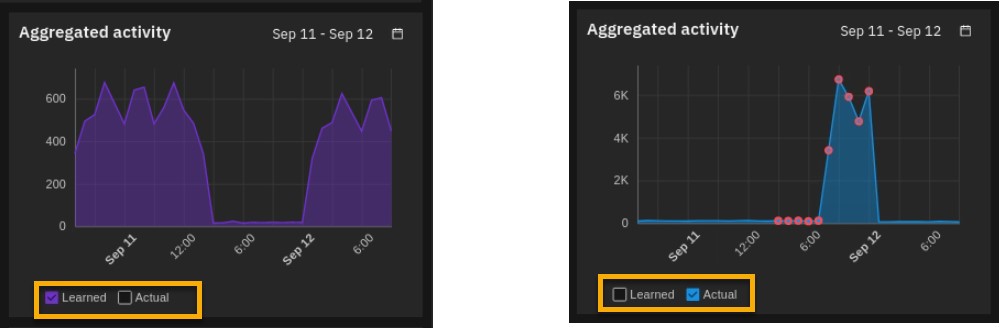
The graph shows the user's Learned pattern of successful access and authentication activity (purple graph). The pattern is based on the historical data that was processed while building the model.
The Actual pattern (blue graph) indicates the user's pattern of activity while the model is still processing (reading) data and building confidence.
Once the model has ingested enough data to reach the level of confidence indicated by the model, it will start reporting anomalies if the user's pattern changes.
- Note that you can use filters for the Learned and Actual patterns in the graphs.
- If you see red dots on your graph, the machine learning model saw the changes in the behavior and generated the use case risk score. If you click the red dot, it also gives you the confidence score of the accuracy of evaluation when the anomaly (or risk event) is sent.
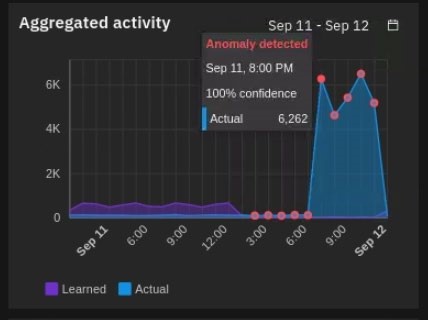
Note: Remember that you control the confidence level used to trigger the risk score in the setting of the machine learning model.
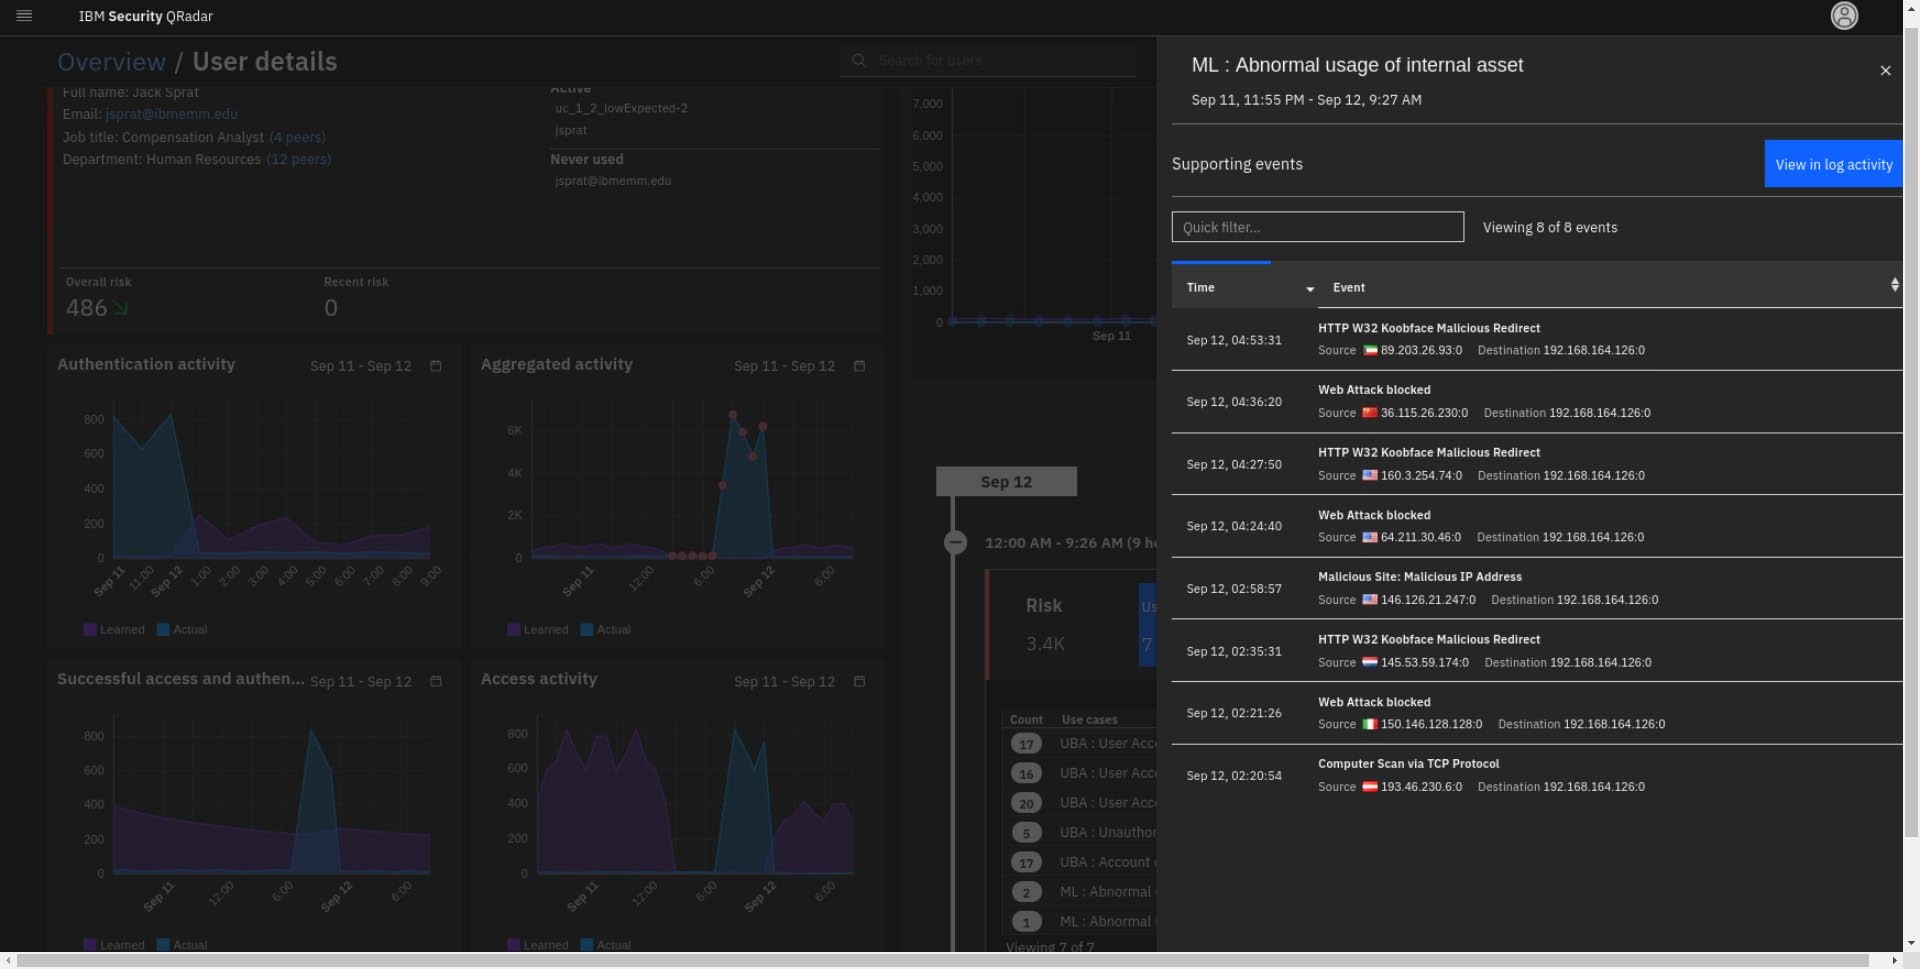
- In the Timeline table, click Use Cases > ML Abnormal usage of internal assets.
Note that this type of machine leaning model is the observable type. Thus, it has no graph but produces two use case events; one for first-time use of an asset (an IP in this case) and one for the deviation from normal usage of assets.
Modifying the Machine Learning graphs
Most of the default models in UBA come similar to the previous graph. When you create a custom model, the option to have a chart is disabled by default.
-
Navigate to the UBA Dashboard Overview page.
-
To open the ML settings, click the Machine Learning link.
-
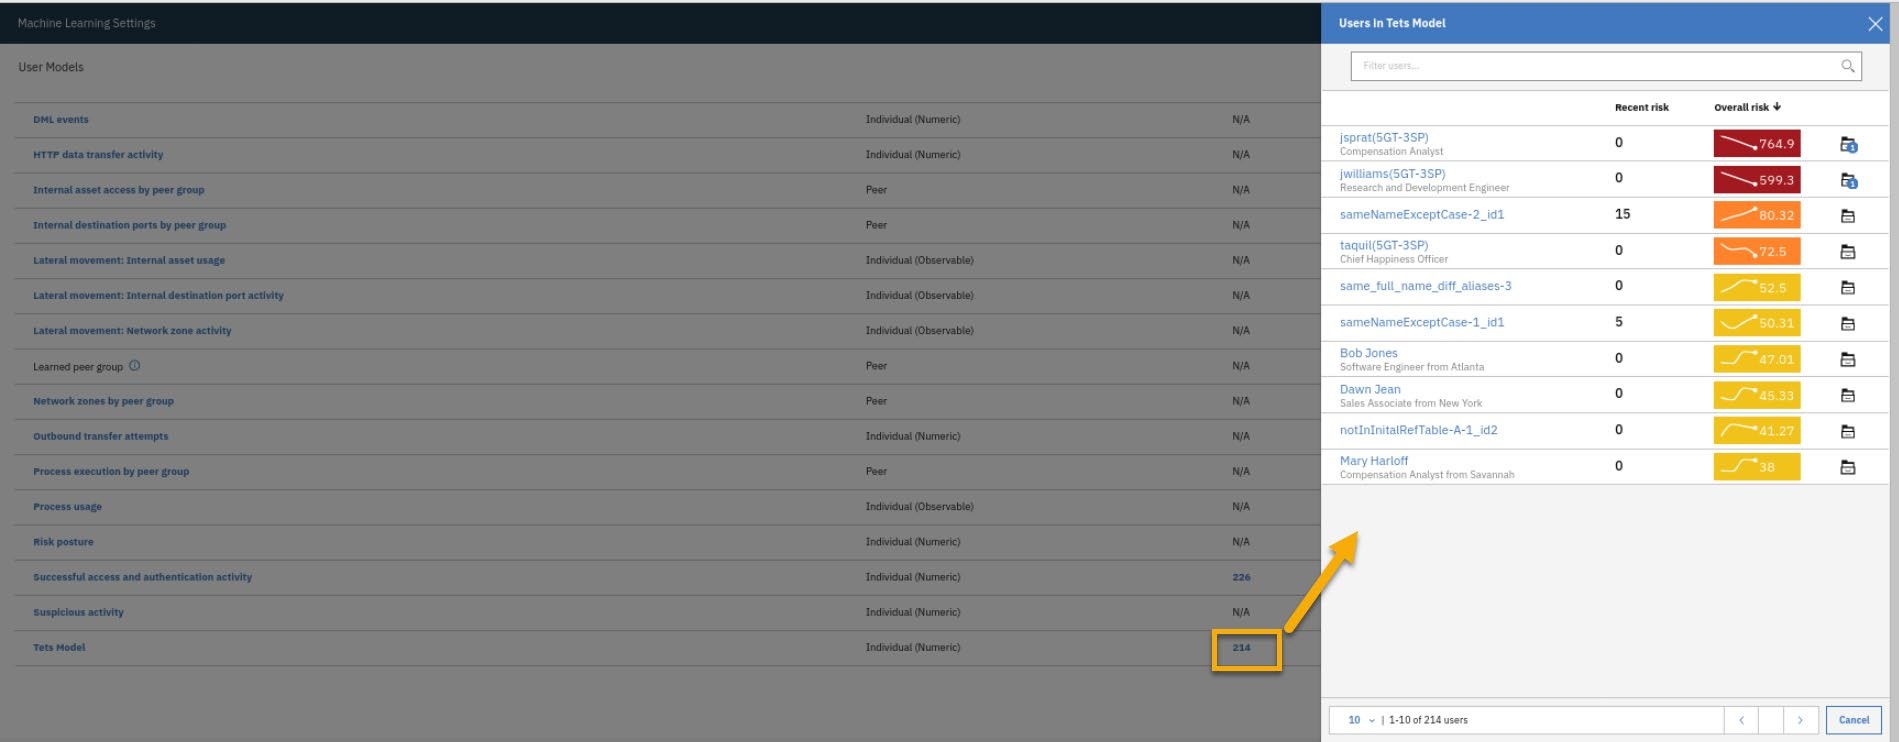
Scroll to find the Test Model created earlier.
-
To see the number of users monitored by this model and what those users are click the link number next to the model.
-
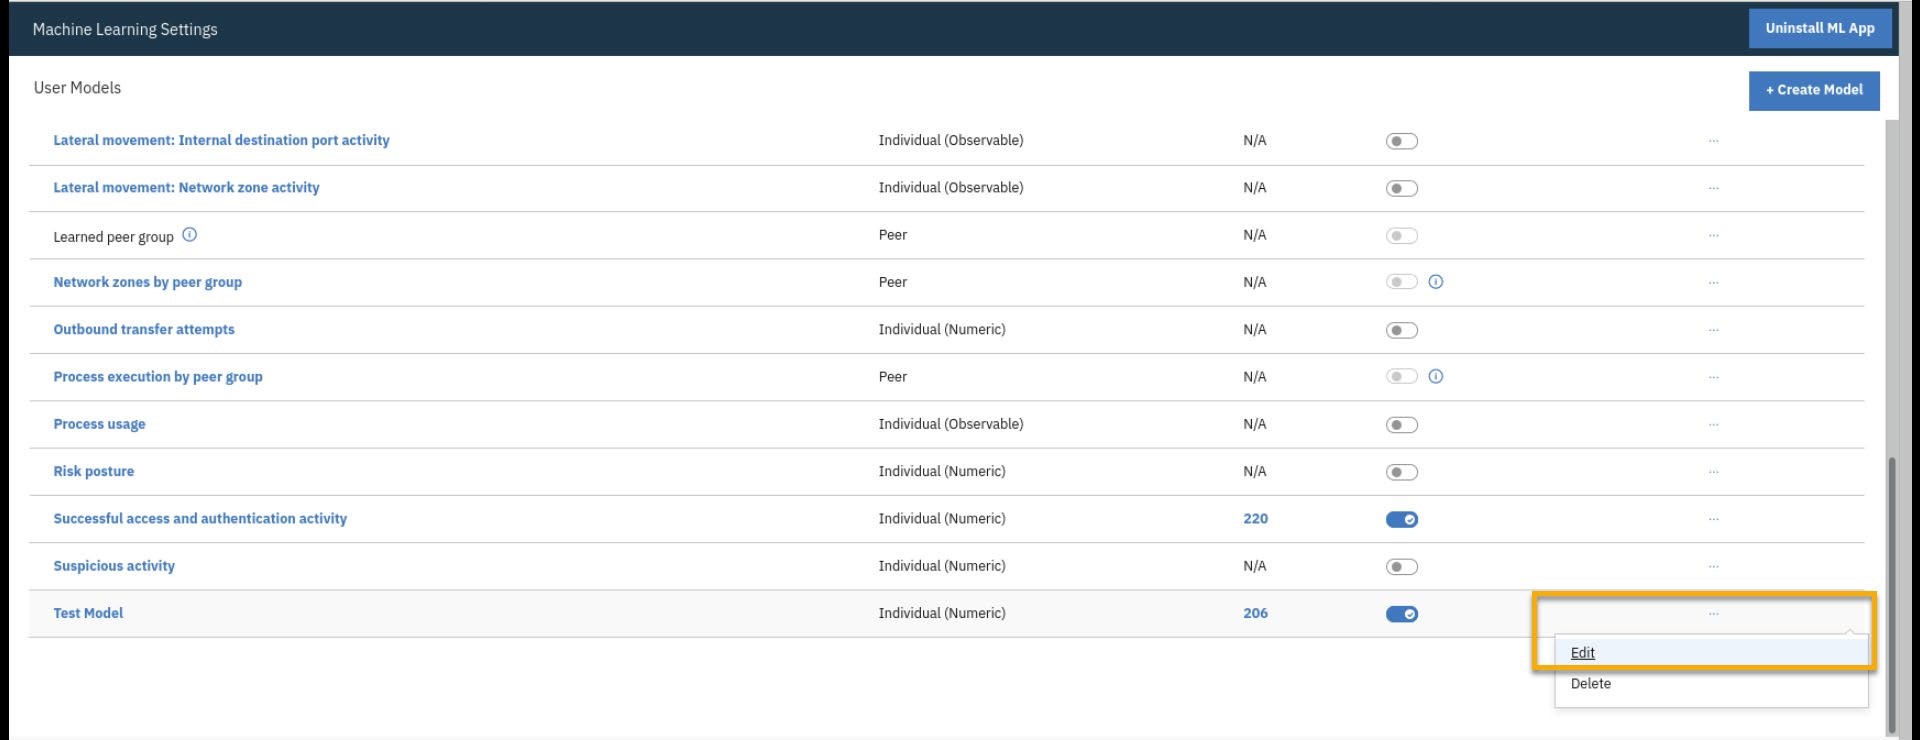
To edit the model, click the ellipses to the right.
-
Click Edit.
- In the edit dialog, note the settings for the model and enable the Show Graph on user details page.
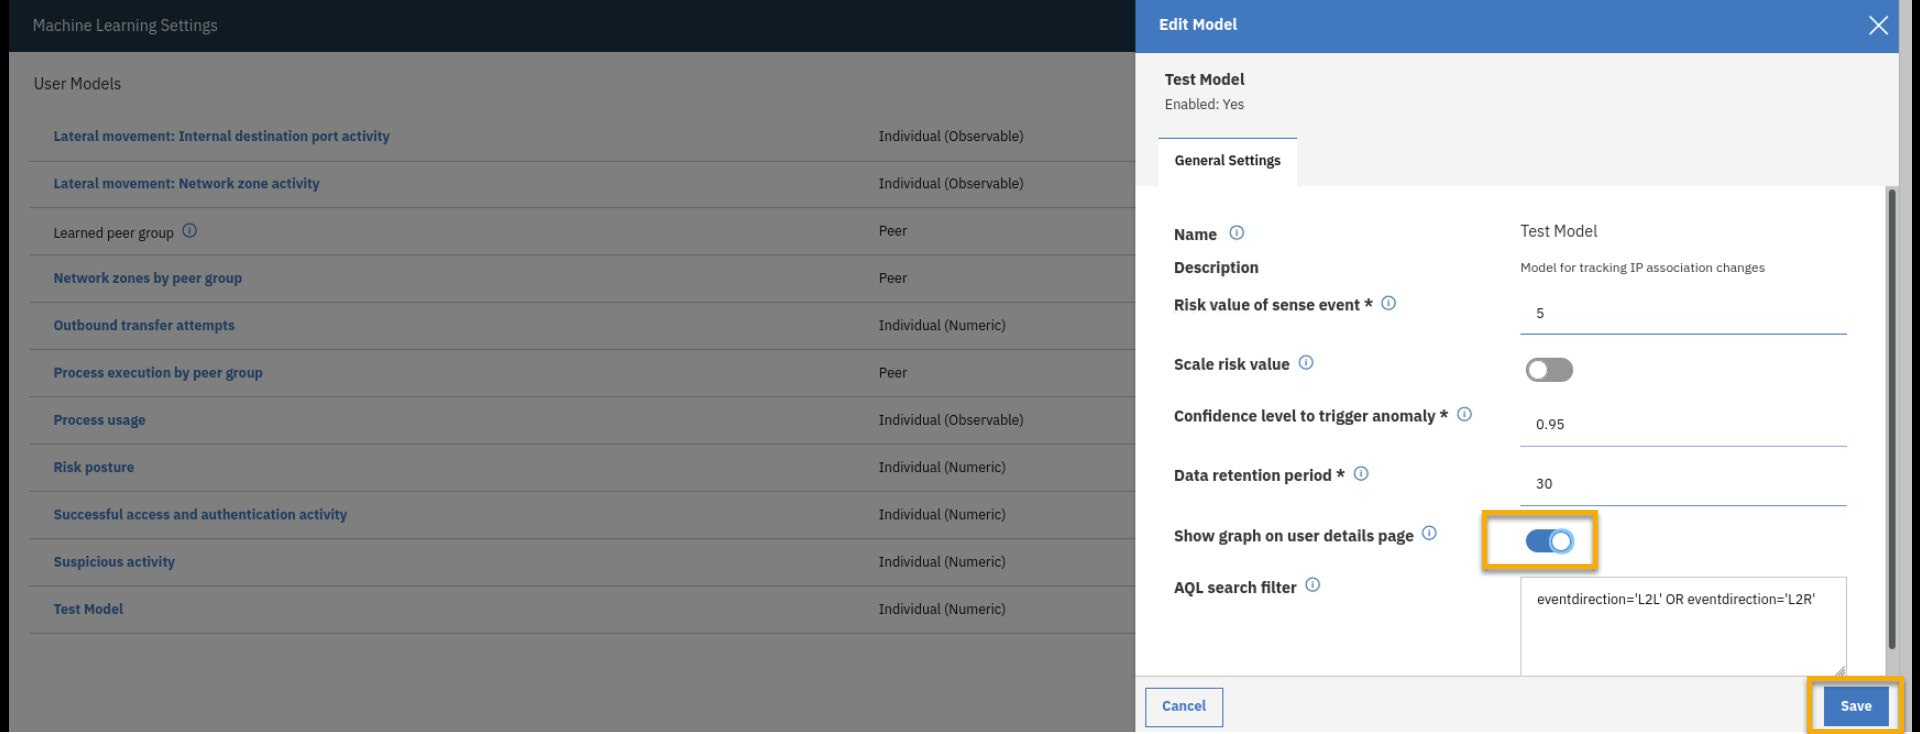
-
Click Save.
-
Close the settings tab
-
Open the users jwilliams profile page again.
-
Note there is now a graph for the Test Model on the page.
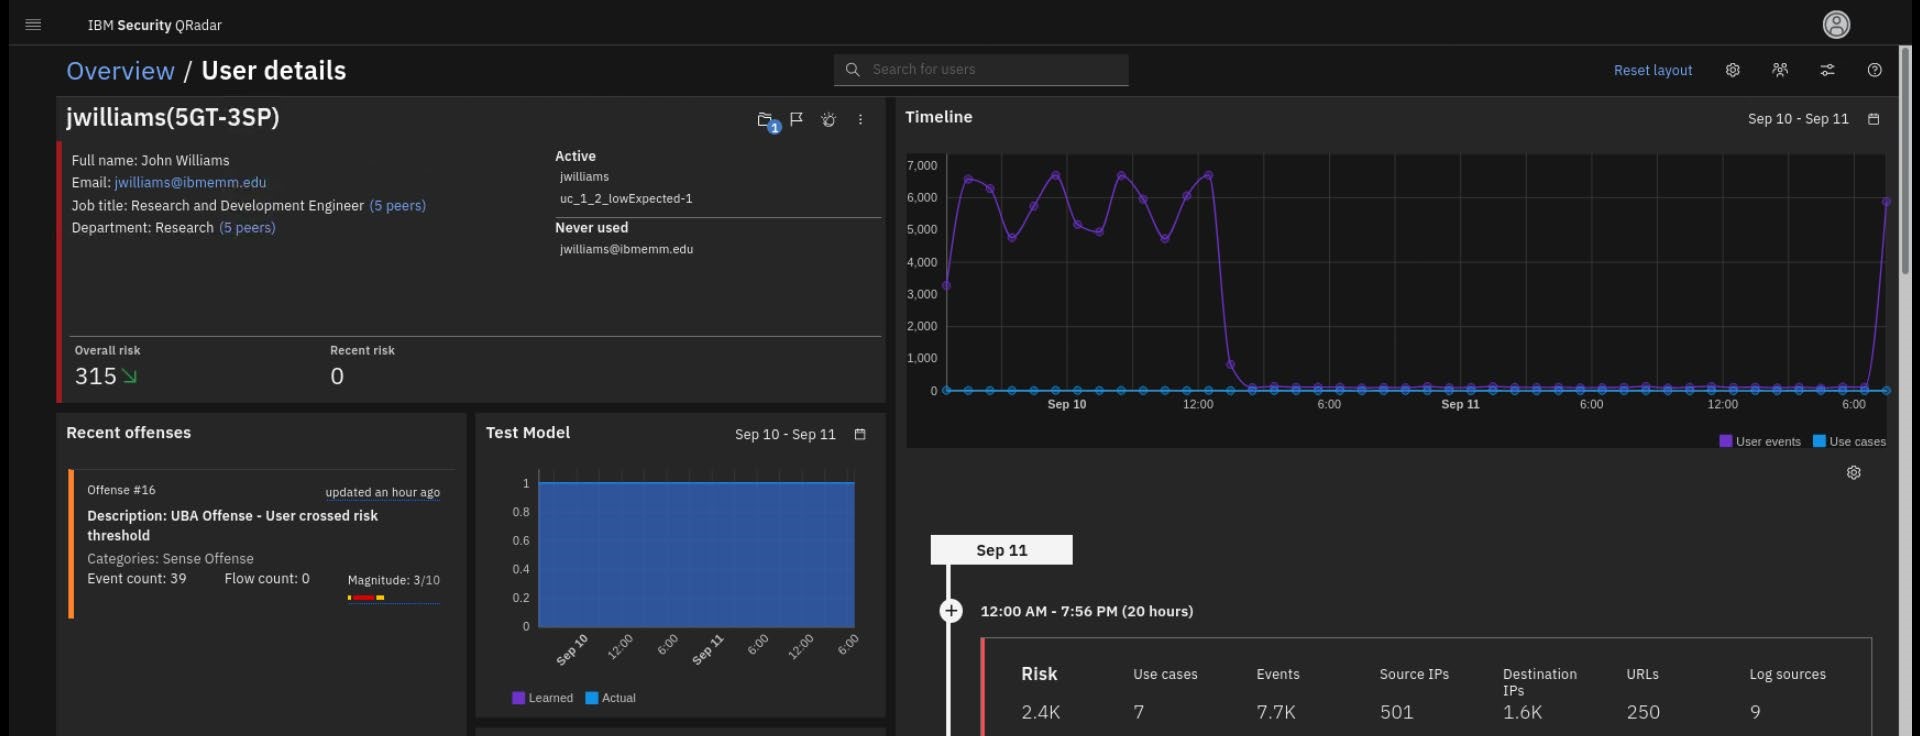
The graph from the Test Model model shows a consistent use of IPs. Therefore, there are not peaks or anomalies present.
Summary
You have just finished a deep dive into User Behavior Analytics. Congratulations! This lab should give you good experience with navigating around not only User Analytics, but also QRadar as well.
During this lab you have installed Machine Learning, enabled ML models, and used those models to look for user behavior that can reveal insider threats to your organization.