Maximo Visual Inspection (MVI) - Part 1
In this lab you will first see the connection between Maximo Monitor and MVI.
Then you will create your own data set, label, and augment using an MVI instance.
HEADS UP! L3 Quiz Content denoted with 🟢
Maximo Monitor and MVI
Step 1: Log in to Maximo Application Suite Navigator
Actions:
- Click on this Maximo Application Suite Demo Environment URL link to launch IBM Maximo Application Suite and bring up the log-in page.

- IBM Maximo Application Suite log in page opens.
- Enter MVI Username (A) and click Continue (B)
- Enter MVI Password and click Log in (figure not shown for this step)

Sample Dialogue: Once the login credentials are accepted, the MAS Application Suite navigator window opens. Several applications that make up the Maximo Application Suite are displayed. In this demo, the focus will be on the Maximo Visual Inspection application; however, Part One of this demo, briefly looks at MVI AI model inspection results in the MAS Monitor application.
Spanish Helper Una vez que se aceptan las credenciales de inicio de sesión, se abre la ventana Navegador de suite de la aplicación MAS. Se muestran varias aplicaciones que componen Maximo Application Suite. En esta demostración, el enfoque estará en la aplicación Maximo Visual Inspection; sin embargo, la primera parte de esta demostración analiza brevemente los resultados de la inspección del modelo AI de MVI en la aplicación MAS Monitor.

Step 2: Viewing MVI AI Model Inspection Results in Monitor Dashboard
Assume that the analyst’s AI solution is set up so that cameras constantly monitor every tank in the facility. The feed from the cameras is analyzed every hour by Maximo Visual Inspection’s AI model and uploaded as IoT (Internet of Things) events. Maximo Monitor then maps and plots these details on a set of dashboards. Rules are also triggered to generate alerts on the dashboard. As a result, plant engineers and operational managers can view the condition of all tanks from a single screen and act on assets that need attention.
Spanish Helper Suponga que la solución de IA del analista está configurada para que las cámaras monitoreen constantemente cada tanque en la instalación. El modelo de IA de Maximo Visual Inspection analiza la transmisión de las cámaras cada hora y la carga como eventos de IoT (Internet de las cosas). Luego, Maximo Monitor mapea y traza estos detalles en un conjunto de tableros. Las reglas también se activan para generar alertas en el tablero. Como resultado, los ingenieros de planta y los gerentes operativos pueden ver la condición de todos los tanques desde una sola pantalla y actuar sobre los activos que necesitan atención.
Actions:
- Click the Monitor tile on the MAS application Suite navigator home screen.

- Click the Monitor tile on the Welcome screen that opens.

- On the left sidebar, click the right arrow icon (A) to view more options in the Ribbon menu. Click the Devices tab (B) from the menu to view the list of device types in this WRA.

Sample Dialogue: In the Monitor application, you can see a list of device types for this Water Resource Authority. Clicking on any device type can show further details about any active analysis or data inflow for the device type, as you will see in the next step.
Spanish Helper En la aplicación Monitor, puede ver una lista de tipos de dispositivos para esta Water Resource Authority. Al hacer clic en cualquier tipo de dispositivo, se pueden mostrar más detalles sobre cualquier análisis activo o entrada de datos para el tipo de dispositivo, como verá en el siguiente paso.
- In the search area, type “Sedimentation” (A) to filter the displayed device type’s list and click on the filtered result SedimentationTanks_LI (B) to view the sedimentation tanks dashboard on the right. 🟢

- Click on the Left sidebar icon to hide the sidebar and view the dashboard in full-screen mode.


Sample Dialogue: One common challenge with manual inspections carried out by multiple inspectors across multiple teams in this scenario is to get an aggregated high-level status of all the tanks. Even more difficult is to get this information in a timely manner. Using Maximo Application Suite, this challenge becomes almost trivial to solve.
Spanish Helper: Un desafío común con las inspecciones manuales realizadas por varios inspectores en varios equipos en este escenario es obtener un estado agregado de alto nivel de todos los tanques. Aún más difícil es obtener esta información de manera oportuna. Con Maximo Application Suite, este desafío se vuelve casi trivial de resolver.
The Tank Alerts card (top right) shows the alert history for the Sedimentation Tanks is this group. The Plant Manager see’s there is an alert for Tank2 🟢
The Inspection Results table card (bottom right) is currently empty, but this is where the Plant Manager can view the company’s automated MVI inspection results.
Creating, labeling and augmenting a data set
Step 1: Launch Maximo Visual Inspection
Actions:
- Click on the IBM Maximo Application Suite label at the top left of the screen. You are returned to the MAS Suite Navigator screen.

- On the MAS Suite navigator screen, click on the Visual Inspection tile.

- Click Continue.

Step 2: Create a Dataset for Model Training in Maximo Visual Inspection
Sample Dialogue: What is an MVI dataset, and why do you need to create one?
As a first step towards building your AI inspection model, you must create a dataset in MVI containing images of clean and dirty tanks to teach the model what each class looks like.
Data is at the heart of machine learning (ML). In the case of vision-based models, this data takes the form of images or videos. Built-in MVI ML models intelligently detect and learn patterns in the uploaded dataset and analyze this data repeatedly until it can discern distinctions and ultimately recognizes objects of interest in the images. For example, to train a computer to recognize automobile tires, you need to feed it with vast quantities of tire images and tire-related items to learn the differences and identify a tire, especially one with defects.
For this use case model, you will create a dataset with a limited number of clean and dirty tank images for brevity; however, in real world scenarios, a computer vision model would require many more images and processing time than this demonstration offers.
In this demo, you manually upload saved tank images from your local machine to the MVI application dashboard, however, built-in image capture modes in MVI Mobile and MVI Edge applications (parts of the MVI solution) can also be used to collect and copy images automatically into the MVI application. Now it's time to start creating a dataset.
Spanish Helper: Como primer paso para construir su modelo de inspección de IA, debe crear un conjunto de datos en MVI que contenga imágenes de tanques limpios y sucios para enseñarle al modelo cómo se ve cada clase.
Los datos están en el corazón del aprendizaje automático (ML). En el caso de modelos basados en visión, estos datos toman la forma de imágenes o videos. Los modelos MVI ML incorporados detectan y aprenden de manera inteligente patrones en el conjunto de datos cargado y analizan estos datos repetidamente hasta que pueden discernir distinciones y, en última instancia, reconocer objetos de interés en las imágenes. Por ejemplo, para entrenar a una computadora para que reconozca llantas de automóviles, debe alimentarla con una gran cantidad de imágenes de llantas y elementos relacionados con llantas para aprender las diferencias e identificar una llanta, especialmente una con defectos.
Para este modelo de caso de uso, creará un conjunto de datos con un número limitado de imágenes de tanques limpios y sucios por motivos de brevedad; sin embargo, en escenarios del mundo real, un modelo de visión por computadora requeriría muchas más imágenes y tiempo de procesamiento de lo que ofrece esta demostración.
En esta demostración, usted carga manualmente imágenes de tanques guardadas desde su máquina local al tablero de la aplicación MVI; sin embargo, los modos de captura de imágenes integrados en las aplicaciones MVI Mobile y MVI Edge (partes de la solución MVI) también se pueden usar para recopilar y copiar imágenes automáticamente en la aplicación MVI. Ahora es el momento de comenzar a crear un conjunto de datos.
Action:
- Click Get started on the MVI Welcome to IBM Maximo Visual Inspection screen.

The Data sets window opens.

- On the MVI Data sets screen, Click the blue + icon just under Create data set label on the left.

- Enter “Sedimentation Tanks <YOUR INITIALS>” for the Data set name field in the Create data set window (since you are sharing the Maximo Visual Inspection demo environment with other people a unique identifier is required to avoid name conflicts) (A).
- Click Create (B).

Important: This demo script does not address dataset names with any unique identifier. Hence to follow along as an example, if you are instructed to click on the Sedimentation Tanks dataset, you would instead click on Sedimentation Tanks <YOUR INITIALS> dataset, i.e., the dataset you named along with your unique identifier.
- Click on the lower half of the newly created Sedimentation Tanks tile (where a light grey image icon is shown).

Sample Dialogue: Once you click on this tile, a window opens for the data set you just created. As shown in the upcoming steps, you can perform several key operations on this page, such as uploading images, labeling objects, augmenting data, and training your model.
Spanish Helper: Una vez que hace clic en este mosaico, se abre una ventana para el conjunto de datos que acaba de crear. Como se muestra en los próximos pasos, puede realizar varias operaciones clave en esta página, como cargar imágenes, etiquetar objetos, aumentar datos y entrenar su modelo.
- Navigate to the directory location where you unzipped the “Images of Sedimentation Tanks for training” folder, downloaded and extracted in the Pre-work Step 2.
- Click Import Files to import the model training tank images from the directory where you unzipped the sample files.

- Select all the tank images from the folder and click Open.

Sample Dialogue: After a few seconds, the images are uploaded to your newly created dataset. This dataset includes several photos of clean and dirty sedimentation tanks. You are now ready to label these images.
Spanish Helper: Después de unos segundos, las imágenes se cargan en su conjunto de datos recién creado. Este conjunto de datos incluye varias fotos de tanques de sedimentación limpios y sucios. Ahora está listo para etiquetar estas imágenes.
Step 3: Label the Dataset
Sample Dialogue: In this step, you will label the tank images. Labeling is tagging the input images with information about its content. In object detection, this would involve highlighting occurrences of items of interest. In the case of this demo, you will go through each of the uploaded tank images and highlight the portion of the image that represents a clean or a dirty tank. During the training phase, these labelled images will allow your model to learn which part of the image represents a tank and next whether that image portion contains a clean or a dirty tank.
As you can imagine, labeling the images correctly is critical to the accuracy of the model you are creating because it directly impacts the overall quality of the trained model. Quite simply, when it comes to identifying objects or classifying images, you want a use case domain expert – the person with the relevant subject matter expertise (SME) – to be labeling these images. This will ensure the highest quality of input into the model training. Traditionally, data scientists have been the focal point of AI initiatives and have wasted their precious time labelling data (despite not even being a domain expert; for example, would a data scientist be able to better label a dirty tank than the on-site inspection engineer?). With MVI, a domain expert – with no data science expertise– can label the images and then subsequently build a model based on those images.
This approach lowers the barrier to entry and empowers domain experts with limited to no AI training the ability to create and deploy working AI models in a matter of hours, not days or weeks.
Spanish Helper: En este paso, etiquetará las imágenes del tanque. Etiquetar es etiquetar las imágenes de entrada con información sobre su contenido. En la detección de objetos, esto implicaría resaltar las ocurrencias de elementos de interés. En el caso de esta demostración, revisará cada una de las imágenes de tanque cargadas y resaltará la parte de la imagen que representa un tanque limpio o sucio. Durante la fase de entrenamiento, estas imágenes etiquetadas permitirán que su modelo aprenda qué parte de la imagen representa un tanque y luego si esa parte de la imagen contiene un tanque limpio o sucio.
Como puede imaginar, etiquetar las imágenes correctamente es fundamental para la precisión del modelo que está creando porque afecta directamente la calidad general del modelo entrenado. En pocas palabras, cuando se trata de identificar objetos o clasificar imágenes, desea que un experto en el dominio de casos de uso, la persona con la experiencia en la materia (SME) relevante, etiquete estas imágenes. Esto asegurará la más alta calidad de entrada en el entrenamiento del modelo. Tradicionalmente, los científicos de datos han sido el punto focal de las iniciativas de IA y han desperdiciado su precioso tiempo etiquetando datos (a pesar de no ser ni siquiera un experto en el dominio; por ejemplo, ¿podría un científico de datos etiquetar mejor un tanque sucio que la inspección en el sitio? ¿ingeniero?). Con MVI, un experto en el dominio, sin experiencia en ciencia de datos, puede etiquetar las imágenes y luego construir un modelo basado en esas imágenes.
Este enfoque reduce la barrera de entrada y permite a los expertos de dominio con capacitación limitada o nula en IA la capacidad de crear e implementar modelos de IA que funcionen en cuestión de horas, no de días o semanas.
Actions:
Once all the pictures are uploaded in MVI perform the following steps:
- Click the Select checkbox to automatically select all the dataset images (A).
- Click Label objects (B).

Sample Dialogue: The Label objects / Sedimentation Tanks page opens. This is where you create labels for clean and dirty tanks and assign them to the relevant portion of the images in the dataset. Various sections of the Label objects page user interface for layout reference are highlighted below.
Spanish Helper: Se abre la página Etiquetar objetos/Tanques de sedimentación. Aquí es donde crea etiquetas para tanques limpios y sucios y las asigna a la parte relevante de las imágenes en el conjunto de datos. A continuación se destacan varias secciones de la interfaz de usuario de la página Objetos de etiqueta para referencia de diseño.

- To start the labeling process, you must define the labels (clean and dirty). Click + Add label in the Objects window on the far right.

- In the Add objects window that opens, type “clean” in the Create object field (A) and then click the Add button (B).

- Now, type “dirty” in the Add objects window and click Add.

- Click Ok to complete the Add label process.
- Once the labels are defined, you can start the process of labelling the tank objects appropriately. Make sure the first tank image is selected in the Image Navigator (you will see a dark blue box around the selected image in the Image Navigator on the left). Select the clean label name from the Objects window on the right (A).
- Click the Box icon from the selection menu (B) and draw a box around a portion of the image that denotes the clean or dirty tank (C).

Due to potential random image sorting, it may be possible that the first image you will see in the image navigator may be of a dirty tank. In this case, choose the dirty label instead of clean and label the first image in step 7 of this section appropriately.
In case you make a mistake drawing the box, select the erroneous box and click the trashcan icon right next to the label. You can also press CTRL + Z or Command + Z on your Windows and Mac keyboard, respectively, to undo the last action.
Spanish Helper: Debido a la posible clasificación aleatoria de imágenes, es posible que la primera imagen que vea en el navegador de imágenes sea la de un tanque sucio. En este caso, elija la etiqueta sucio en lugar de limpio y etiquete la primera imagen en el paso 7 de esta sección de manera adecuada.
En caso de que cometa un error al dibujar el cuadro, seleccione el cuadro erróneo y haga clic en el ícono papelera justo al lado de la etiqueta. También puede presionar CTRL + Z o Comando + Z en su teclado de Windows y Mac, respectivamente, para deshacer la última acción.

- Label all the pictures in the Image Navigator using the instructions in the previous steps. You can click the blue downward arrow button to scroll through and select the images in sequence for labeling.

Image Labelling Tips:
- MVI remembers your previous label selection, so you do not need to click on the clean or dirty labels every time to label each new image. Just select the appropriate label the first time you start object labeling and continue to use it till it is required to switch to another object label, for example, switching from labeling a clean tank image to a dirty tank image and vice versa.
- Spanish Helper: MVI recuerda su selección de etiquetas anterior, por lo que no necesita hacer clic en las etiquetas limpias o sucias cada vez para etiquetar cada nueva imagen. Simplemente seleccione la etiqueta adecuada la primera vez que inicie el etiquetado de objetos y continúe usándola hasta que sea necesario cambiar a otra etiqueta de objeto, por ejemplo, cambiar de etiquetar una imagen de tanque limpio a una imagen de tanque sucio y viceversa.
For your convenience, a light blue bar highlights the label that is currently in selection, as shown in the screenshot below.

- Tanks with blue water are clean.
- If there is more than one tank (or portion of tanks) in an image, please draw separate label boxes around each tank, as shown in the screenshot below.

- Once all tank images in the Image Navigator are appropriately labelled, click the Back icon (not your browser’s back button) to navigate back to the Data set / Sedimentation Tanks page.

Step 4: Data Augmentation
Sample Dialogue: MVI offers an easy and cost-effective way to augment data sets. At this point, you have labelled all the tank images in the uploaded data set.
When building out a deep learning computer vision model, the more images added to the data set, the more accurate the model will generally be. However, there may be times when you do not have a dataset as varied or large enough to create an accurate and generalized model, and the cost of acquiring new data is too high.
To address this pain point, MVI provides image augmentation capabilities, where filters can be applied to perform operations such as flip, blur, sharpen, and crop, to create additional images, thus increasing model performance and decreasing the cost to acquire more data. This augmentation process multiplies the original number of images by several folds. And the good news is that any labeling that has been done in the original images is maintained in the new augmented images to avoid rework.
For this demo, it is fair to assume that a posted field camera is unlikely to take pictures of the tanks under the same conditions every time. The lighting will vary depending on weather and time of day. If the camera is rotatable, then it’s orientation to the tank and image focus can also be inconsistent. Rather than trying to provide images for all possible scenarios, image augmentation can help simulate these different conditions. This is how, data augmentation helps add additional data to your dataset to improve model performance (accuracy). You will use a few of the available MVI data augmentation options to add volume and variety to your tank images data set.
Spanish Helper: MVI ofrece una manera fácil y rentable de aumentar los conjuntos de datos. En este punto, ha etiquetado todas las imágenes de tanques en el conjunto de datos cargado.
Al crear un modelo de visión por computadora de aprendizaje profundo, cuantas más imágenes se agreguen al conjunto de datos, más preciso será el modelo en general. Sin embargo, puede haber ocasiones en las que no tenga un conjunto de datos tan variado o lo suficientemente grande como para crear un modelo preciso y generalizado, y el costo de adquirir nuevos datos sea demasiado alto.
Para abordar este problema, MVI proporciona capacidades de aumento de imágenes, donde se pueden aplicar filtros para realizar operaciones como voltear, desenfocar, enfocar y recortar, para crear imágenes adicionales, lo que aumenta el rendimiento del modelo y reduce el costo de adquirir más datos. Este proceso de aumento multiplica el número original de imágenes por varios pliegues. Y la buena noticia es que cualquier etiquetado que se haya hecho en las imágenes originales se mantiene en las nuevas imágenes aumentadas para evitar reelaboraciones.
Para esta demostración, es justo suponer que es poco probable que una cámara de campo publicada tome fotografías de los tanques en las mismas condiciones cada vez. La iluminación variará dependiendo del clima y la hora del día. Si la cámara es giratoria, entonces su orientación hacia el tanque y el enfoque de la imagen también pueden ser inconsistentes. En lugar de tratar de proporcionar imágenes para todos los escenarios posibles, el aumento de imágenes puede ayudar a simular estas diferentes condiciones. Así es como, el aumento de datos ayuda a agregar datos adicionales a su conjunto de datos para mejorar el rendimiento del modelo (precisión). Utilizará algunas de las opciones de aumento de datos MVI disponibles para agregar volumen y variedad a su conjunto de datos de imágenes de tanques.
Actions:
- Click Augment data.

- The Augment data window opens and displays all of MVI’s available data augmentation filters. Select filters Sharpen, Crop, Rotate, Vertical flip and Horizontal flip to generate additional images (A). Notice the number of images under New creations and New total labels increases as more filters are selected.
- Click Continue (B).

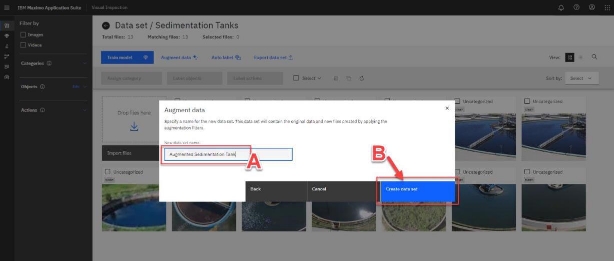
- The Augment data window opens**.** Name the new dataset by typing “Augmented Sedimentation Tank <YOUR INITIALS>” (A)
- Click Create data set to create your new augmented data set (B)
Once you click Create data set, you can track the progress of the data augmentation process in a small window that appears at the top right of the screen.
In this window;
- A blue progress bar denotes the data augmentation is in progress.
- A completion confirmation message and a green check mark indicate the completed process.

- Click the Back icon (not your browser’s back button) to return to the main Data sets page, where you can see your newly created augmented dataset.

- The main Data sets page opens and displays both the original and augmented dataset. Notice the increased number of images in the augmented dataset compared to the original dataset (the number of images in each dataset is shown right under its name in the tile). Click on the lower half (the water tank picture) of your newly created Augmented Sedimentation Tanks tile.

- Once your augmented dataset page opens, notice how all the MVI generated augmented images have a small black (“magic”) icon at the bottom right of the image. Also, how image labels are automatically transferred from the original images to their corresponding augmented images.

Congratulations, you have created a new augmented dataset from the original that is ready to be trained. Now it’s time to create the object detection model using this augmented dataset.
Part 2 of the MVI lab is available here.