Developing Anomaly Detection Rules
Introduction
Anomaly detection provides the capability to alert operators to threats that are undocumented and therefore cannot be detected by methods that monitor for well defined indicators. Such threats can be detected by monitoring for an unusual volume of activities. IBM QRadar SIEM allows you to create anomaly detection rules to monitor for deviations from the baseline of expected activities.
In these exercises, you will develop an anomaly detection rule of type Anomaly. It tests for the deviation of the number of events matching a grouped search from the weighted moving average. The rule triggers in the exercise when the sample data spikes above the deviation percentage configured in the anomaly rule.
Preparing for the Anomaly Rule
For each anomaly detection rule, a grouped search provides the time series data the Anomaly Detection Engine (ADE) will use to detect any statistical deviations. In this exercise, you create a grouped search. To confirm that your search works as intended, you feed sample data to QRadar SIEM. After QRadar SIEM has discovered the log source type of the sample data, it automatically creates a log source.
If you are using the WireGuard VPN configured in 101: QRadar Demo Setup to access the demo environment then you can perform the following activities from your workstation. If you have not configured VPN access you can perform the activities from the jump server.
Feeding sample data to QRadar SIEM
QRadar SIEM needs to process sample data to create the example used in this lab guide. Perform the following steps to start the applicable script:
- Log into the QRadar server:
ssh root@172.16.60.10bash
The password is: Q1d3m0
- Feed the prepared syslog message to QRadar:
cd /labfiles/extended/labfiles
bashchmod +x ./sendSpike.sh
bash./sendSpike.shbash
The /labfiles/extended/labfiles directory was uploaded to the QRadar server in the 103: Advanced Lab Setup exercises.
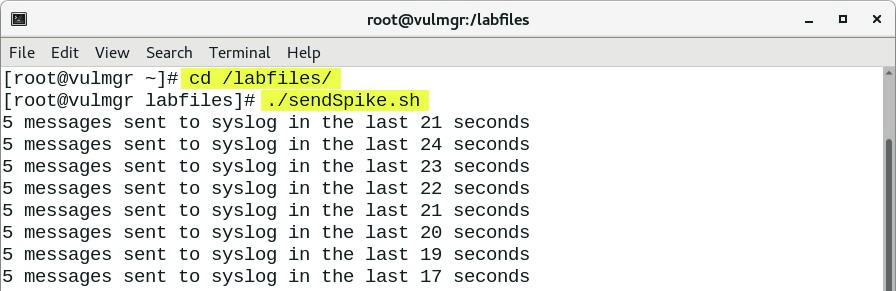
After around 25 syslog messages, QRadar discovers that they originate from a system running Linux. QRadar automatically creates a log source of the Linux OS log source type while you perform the next task.
Creating a grouped search
Anomaly detection rules test the results of a grouped event or flow search.
- Return to the QRadar console:
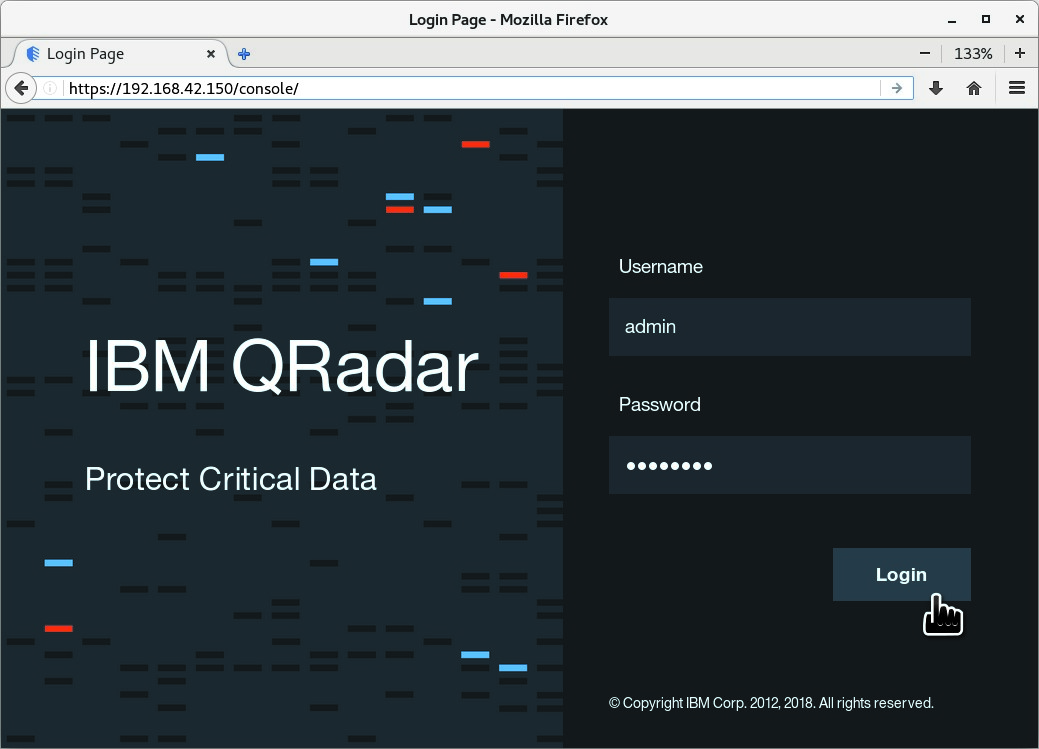
- Open your browser to: https://172.16.60.10.
- Login as admin with the password Q1d3m0.Demo.
-
Navigate to the Log Activity tab.
-
Locate the Search drop-down list on the left in the toolbar.
-
From the Search drop-down list, select New Search.
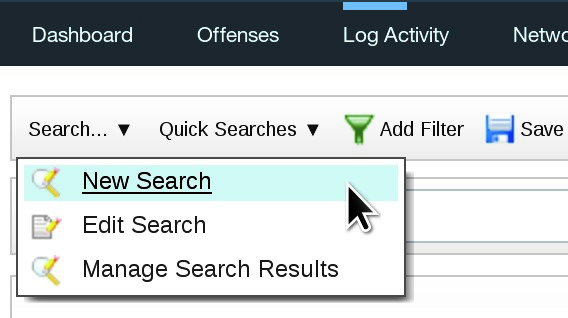
As a result, the Log Activity tab displays the form to create a new search.
-
Scroll down.
-
In the Time Range section, select Recent and Last Hour.
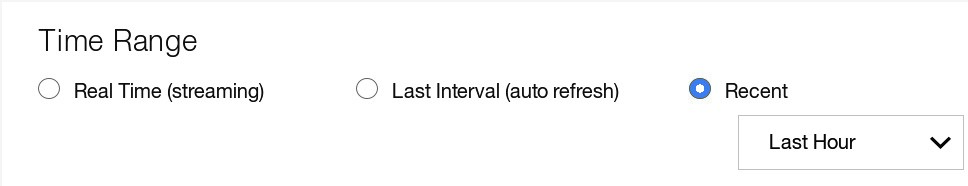
This time frame is not relevant for the anomaly rule. However, if you select a very short time frame for Recent or select Last Interval (auto refresh), you might miss the visual confirmation that your search works as intended because the search result is empty if the script feeding sample data has already terminated a while ago.
Do not select Real Time (streaming) because it does not allow grouping.
-
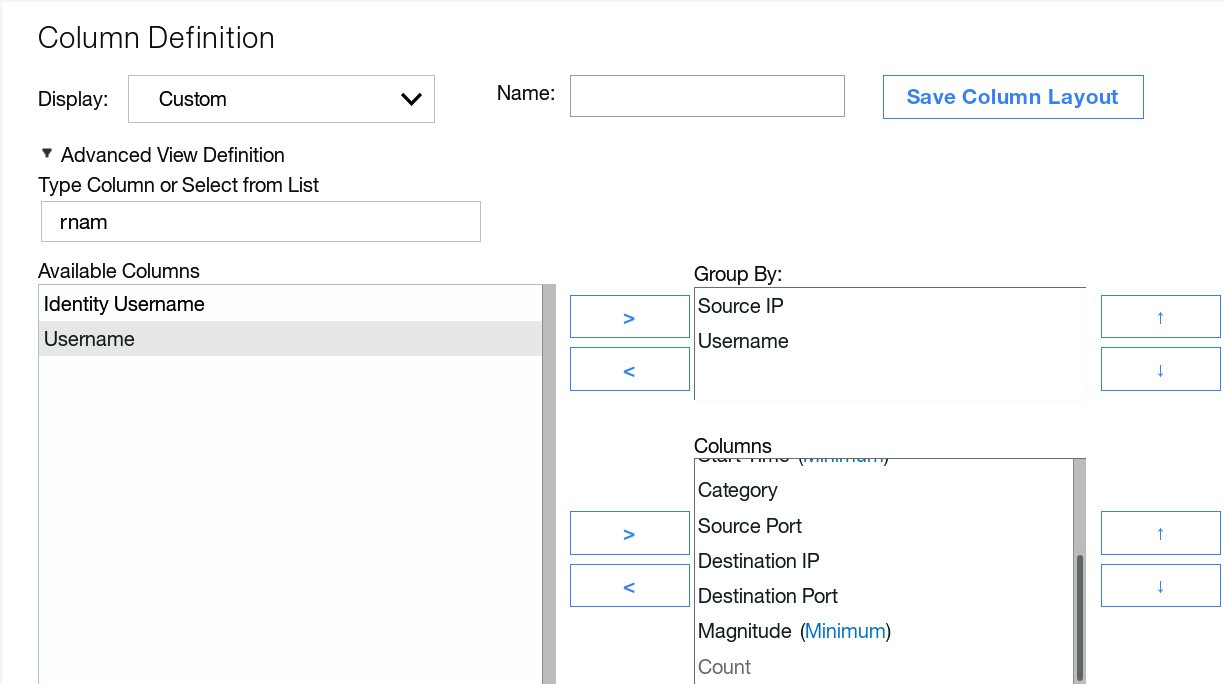
Scroll down to the Column Definition section and perform the following steps:
a. From the Columns list, remove the following two properties:
- Source IP
- Username
b. From the Available Columns list, add the same properties to the Group By list.
-
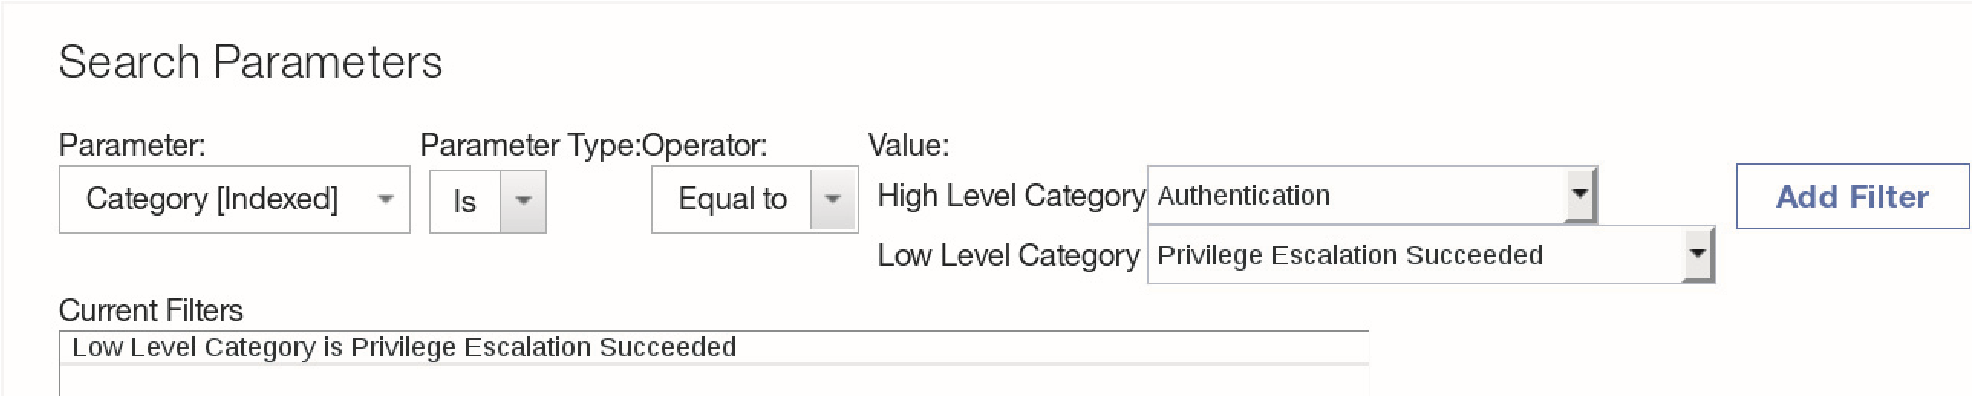
Scroll down to the Search Parameters section and perform the following steps:
a. For Parameter, select Category [Indexed].
b. For Parameter Type, select Is.
c. For Operator, select Equal to.
d. For High Level Category, select Authentication.
e. For Low Level Category, select Privilege Escalation Succeeded.Click Add Filter.
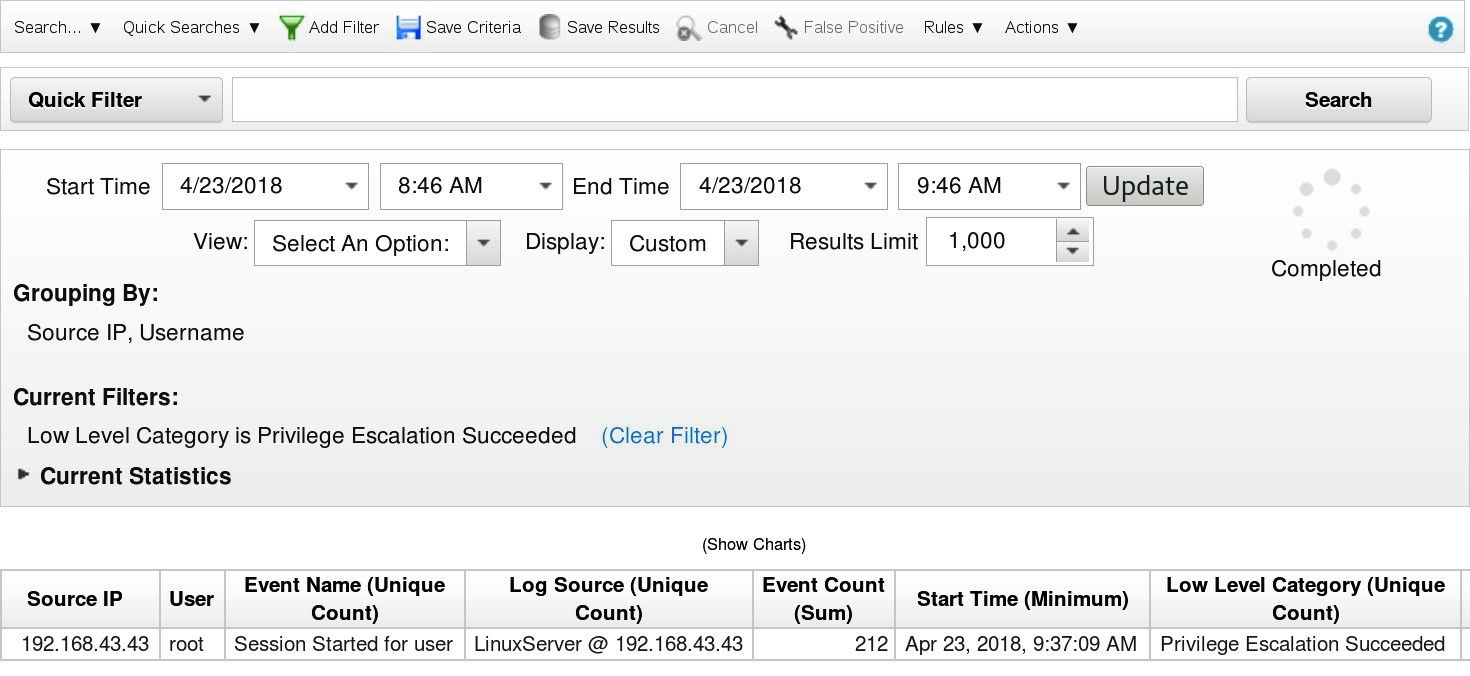
- To run the new search, click on the Search button.
As a result, the Log Activity tab displays the search result.
- To save the new search, click Save Criteria in the toolbar.
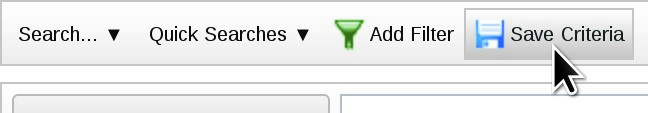
As a result, the Save Criteria window opens.
- In the Save Criteria window, perform the following steps:
a. For Search Name, enter Exercise: PrivEsc by Source IP and Username
Best practice is to enter names that describe what a search does. However, for this lab, you can enter a shorter search name because the name is not used anywhere.
b. Not required for this exercise but useful in case you need to locate your search easily, select Include in my Quick Searches.
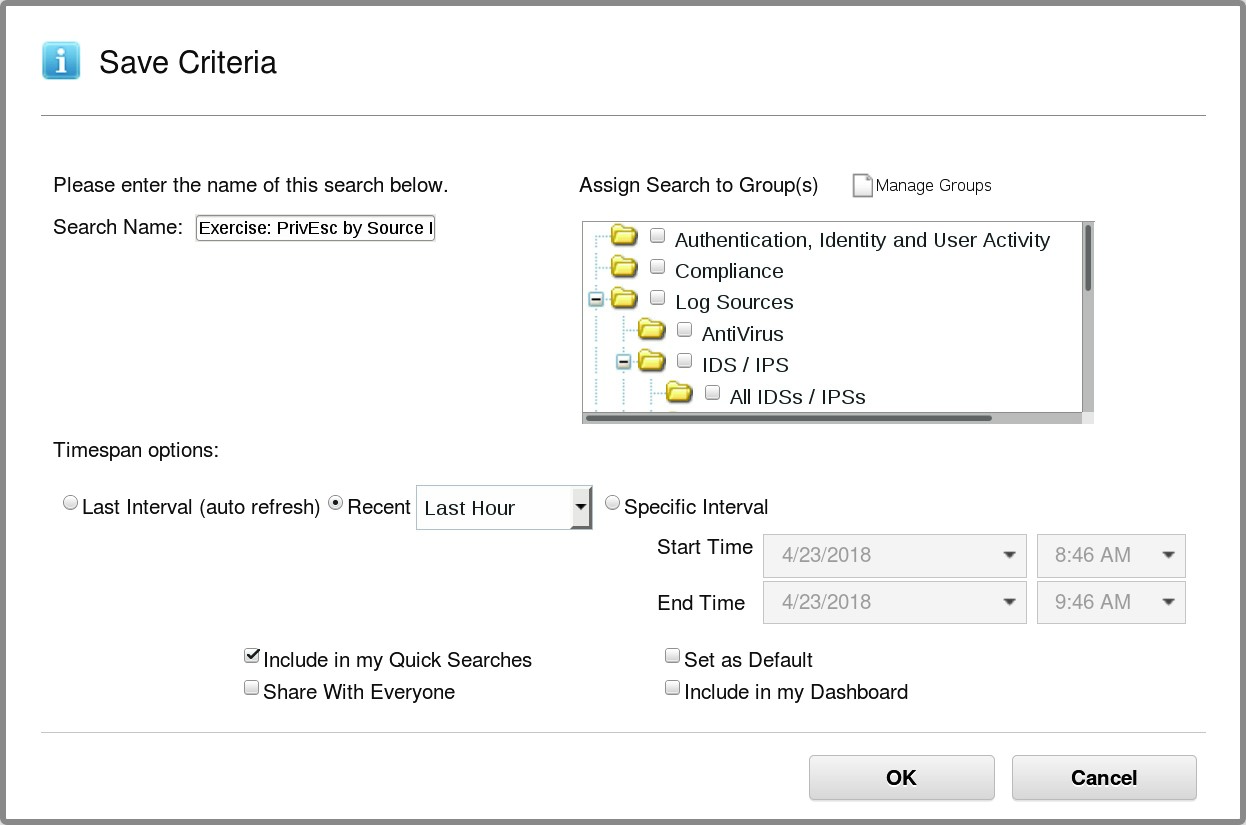
c. To save the search criteria, click OK.
As a result, the Save Criteria window closes, and the Search Saved window opens.
d. Click OK.
As a result, the Search Saved window closes.
Creating an anomaly rule
In this exercise, you create the anomaly rule and configure its tests and rule response.
Stopping to feed sample data
After creating an anomaly rule in this exercise, you will verify it in the next exercise. The verification needs to start from a clean slate. Therefore, stop feeding sample data to QRadar SIEM because the tests of the new anomaly rule immediately match sample data once the rule is created. To terminate the script, that feeds sample data, perform the following steps:
-
Bring the terminal window to the front.
The terminal window displays the output of script that feeds sample data to QRadar SIEM.
-
Confirm that the script has finished. If it has not, type control-c (or Ctrl-c depending on your keyboard)
-
Do not close the terminal window.
Starting the Rule Wizard
To start creating an anomaly rules, that uses the grouped search from the previous exercise, perform the following steps:
-
Bring the browser to the front.
-
In the Log Activity tab, from the Rules drop-down list on the toolbar, select Add Anomaly Rule...
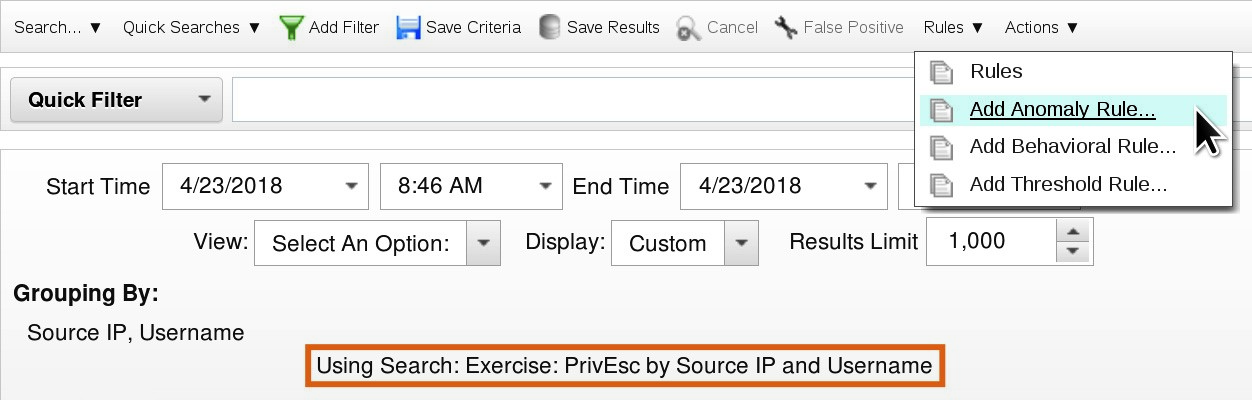
As a result, QRadar opens the Rule Wizard while staying on the Log Activity tab.
If Add Anomaly Rule is greyed out it is because you have not selected a query.
-
At the Rule Wizard welcome page, read the introductory text and select Skip this page when running this rules wizard.
-
To navigate to the Rule Test Stack Editor, click Next twice.
If you are not able to click the Next link to advance to the next page in the wizard, try using the Firefox browser. This may be broken in Chrome.
Task 3 Configuring test parameters
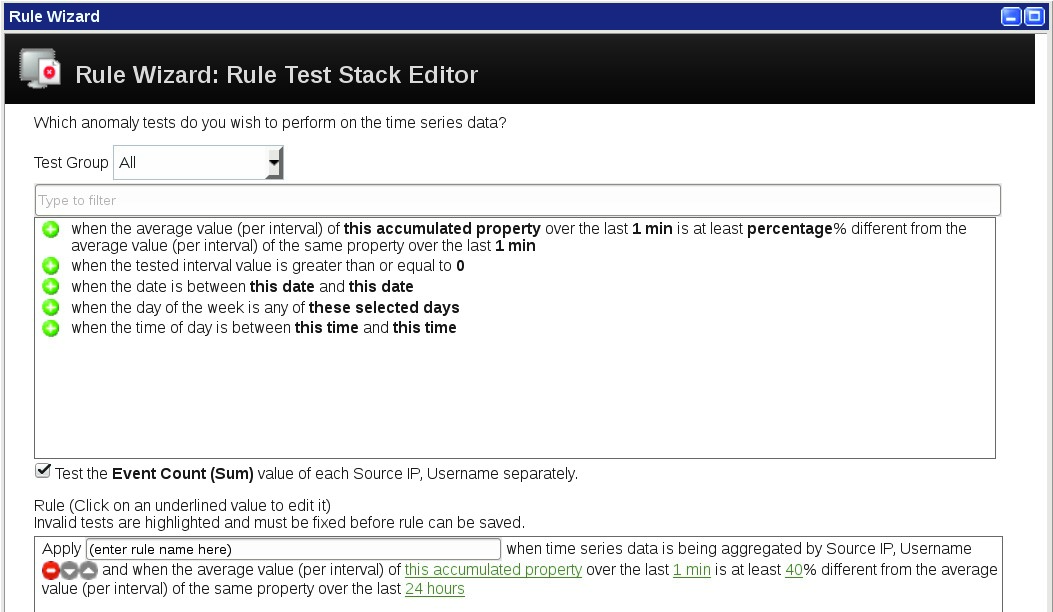
The Rule Test Stack Editor has already automatically added the test that is essential for an anomaly rule. To configure the test parameters, perform the following steps:
-
To open a window to select the property for which you want to compute interval averages, click the [this accumulated property] parameter.
-
In the window, select the Event Count (Sum) accumulated property.
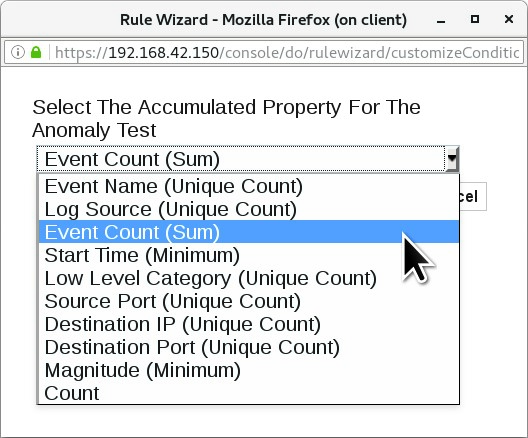
- To add the accumulated property to the test, click Submit.
The window closes.
-
The second parameter is [1 min]. It configures the interval length. Leave the parameter unchanged.
-
The third parameter is [40]%. It configures above which deviation of the current interval from the weighted moving average of the previous intervals the test evaluates to true. Leave the parameter unchanged.
-
The last parameter of the test configures, for which time range the Anomaly Detection Engine computes the weighted moving average in intervals.
The Rule Test Stack Editor has automatically selected [24 hours] for the last parameter. To open a window to select another time frame, click the parameter.
- In the window, select the 5 mins time frame.
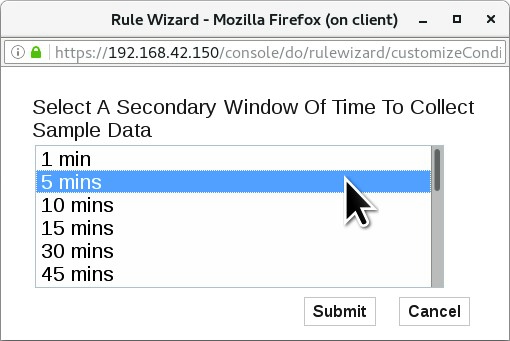
- To update the parameter, click Submit.
The window closes.
- Verify that your Rule Test Stack Editor looks like the following screen capture.

Hint: In real-world IT environments, probably an unusual number of privilege escalations occur at certain times legitimately, for example when automated operational processes run. Therefore, add time tests to only run an anomaly detection rule at times when a deviation from a weighted moving average indicates a concern.
Providing a minimum value for each interval
Typically statistical tests lead only to helpful results when a minimum of relevant events or flows arrives per interval. For anomaly detection rules in your environment, the minimums are probably in the hundreds or thousands. This example needs to work with a relatively small number of sample events. Therefore, perform the following steps to require a minimum of 8 events per interval:
- Click the green plus (+) icon next to the following test:
when the tested interval value is greater than or equal 0
-
To open a window to enter a number as the minimum, click the [0] parameter.
-
In the window, for Provide A Minimum Value For Each Interval, replace the 0 by 8
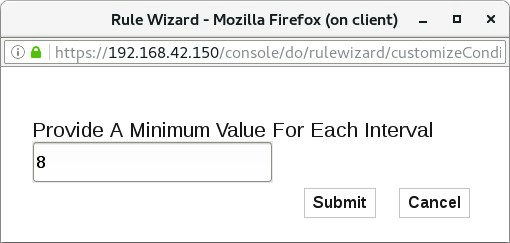
- To configure the minimum test, click Submit.
The window closes.
Configuring the Anomaly Rule
Typically statistical tests lead only to helpful results when a minimum of relevant events or flows arrives per interval. For anomaly detection rules in your environment, the minimums are probably in the hundreds or thousands. This example needs to work with a relatively small number of sample events. Therefore, perform the following steps to require a minimum of 8 events per interval:
-
Scroll down to see all related fields for this task more clearly.
-
For the rule name in the Apply field, enter the following name:
Exercise-Authentication: Unusual Privilege Escalationsbash
Note: This exercise uses the prefix Exercise- to distinguish the predefined rules from your own development.
-
To assign the custom rule to the Exercise group, scroll down in the list of groups and select Exercise.
-
To document the custom rule in the Notes field, enter the following text:
This rule triggers when privilege escalations deviate considerably from their weighted moving average.bash
-
To confirm the input, press Enter.
-
Verify that your Rule Wizard looks like the following screen capture.
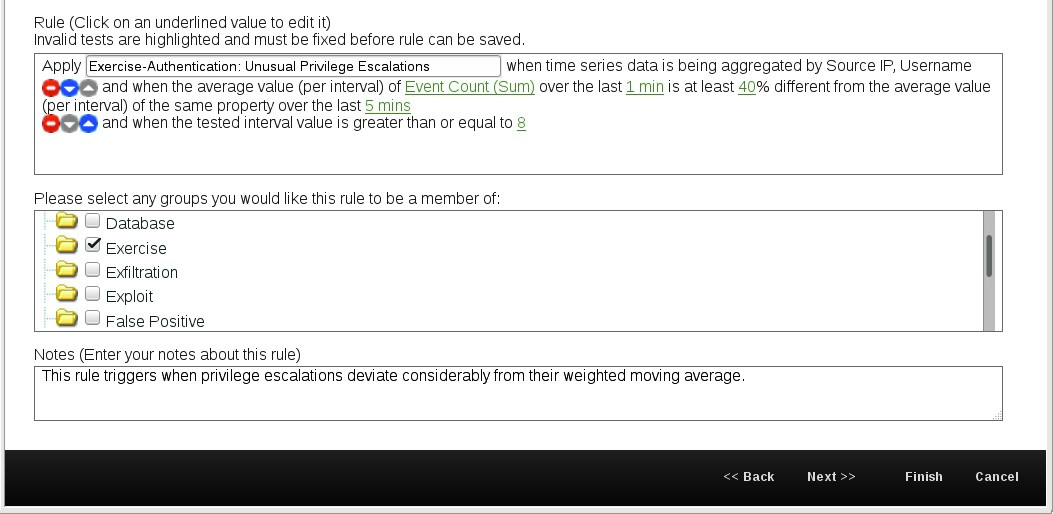
Note: When you need to locate all anomaly detection rules and custom rules that you have developed, navigate to Rules on the Offenses tab, select Rules in the Display drop-down list, and then select Exercise in the Group drop-down list.
Observing rule responses
To have an offense created for the unusual privilege escalations that the anomaly detection rule tests for, perform the following steps:
-
To navigate to the Rule Response, click Next.
-
The Rule Wizard has already prepared the Rule Response. For this example, do not make any changes.
-
To observe that the offense can only be indexed on Event Name, open the Index offense based on drop-down list.
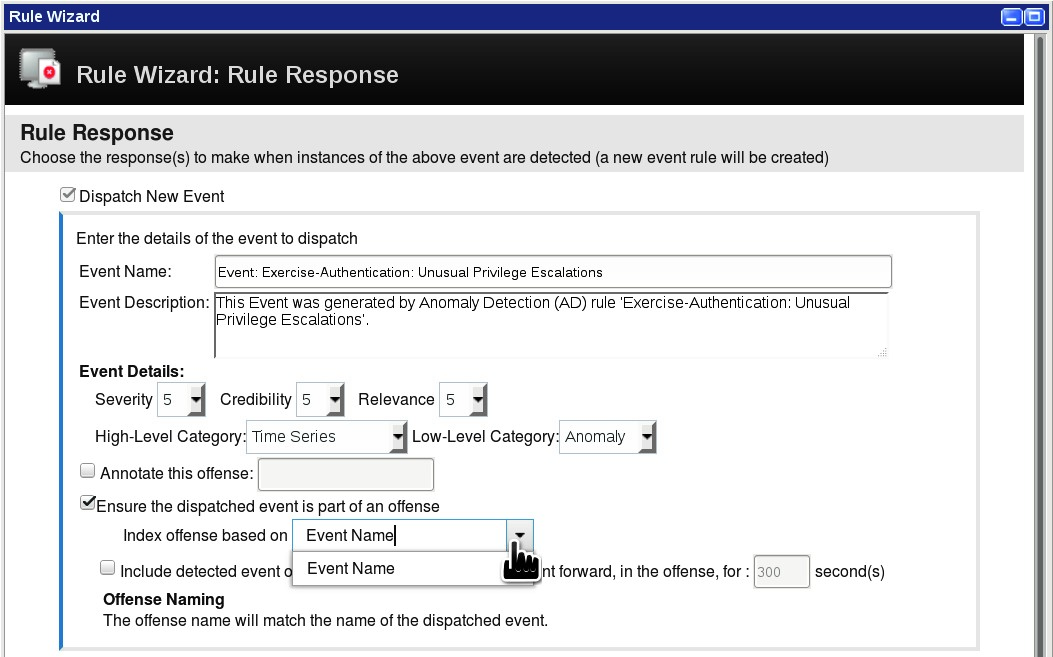
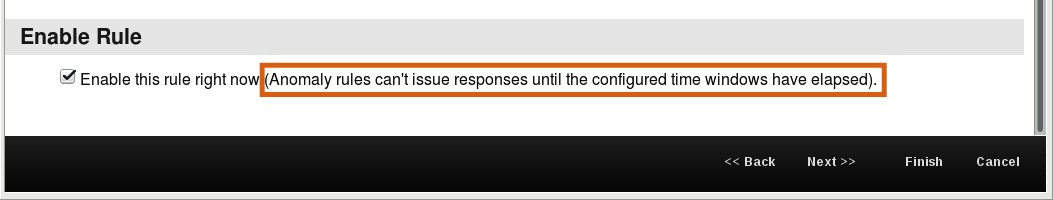
- Scroll down to the Enable Rule section. Do not change anything. Read the important hint next to the checkbox.
-
To navigate to the Rule Summary, click Next.
-
To create the rule, click Finish.
The Rule Wizard closes.
Verifying the Anomaly Rule
In this exercise, you verify whether your development creates an offense.
Feeding sample data to QRadar SIEM
To execute the script, that feeds sample data, perform the following steps:
- Bring the terminal window to the front.
The terminal window still displays the output from running the script previously.
- To feed repeatedly the prepared syslog message to QRadar, run the following command:
./sendSpike.shbash
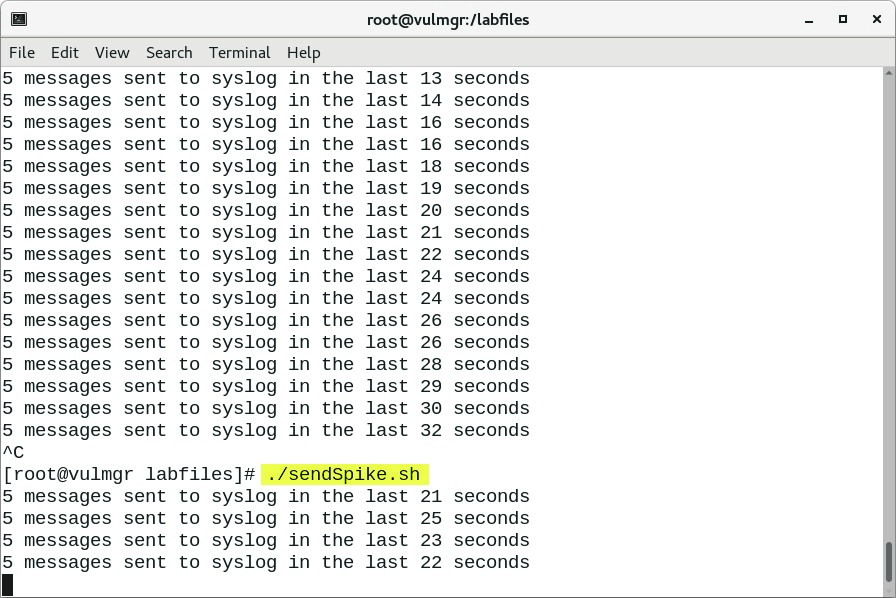
- Leave script to run and switch back to the browser. Do not close the terminal window.
Observing the offense
The script feeds events to QRadar SIEM, that match your anomaly rule. For the first five minutes, the rate of events increases to a spike. After the spike, the rate decreases mirroring the rate of the increase in the first five minutes.
The average of the interval with the spike deviates by a higher percentage than configured in the anomaly rule from the weighted moving average. Therefore, QRadar SIEM creates an offense after the script has run for about six minutes. To observe the offense, perform the following steps:
-
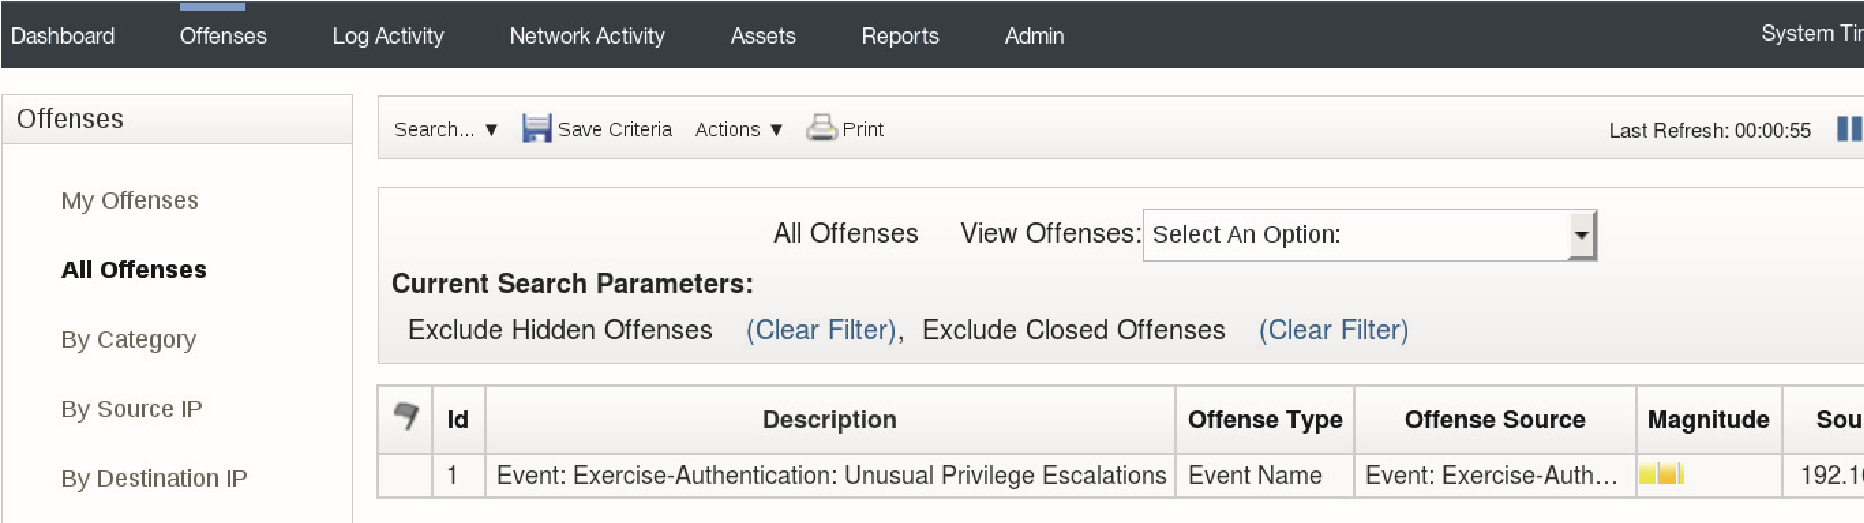
Navigate to the Offenses tab.
-
To refresh the listed offenses, double-click the Offenses tab. The double-click refreshes and resets the tab to its default settings.
Note: In this case, you can accomplish the same goal, if you click the double arrow icon in the upper-right corner of the QRadar SIEM user interface. However it is disabled for this simulation.
- When the new offense appears, double-click it.
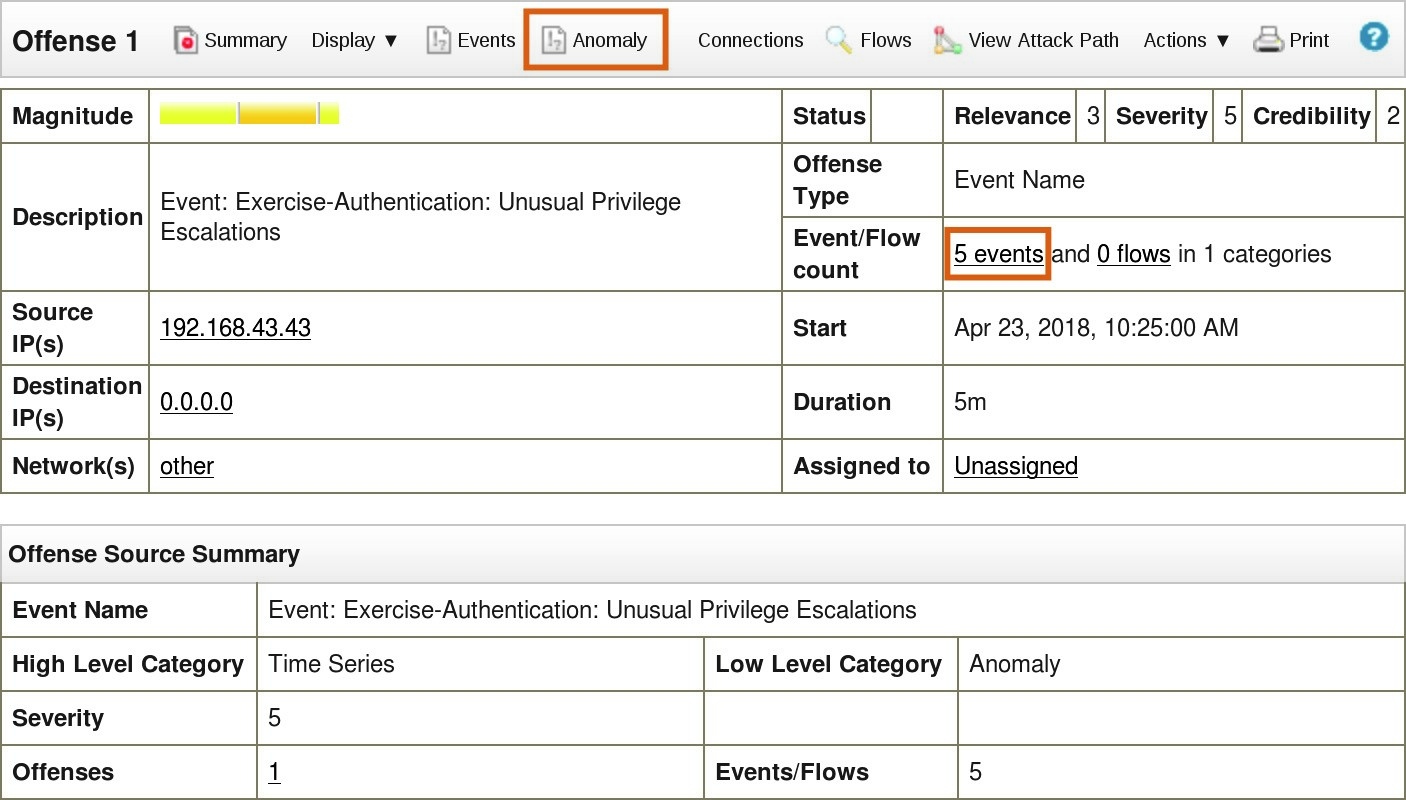
The Offense Summary opens.
-
Optionally, click Anomaly in the toolbar.
A separate window opens with the results of the search that your anomaly rule uses.
-
Review the search result and close the browser window to get back to the main window of the QRadar console.
-
In the Event/Flow count field, click 5 events. The number of events can differ.
A separate window opens with the events that the anomaly rule dispatched as Rule Response.
-
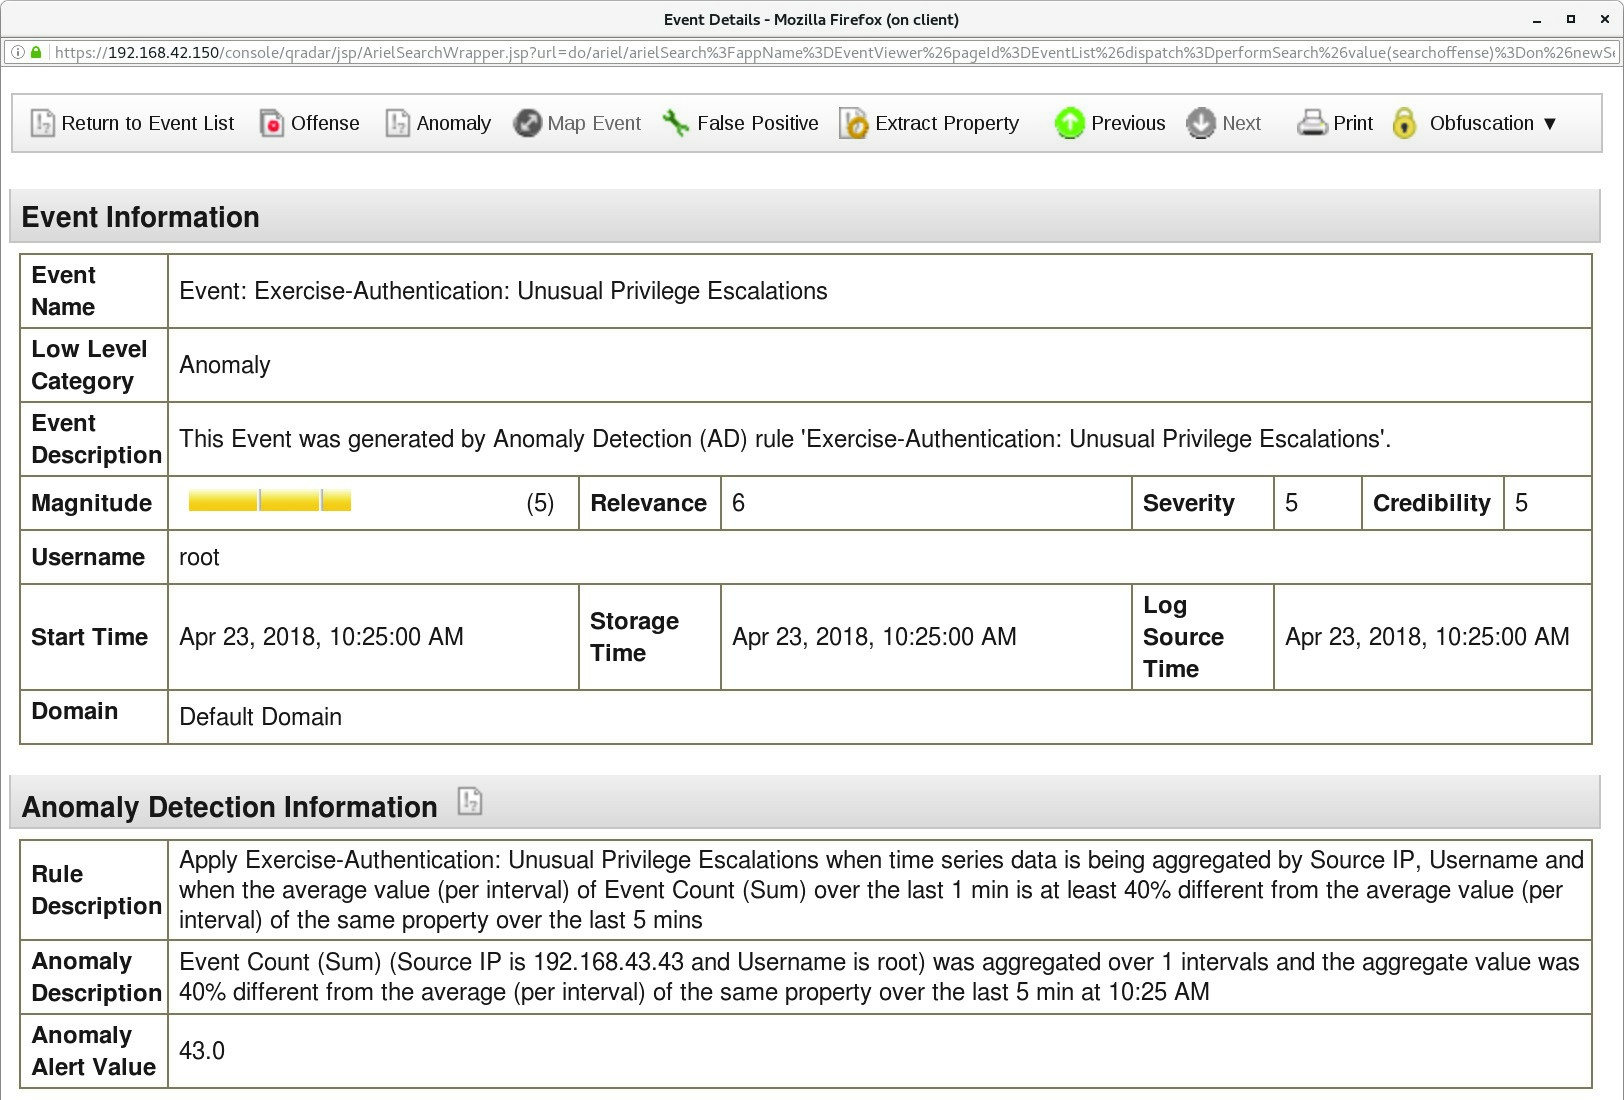
To open the Event Details, scroll down and double-click on the event.
-
Observe the Anomaly Detection Information section. It only appears for events that anomaly detection rules dispatch as a Rule Response.
Summary
You have successfully completed this lab by creating and verifing an anomaly rule in QRadar.