105: Validating and monitoring models
Over the course of this lab, you have used Watson Studio to work with data from multiple sources, in multiple formats. You have built a variety of models, using full-code, low-code, and no-code methods. You have seen how Watson Studio automatically records and makes model lifecycle information accessible. In this last step, you will see how models can be validated and monitored in production.
1. Configure OpenScale monitoring
Heads up! Parts of this section will be on the quiz.
- Navigate to Watson Trust (OpenScale).

If this is your first time using OpenScale, the tool will offer to let you run an auto-setup utility. While this does take several minutes to run, it is highly recommended that you do so, as it will create a datamart and associate your machine learning services. Manual configuration of OpenScale is beyond the scope of this lab. Select Auto setup to perform the automated configuration.
When it is finished, click the blue Let's go button. A guided tour of OpenScale will begin. You can take the tour to learn about OpenScale, or close the prompts and continue.

If you have done the Data fabric demo or have worked with other OpenScale services, you may not be signed into the correct OpenScale instance. Verify that you are have the correct instance selected by clicking the avatar icon (likely your initials) in the top right corner of the screen, and then selecting an instance from the Account dropdown for which you have Administrator permissions.

- Click on the Configure icon on the left.
- From the Required list on the left, click on Machine learning providers. If the deployment space you used to deploy your model is already listed as a pre-production machine learning provider, you can skip ahead to step 9.
- Click on the blue Add machine learning provider button on the right to add a deployment space as a machine learning provider for OpenScale.

- Click on the Edit (pencil) icon above New provider to give your provider a name; for example, attrition pre-production, then click on the blue Apply button.

- Click on the Edit icon beside the Connection tile on the right. The Connection configuration screen opens.

- Select Watson Machine Learning from the Service provider dropdown. Select the deployment space you used to deploy your models from the Deployment space dropdown. Ensure that the Environment type is set to the Pre-production radio button, which will allow you to do validation tests on your models instead of setting up a continuous data feed.
- Click on the blue Save button on the bottom right.
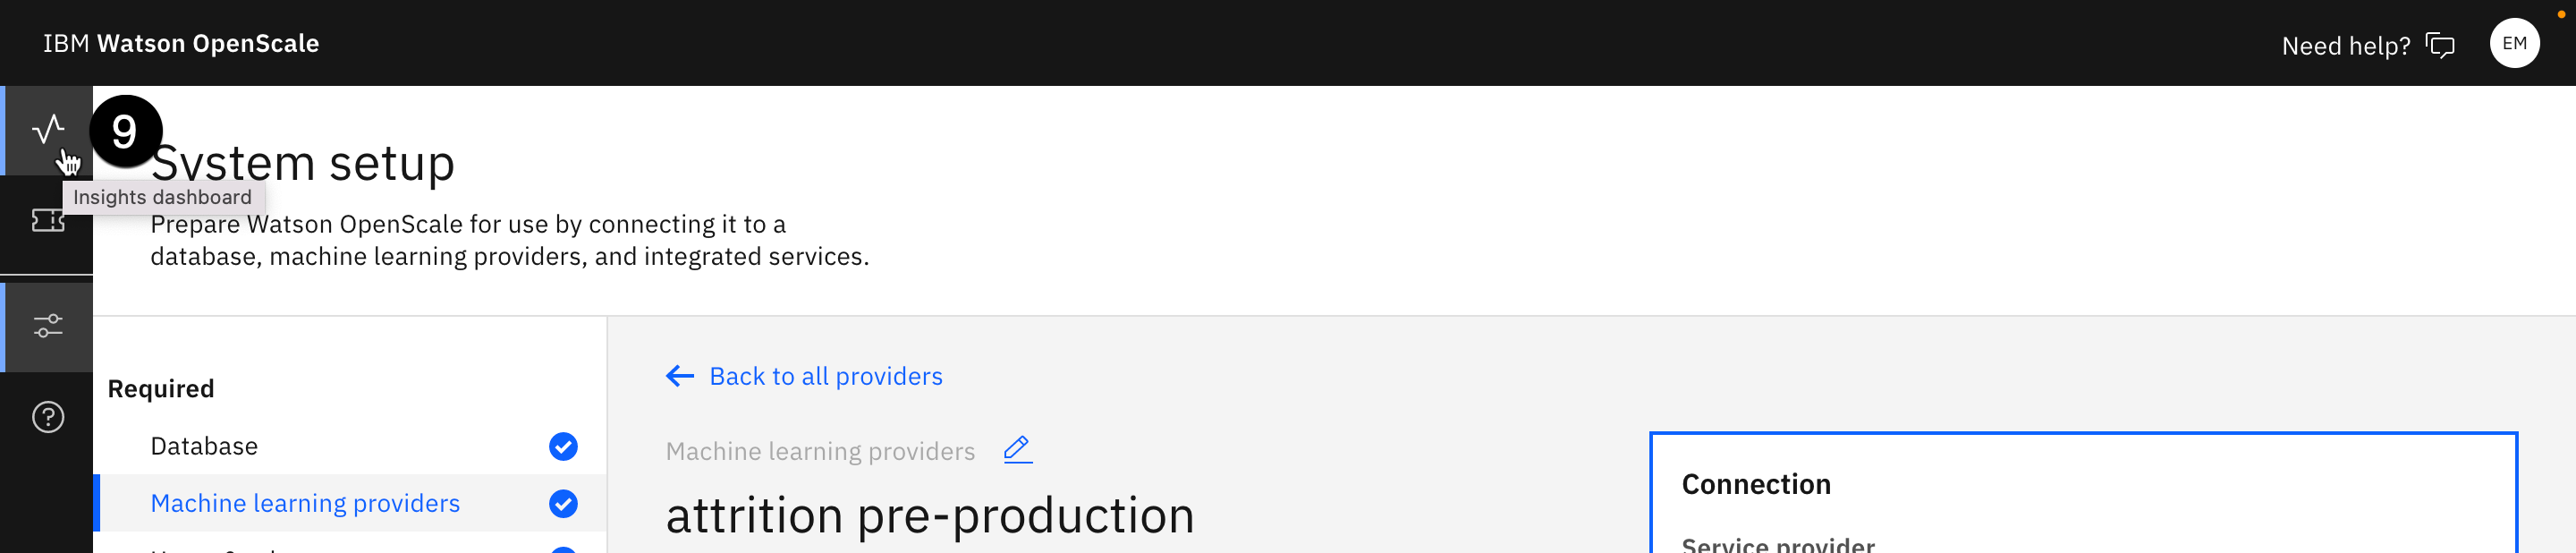
- Click the Insights dashboard icon (which looks like a heartbeat) on the left.
- Click on the blue Add to dashboard button in the top right. The Select a model deployment screen opens.
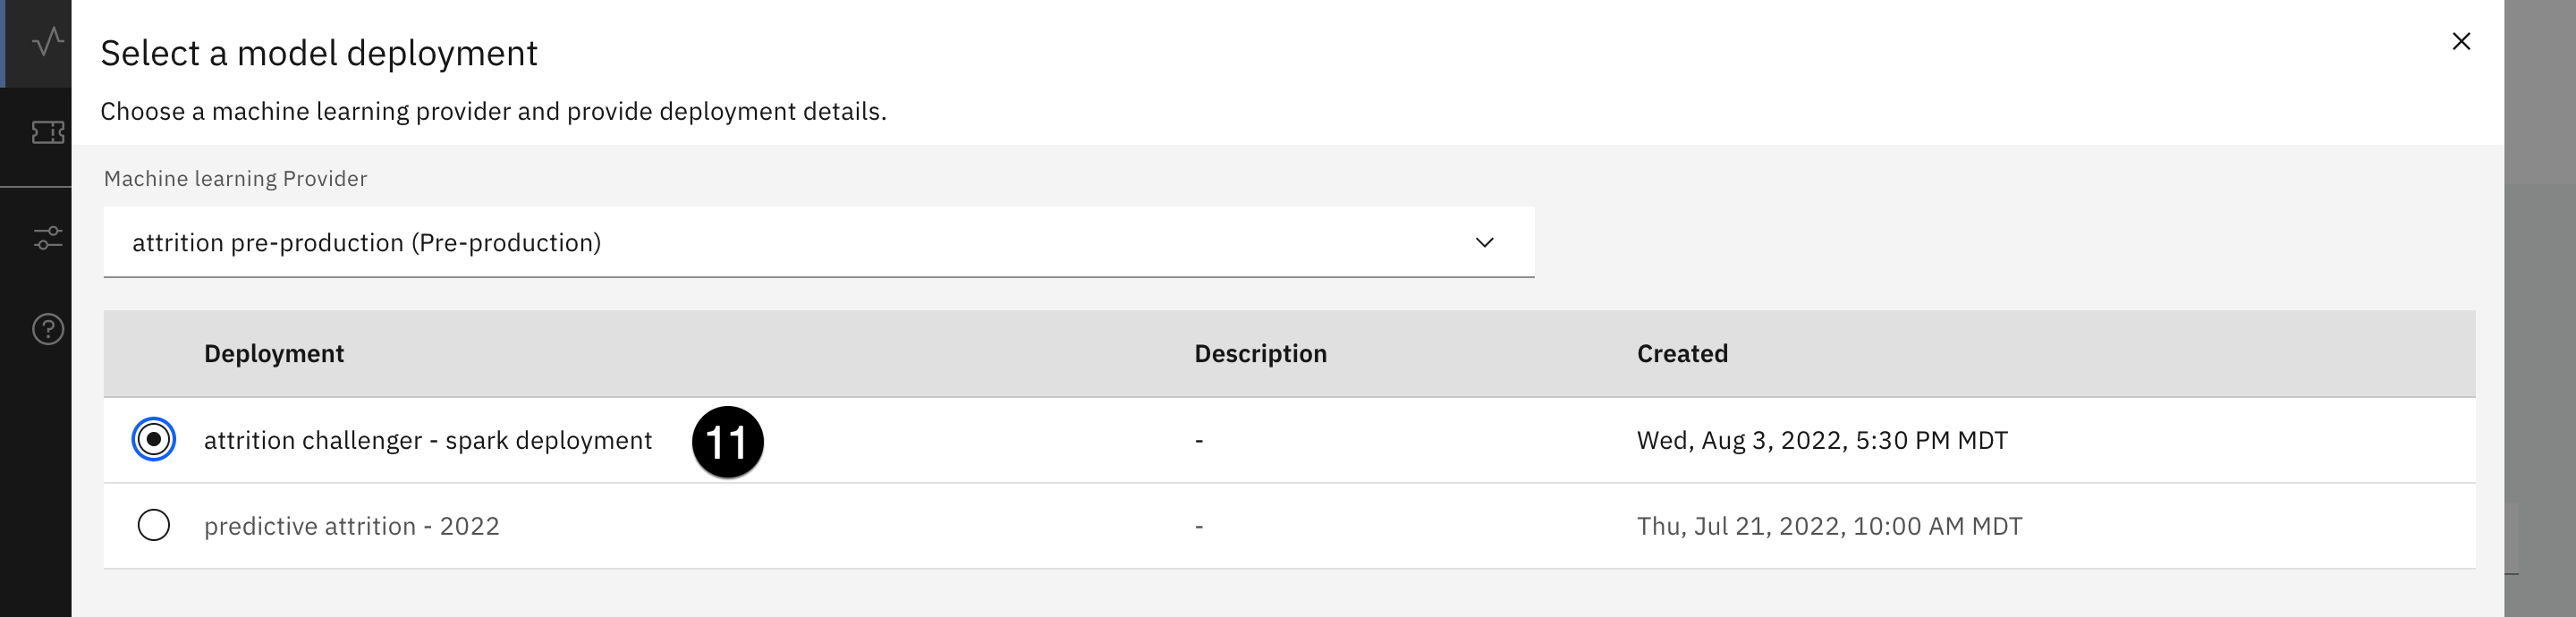
- Use the Machine learning provider dropdown to select the provider you just added. The deployment table will populate. Select the radio button associated with the Spark model you deployed in the Deploying models and functions section of this lab, and click on the blue Configure button at the bottom right.
- Click the blue Configure monitors on the bottom right to set up the OpenScale monitors. Note that this configuration can be done via Python in a Jupyter notebook as well.

- From the Model details screen, click on the Edit (pencil) icon on the Model input tile.
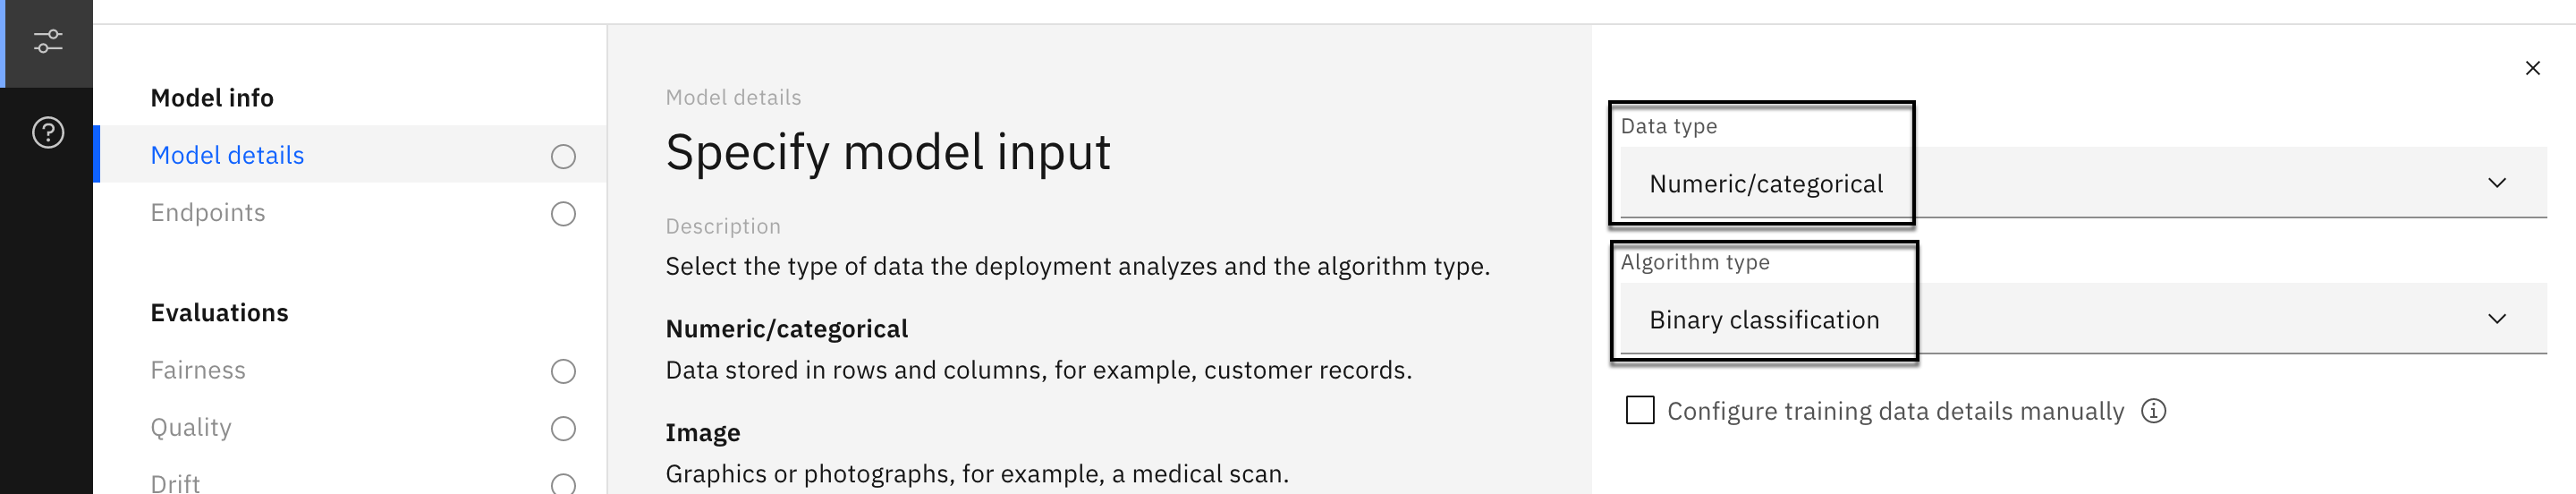
- Select Numeric/categorical from the Data type dropdown. Select Binary classification from the Algorithm type dropdown. Click on the blue Save and continue button at the bottom.
- From the Model details screen, click on the Edit (pencil) icon on the Training data tile.
- From the Location dropdown, select Cloud Object Storage. For the Resource instance ID field that appears, copy and paste the supplied values for resource ID:
crn:v1:bluemix:public:cloud-object-storage:global:a/7d8b3c34272c0980d973d3e40be9e9d2:2883ef10-23f1-4592-8582-2f2ef4973639::txt
For the API key value it will be supplied to you if you are completing the lab in-person

- Click on the Connect button below the API key field. Once the connection to the object storage service has been made, use the Bucket dropdown to select faststartlab-donotdelete-pr... The Data set dropdown will appear. Use it to select modeling_records_2022.csv, then click on Next.

- ATTRITION should already be selected as the only choice for the label column on the right. If not, select it and click on Next.
- On the Select the training features screen, all of the features have been selected by default. Click Next in the bottom right.
- Use the Scoring method dropdown to select the JSON payload option. Remove all text from the textbox that appears, and replace it with the code below:
[
{
"request": {
"fields": [
"POSITION_CODE",
"DEPARTMENT_CODE",
"DAYS_WITH_COMPANY",
"COMMUTE_TIME",
"AGE_BEGIN_PERIOD",
"GENDER_CODE",
"PERIOD_TOTAL_DAYS",
"STARTING_SALARY",
"ENDING_SALARY",
"NB_INCREASES",
"BONUS",
"NB_BONUS",
"VACATION_DAYS_TAKEN",
"SICK_DAYS_TAKEN",
"PROMOTIONS",
"NB_MANAGERS",
"DAYS_IN_POSITION",
"DAYS_SINCE_LAST_RAISE",
"RANKING_CODE",
"OVERTIME",
"DBLOVERTIME",
"TRAVEL"
],
"values": [
[
5400.0, 390.0, 1363.0, 28.0, 42.0, 0.0, 330.0, 67653.85, 71230.77, 1.0, 2849.2308, 1.0,
29.0, 9.0, 0.0, 1.0, 1363.0, 270.0, 3.0, 0.0, 0.0, 0.0
],
[
2600.0, 320.0, 2687.0, 0.0, 35.0, 1.0, 330.0, 31692.31, 33307.69, 1.0, 1267.6924, 1.0,
15.0, 11.0, 0.0, 1.0, 2687.0, 120.0, 3.0, 255.9375, 71.7609375, 0.0
]
]
},
"response": {
"fields": [
"POSITION_CODE",
"DEPARTMENT_CODE",
"DAYS_WITH_COMPANY",
"COMMUTE_TIME",
"AGE_BEGIN_PERIOD",
"GENDER_CODE",
"PERIOD_TOTAL_DAYS",
"STARTING_SALARY",
"ENDING_SALARY",
"NB_INCREASES",
"BONUS",
"NB_BONUS",
"VACATION_DAYS_TAKEN",
"SICK_DAYS_TAKEN",
"PROMOTIONS",
"NB_MANAGERS",
"DAYS_IN_POSITION",
"DAYS_SINCE_LAST_RAISE",
"RANKING_CODE",
"OVERTIME",
"DBLOVERTIME",
"TRAVEL",
"features",
"rawPrediction",
"probability",
"prediction"
],
"values": [
[
5400.0,
390.0,
1363.0,
28.0,
42.0,
0.0,
330.0,
67653.85,
71230.77,
1.0,
2849.2308,
1.0,
29.0,
9.0,
0.0,
1.0,
1363.0,
270.0,
3.0,
0.0,
0.0,
0.0,
[
5400.0, 390.0, 1363.0, 28.0, 42.0, 0.0, 330.0, 67653.85, 71230.77, 1.0, 2849.2308, 1.0,
29.0, 9.0, 0.0, 1.0, 1363.0, 270.0, 3.0, 0.0, 0.0, 0.0
],
[1.499764255005011, -1.499764255005011],
[0.9525528219338582, 0.04744717806614185],
0.0
],
[
2600.0,
320.0,
2687.0,
0.0,
35.0,
1.0,
330.0,
31692.31,
33307.69,
1.0,
1267.6924,
1.0,
15.0,
11.0,
0.0,
1.0,
2687.0,
120.0,
3.0,
255.9375,
71.7609375,
0.0,
[
2600.0, 320.0, 2687.0, 0.0, 35.0, 1.0, 330.0, 31692.31, 33307.69, 1.0, 1267.6924, 1.0,
15.0, 11.0, 0.0, 1.0, 2687.0, 120.0, 3.0, 255.9375, 71.7609375, 0.0
],
[-1.5153949701647946, 1.5153949701647946],
[0.0460541100395183, 0.9539458899604817],
1.0
]
]
}
}
]
json- Click on the Send now button below the textbox. Once the scoring request is successful, click on Next.

- The prediction and probability fields have been correctly identified, so click on Save.

- When the model finishes saving, you will be returned to the Model details screen, and can start configuring monitors. First, click on the Drift monitor under the list of Evaluations on the left. OpenScale can train the drift monitor using the training data you provided a connection to in an earlier step.
- Click on the Edit icon on the Drift model tile on the right. Select the Train in Watson OpenScale radio button, and click on Next. OpenScale will train a separate drift model that compares model inputs to the training data, and predicts model accuracy. For example, if the data submitted to the model is similar to training data that the model struggles to accurately predict, then OpenScale's drift model can warn of potential accuracy issues in real time. The drift model can be automatically trained by OpenScale if it has access to the training data, or manually trained by a user with notebook code provided in the link on the configuration screen.
- Leave the alert thresholds set as they are, and click on Next again.
- Set the Minimum sample size to 100 and click on Save. OpenScale begins training the drift model in the background as you configure other monitors. In a real world scenario, you would leave these minimum sample at their default values or even raise them. However, for the purposes of this lab, lowering them will allow you to see results from the model monitoring more easily.
- Click on the Quality monitor from the list of Evaluations on the left, then click on the Edit icon on the Quality thresholds tile on the right.
- Note the wide variety of quality metrics provided by OpenScale, and that each one can be configured with a different alert threshold. For now, leave them all set at 0.8 and click on Next.
- Once again, set the Minimum sample size to 100 and click on Save. You are now finished configuring monitors for this model. Note that you did not configure a fairness monitor for this particular model. If you were to deploy the AutoAI hiring model you built in the No-code and low-code solutions section, you could configure OpenScale to monitor fairness for any of the fields included in that model.
2. Evaluate the model
- Click on the Insights dashboard icon (which looks like a heartbeat) on the left to return to the dashboard. You should now see the Spark attrition model listed on the dashboard. If you wish, you could return to the model entry in the catalog, and see that the model has moved from the Deploy bucket to the Validate bucket, as IBM FactSheets tracks the model through its lifecycle.
- Click on the tile for the Spark model. When the evaluations screen loads, you will see that no metrics are available yet. This is because the model has not been evaluated. Click on the blue Actions dropdown at the top and select Evaluate now.

- Use the Import dropdown to select from CSV file.
- Download the evaluation_records.csv file to your machine. You can right-click the link in your browser and select Save as..., or left-click the link to open it in a new window, then right-click on the page and select Save as.... Once the file has been saved, drag and drop it into the window or browse to it in your file system.
- Click on Upload and evaluate. OpenScale will use the "ground truth" data in the supplied file to evaluate the model based on the drift and quality parameters you configured. The evaluation can take several minutes to complete.

- When the evaluation finishes, you can see how your model performed in both the drift and quality metrics. Take a moment to quickly review the scores, and any violations. In the example shown on the screenshot above, one evaluation (Accuracy) passed, and one (Drift) failed. This means that the accuracy score for this model was above the threshold specified when the monitor was configured, and the drift score fell below the threshold specified. Note that due to the random selection of training and test data during model development, your model's scores may differ from those in the screenshots.
3. View the FactSheet
- Return to the Asset tab of the FactSheet entry for your models. You can use the direct URL to open the catalog asset in a different tab.
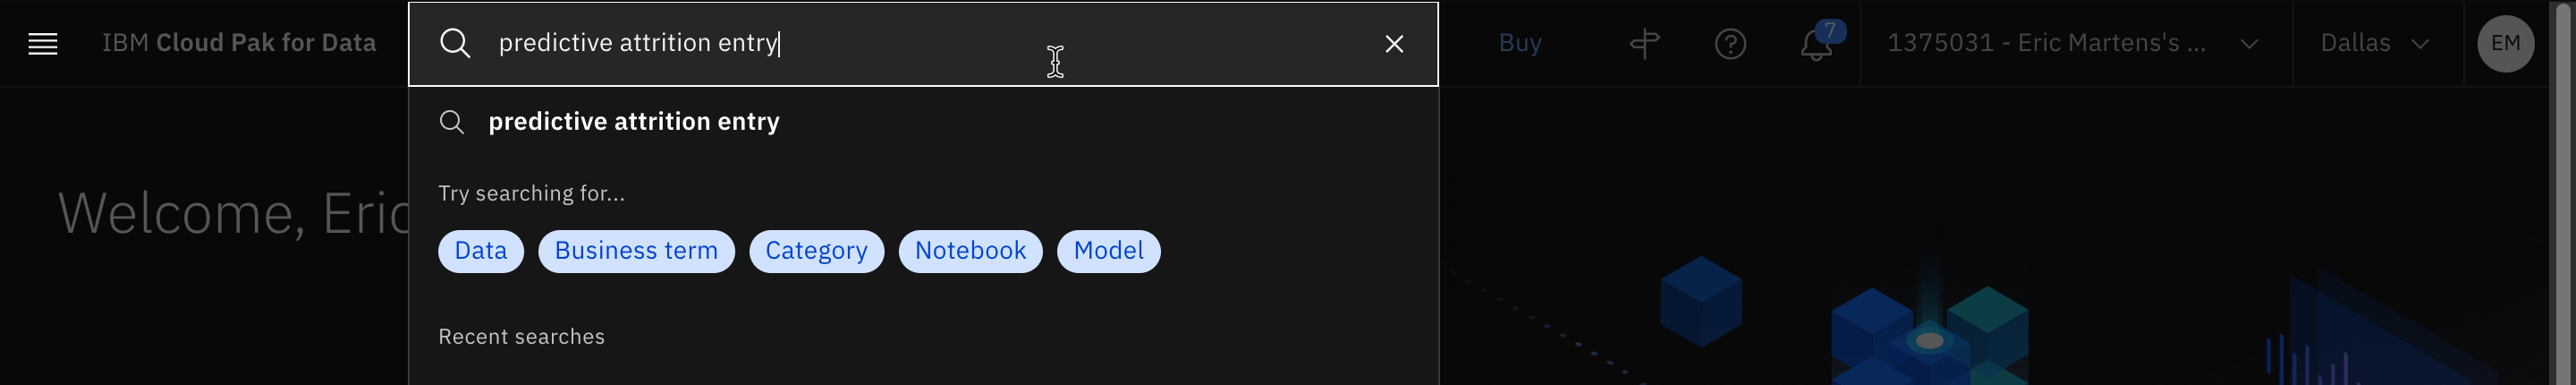
If you do not have the URL, navigate to IBM Cloud Pak for Data, enter the name of the model entry in the search bar at the top of the screen, and press the Enter key.

If necessary, set the Type filter dropdown on the left to Model entry. Select the model entry you created earlier from the list of search results, and click on the Asset tab once it loads.

-
Note that the Spark model has been moved to the Validate bucket on the FactSheet, and that the deployment has been evaluated. Click on the associated link for the deployment.
-
Scroll down to the Evaluation information section. Here you can see the ID of the OpenScale instance used to do the evaluation, the time and date it was performed, and the data set used. Further down the page, you can see the Quality and Drift sections, which show the same evaluation scores as OpenScale. Surfacing this information in the catalog provides an easy, automated, governed method for model validators to get up-to-date information on model performance, which they can use to decide whether or not to put the model into production.
4. Approve the model for production
- Return to the OpenScale Insights dashboard and click on the tile for the Spark model again.

- Click on the blue Actions dropdown.
- Select Approve for production. A modal window will open asking you to confirm your choice. Click on Approve to confirm.

Clean-up
In this lab, you created services, imported a project, imported a notebook, created a catalog, a deployment space, and more. You may want to release these resources if you're not planning to re-use them soon, but keep in mind that the services and other assets are prerequisites for multiple labs.
At a minimum, you should remove the deployments that were created. These deployments are REST API services that are running and using resources. You can always redeploy them when you want to reuse them. Of course, this means that their deployment ids will change and any reference to them need to be updated. Their entries and configurations will be removed from OpenScale, and their deployment evaluation metrics and details will no longer be available on the model FactSheet entry.

-
To remove the deployments, navigate to the list of deployments and select the Spaces tab.
-
Click on the associated link for the deployment space you used.

- Select the Deployments tab.

- From the Deployments table, hover your mouse over one of the rows, click on the button with three vertical dots that appears in the column on the right, and click Delete.
- A confirmation window will open. Click the red Delete button to confirm deletion.
- Repeat steps 4 and 5 to remove any other unwanted deployments. Note that the models you created will still be listed on the Assets tab of the deployment space, and can be redeployed from there if they are needed again.