Creating queries and reports exercises
In these exercises, you create custom queries and reports.
Creating a simple query and report
In this exercise, you create your own Console tab to display your report. Then, you create a simple query and a report that uses that query and places that report on your new reports page. The query that you create returns details of all trusted sessions, that is, sessions open by database users who are members of the Lab Trusted Users group. The query returns Database User Name, Client and Server IP addresses, and Source Program name.
- On the database server, to start the Guardium GUI, double-click the Firefox web browser icon.
- Log in to the Central Manager(MA170) graphical console as user
labadminwith passwordP@ssw0rd.
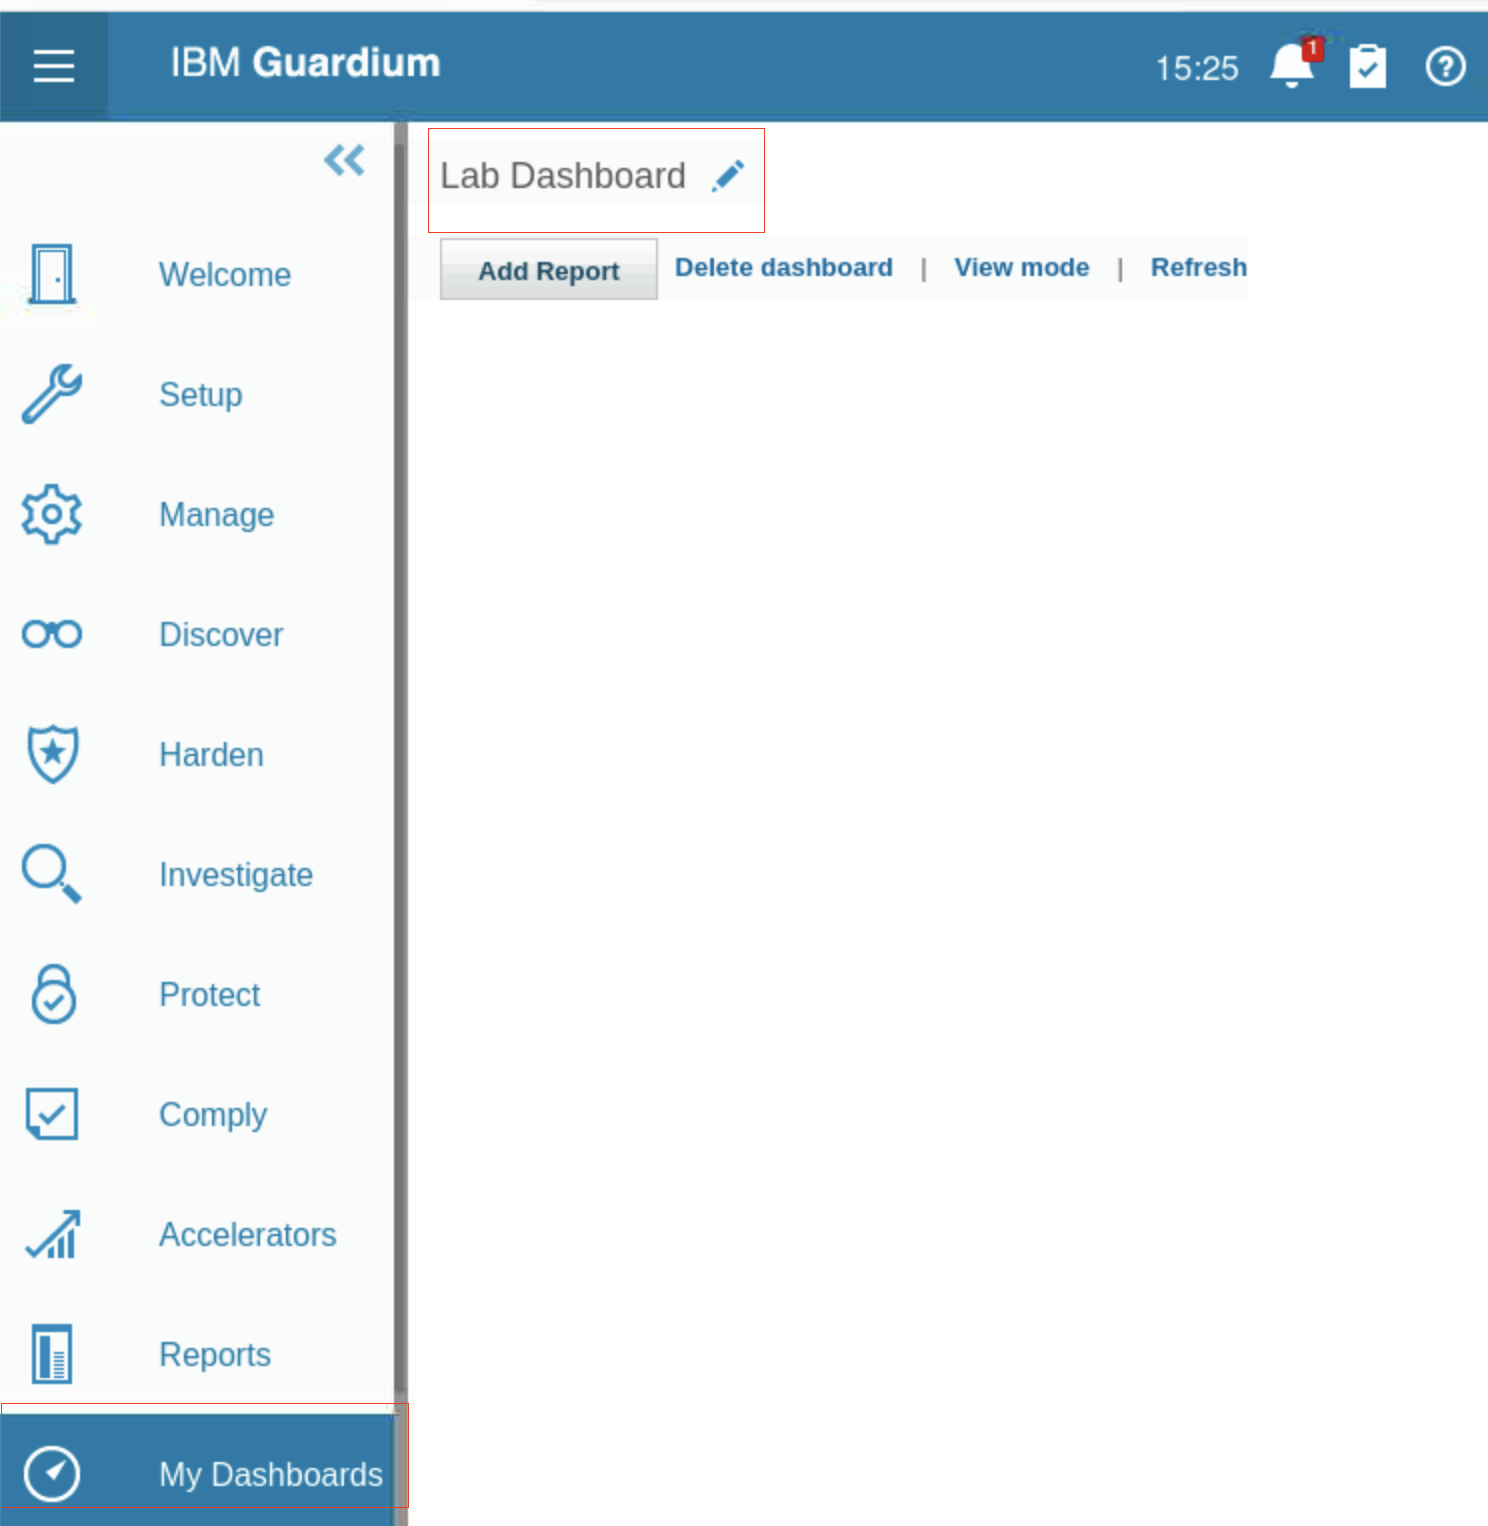
Create a new dashboard for your report
In this task, you create a new dashboard to hold your report.
-
From the left navigation menu, click My Dashboards > Create New Dashboard. The new dashboard opens.
-
To edit the dashboard, click Edit
-
Rename the dashboard to Lab Dashboard, and click Save.
Create a query for the report to use
The query specifies what information is retrieved from the Guardium database and how it is displayed.
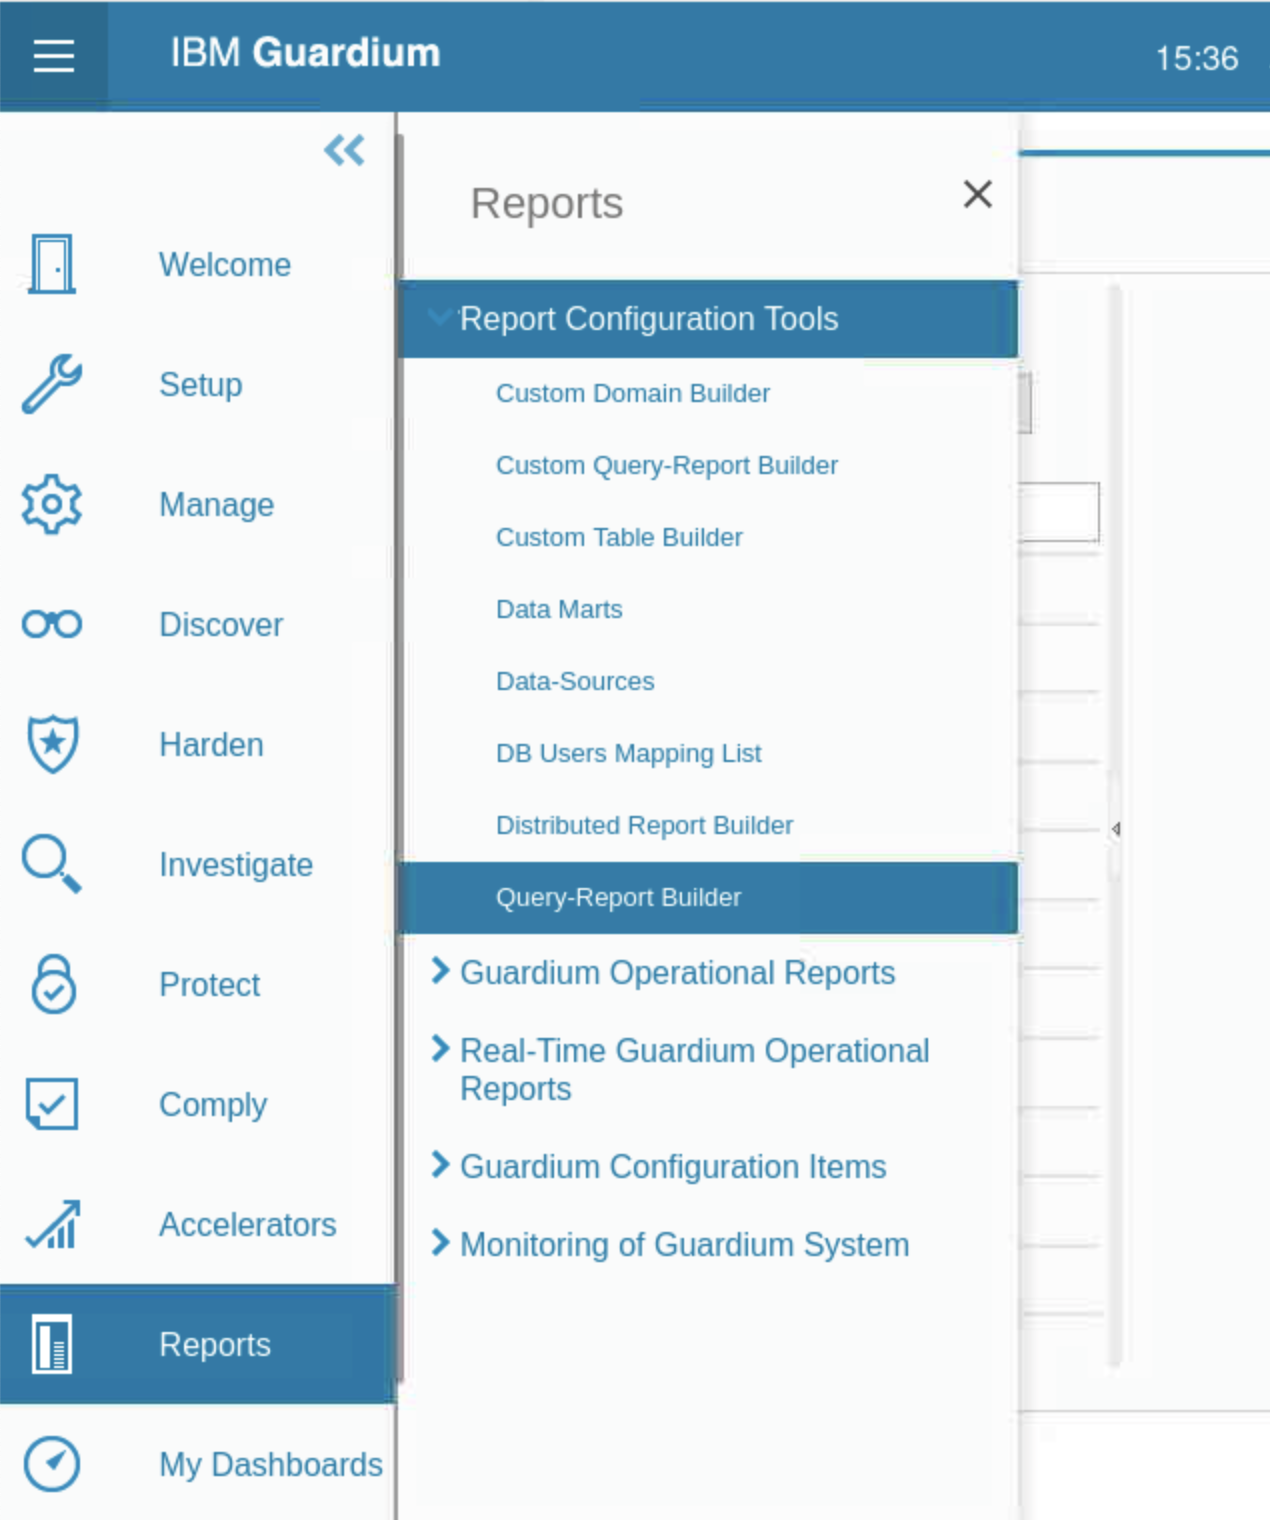
- From the left navigation menu, click Reports > Report Configuration Tools > Query-Report Builder. The Query-Report Builder pane opens.
-
For Domain, select Access. An icon to add a new query and a list of access reports becomes available.
-
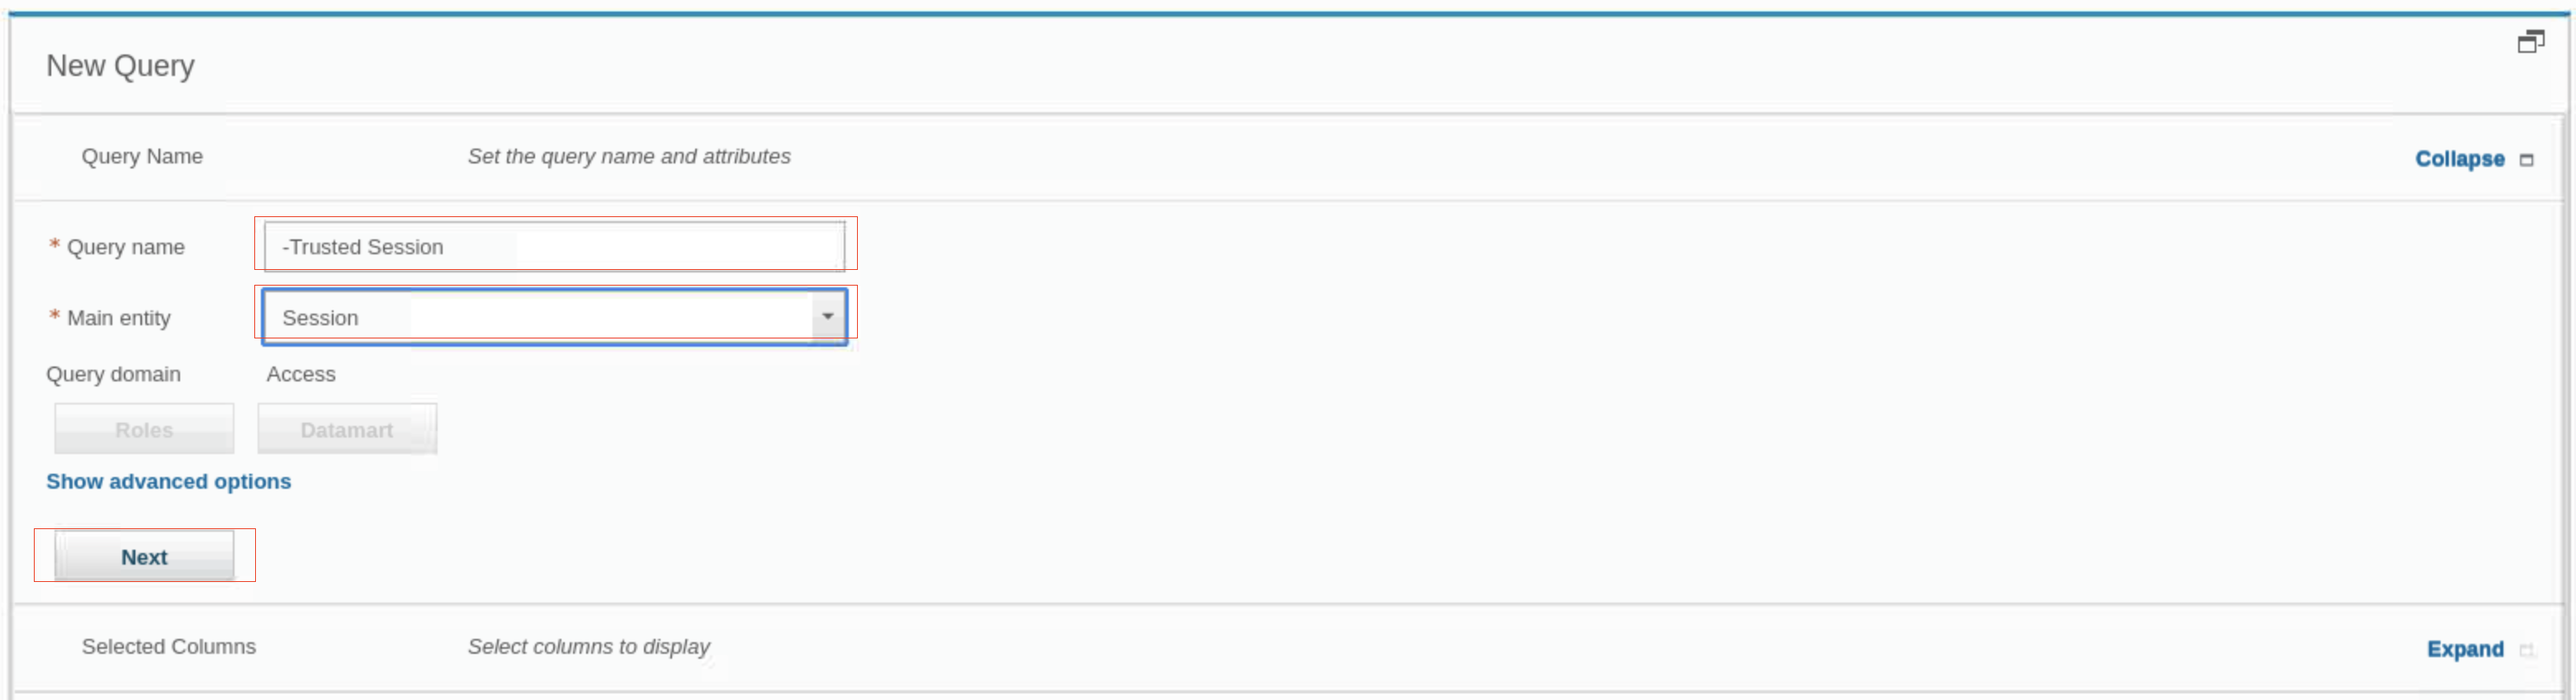
Click New. The New Query pane opens.
Note: The New Query wizard has several sections, which can be expanded or collapsed. The wizard leads you through the process of building a query and generating a report. To return to the query-report builder pane, click Query-Report Builder in the lower-left corner of the wizard.
- For the Query name, type -Trusted Sessions.
- For Main entity, select Session.
- Click Next.
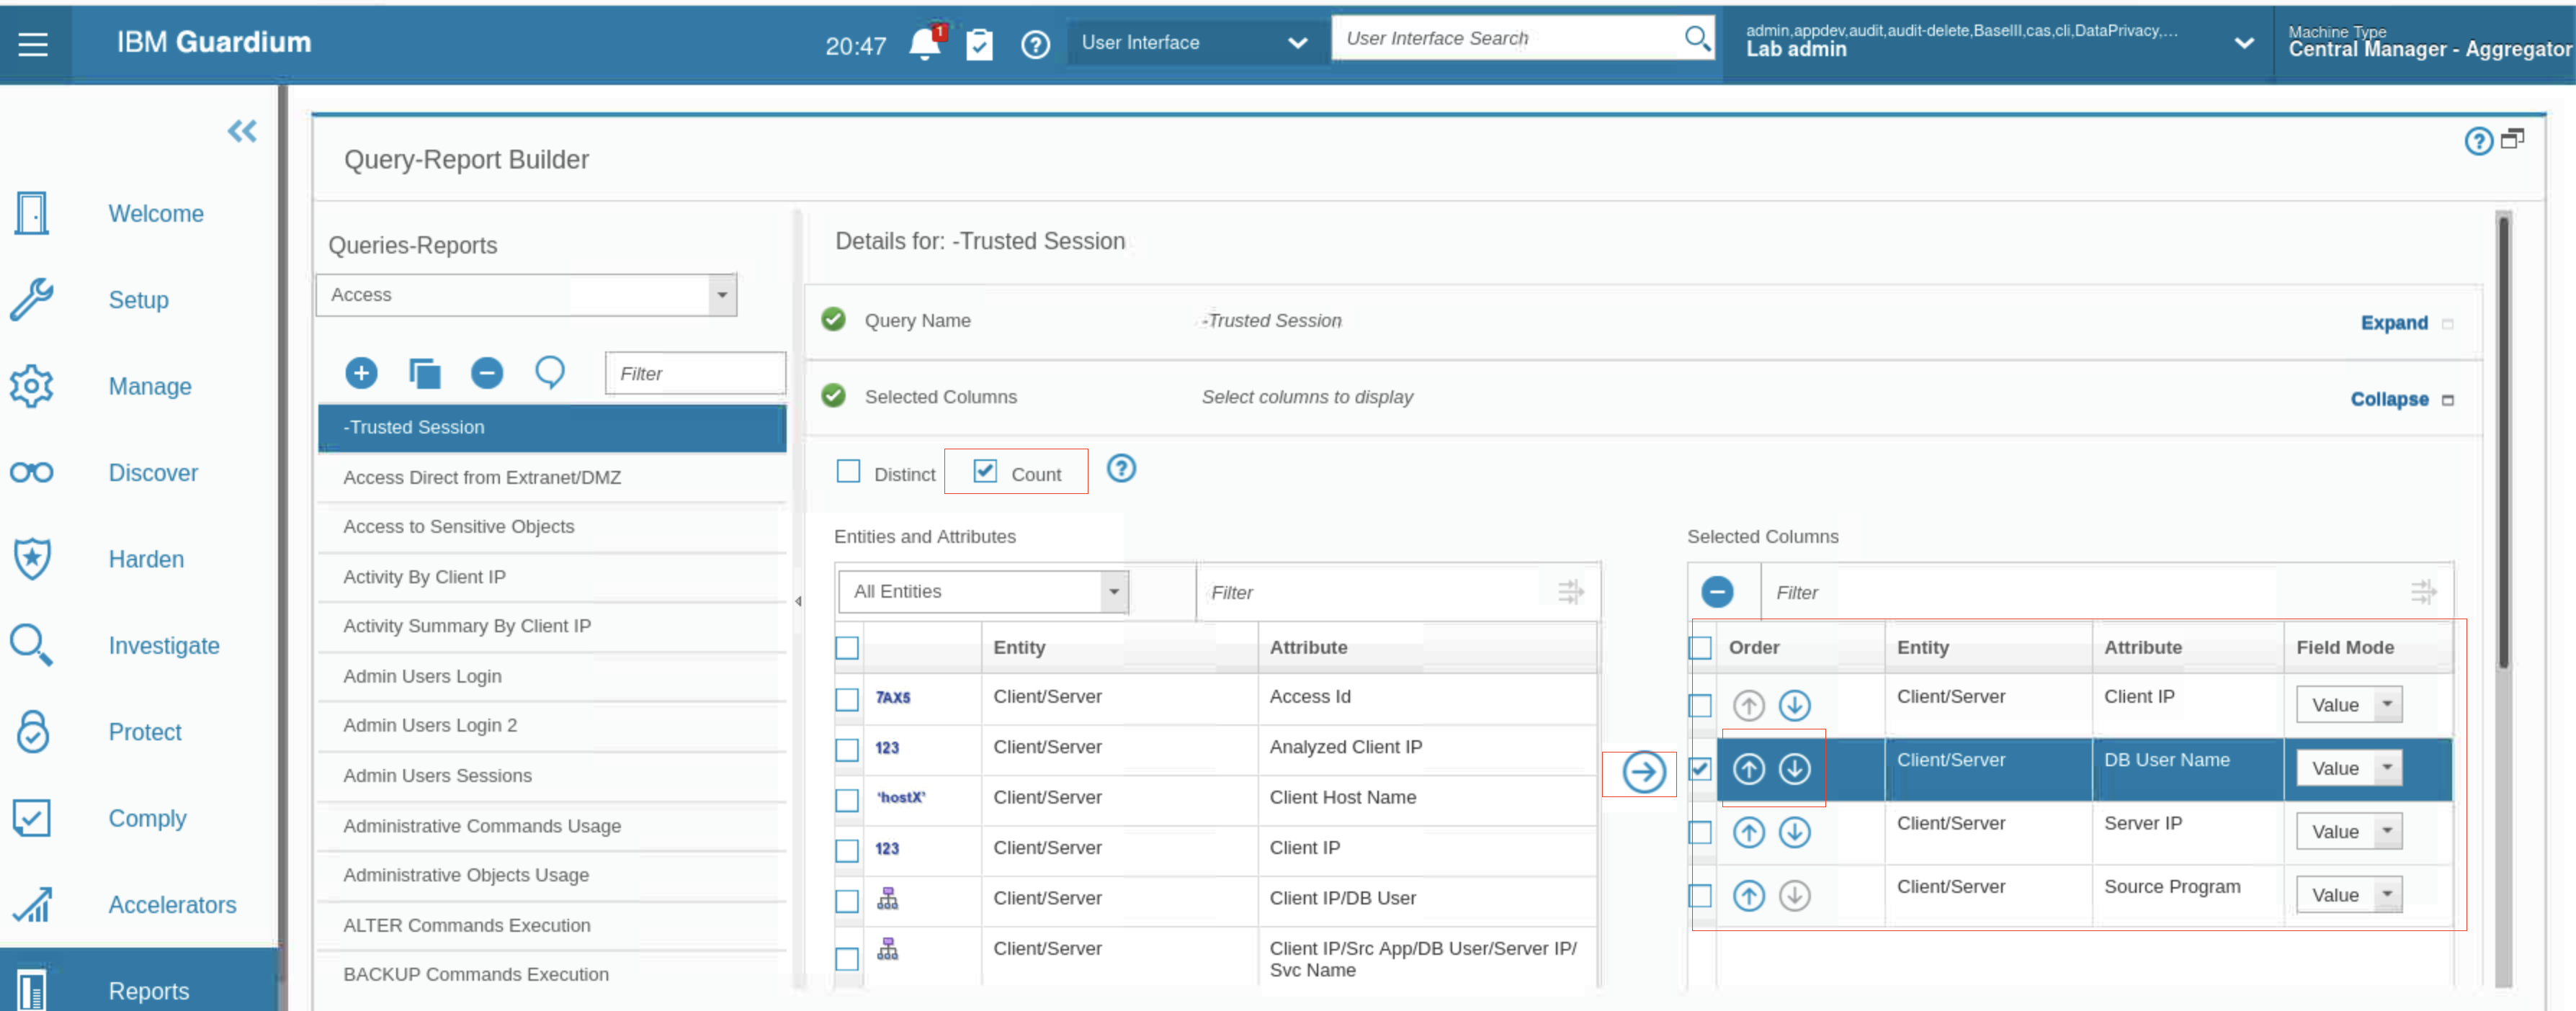
The Query Builder pane displays tools to build the query.To determine how the information is displayed, choose entities from the Entities and Attributes list to add to the Selected Columns fields. You add entities to the Query Conditions, which determine what information is displayed.
- In the Entities and Attributes table, select Entity: Client/Server with Attribute: Client IP and then click the Copy icon
The entity is added to the Selected Columns table on the right side of the window.
- Scroll down or use the Filter field to find and add the following attributes from the Client/Server entity to the Selected Columns table
- Server IP
- DB User Name
- Source Program
When you are finished, the query builder includes four entities in the Selected Columns section.
- You do not lose your work, scroll down and click Save, then close the confirmation.
Note: When you build or modify a Guardium query, save your query early and often to avoid loss of work and frustration.
-
To ensure that subsequent reports display counts of the sessions rather than details of each individual session, select Count.
-
To put the fields in the correct sequence, select the DB User Name entity and use the up and down blue arrows to move it to the second position in the sequence.
-
To display the sort order, click Next
-
To set the sort rank, select Sort results by columns and then click Add sort column. In the field that opens, you can select which columns to sort by, and in what order.
- From the drop-down list, select Client/Server - Client IP.
- To sort the data in ascending order, select Ascending
- To add another sort entity, click the Add sort column icon. Select Client/Server - DB User Name and Ascending.
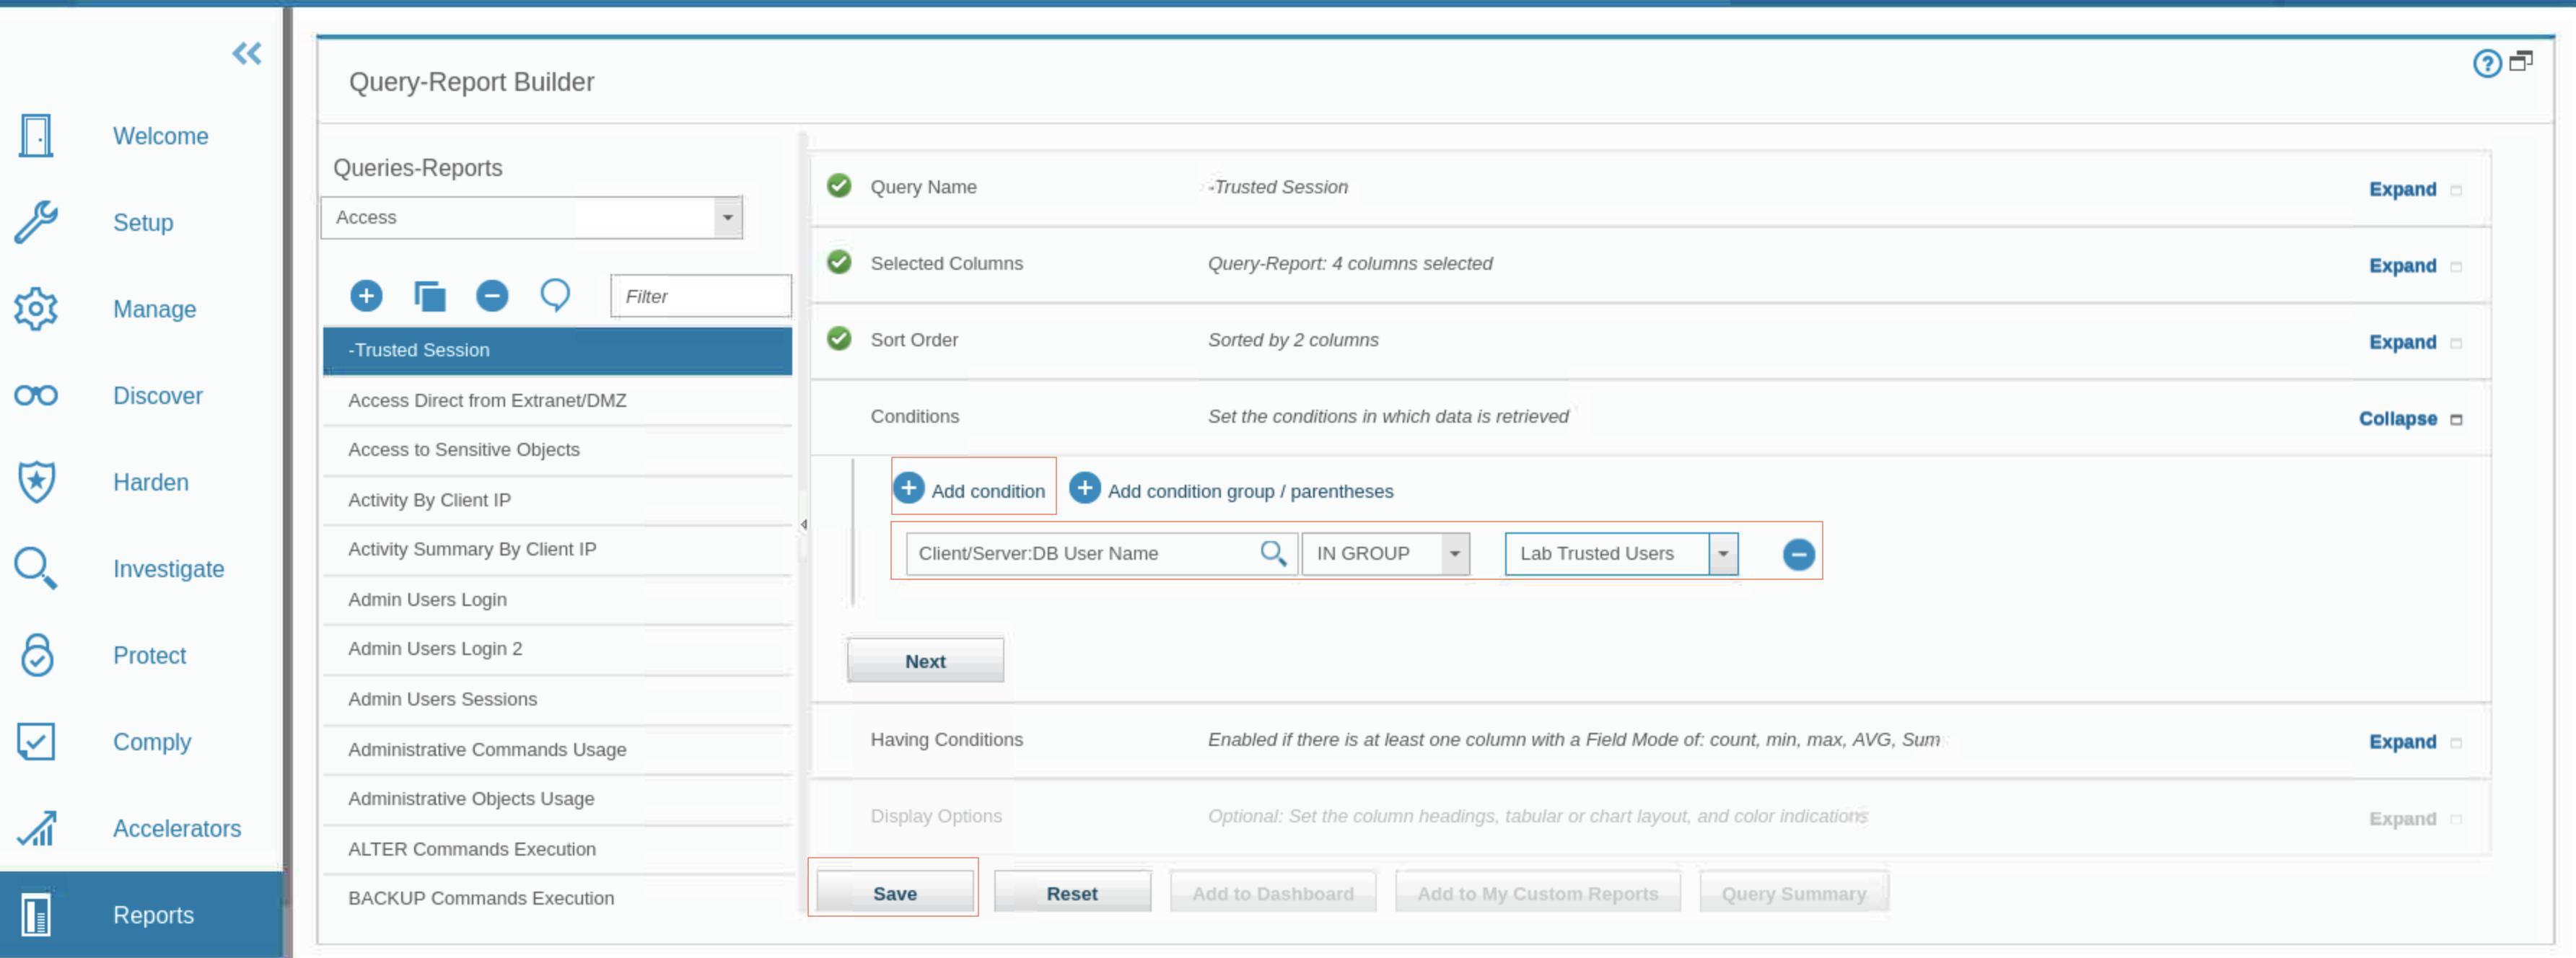
- To move to the Conditions section, click Next.

- Add conditions to the query. Conditions control the information that is displayed in the report. You are interested in only trusted users, so you check to ensure that the database users are members of a group called Lab Privileged Users.
- To add a condition, click the Add condition icon.
- Click the Search icon. The Select a condition field window opens.
- Expand Client/Server, highlight DB User Name, and click Select.
- Select the IN GROUP operator and the Lab Privileged Users runtime parameter.
- Click Save.
Add the report to the dashboard
In this task, you add the report to the dashboard.
- Click Add to Dashboard. The Add Report to Selected Dashboard window opens.
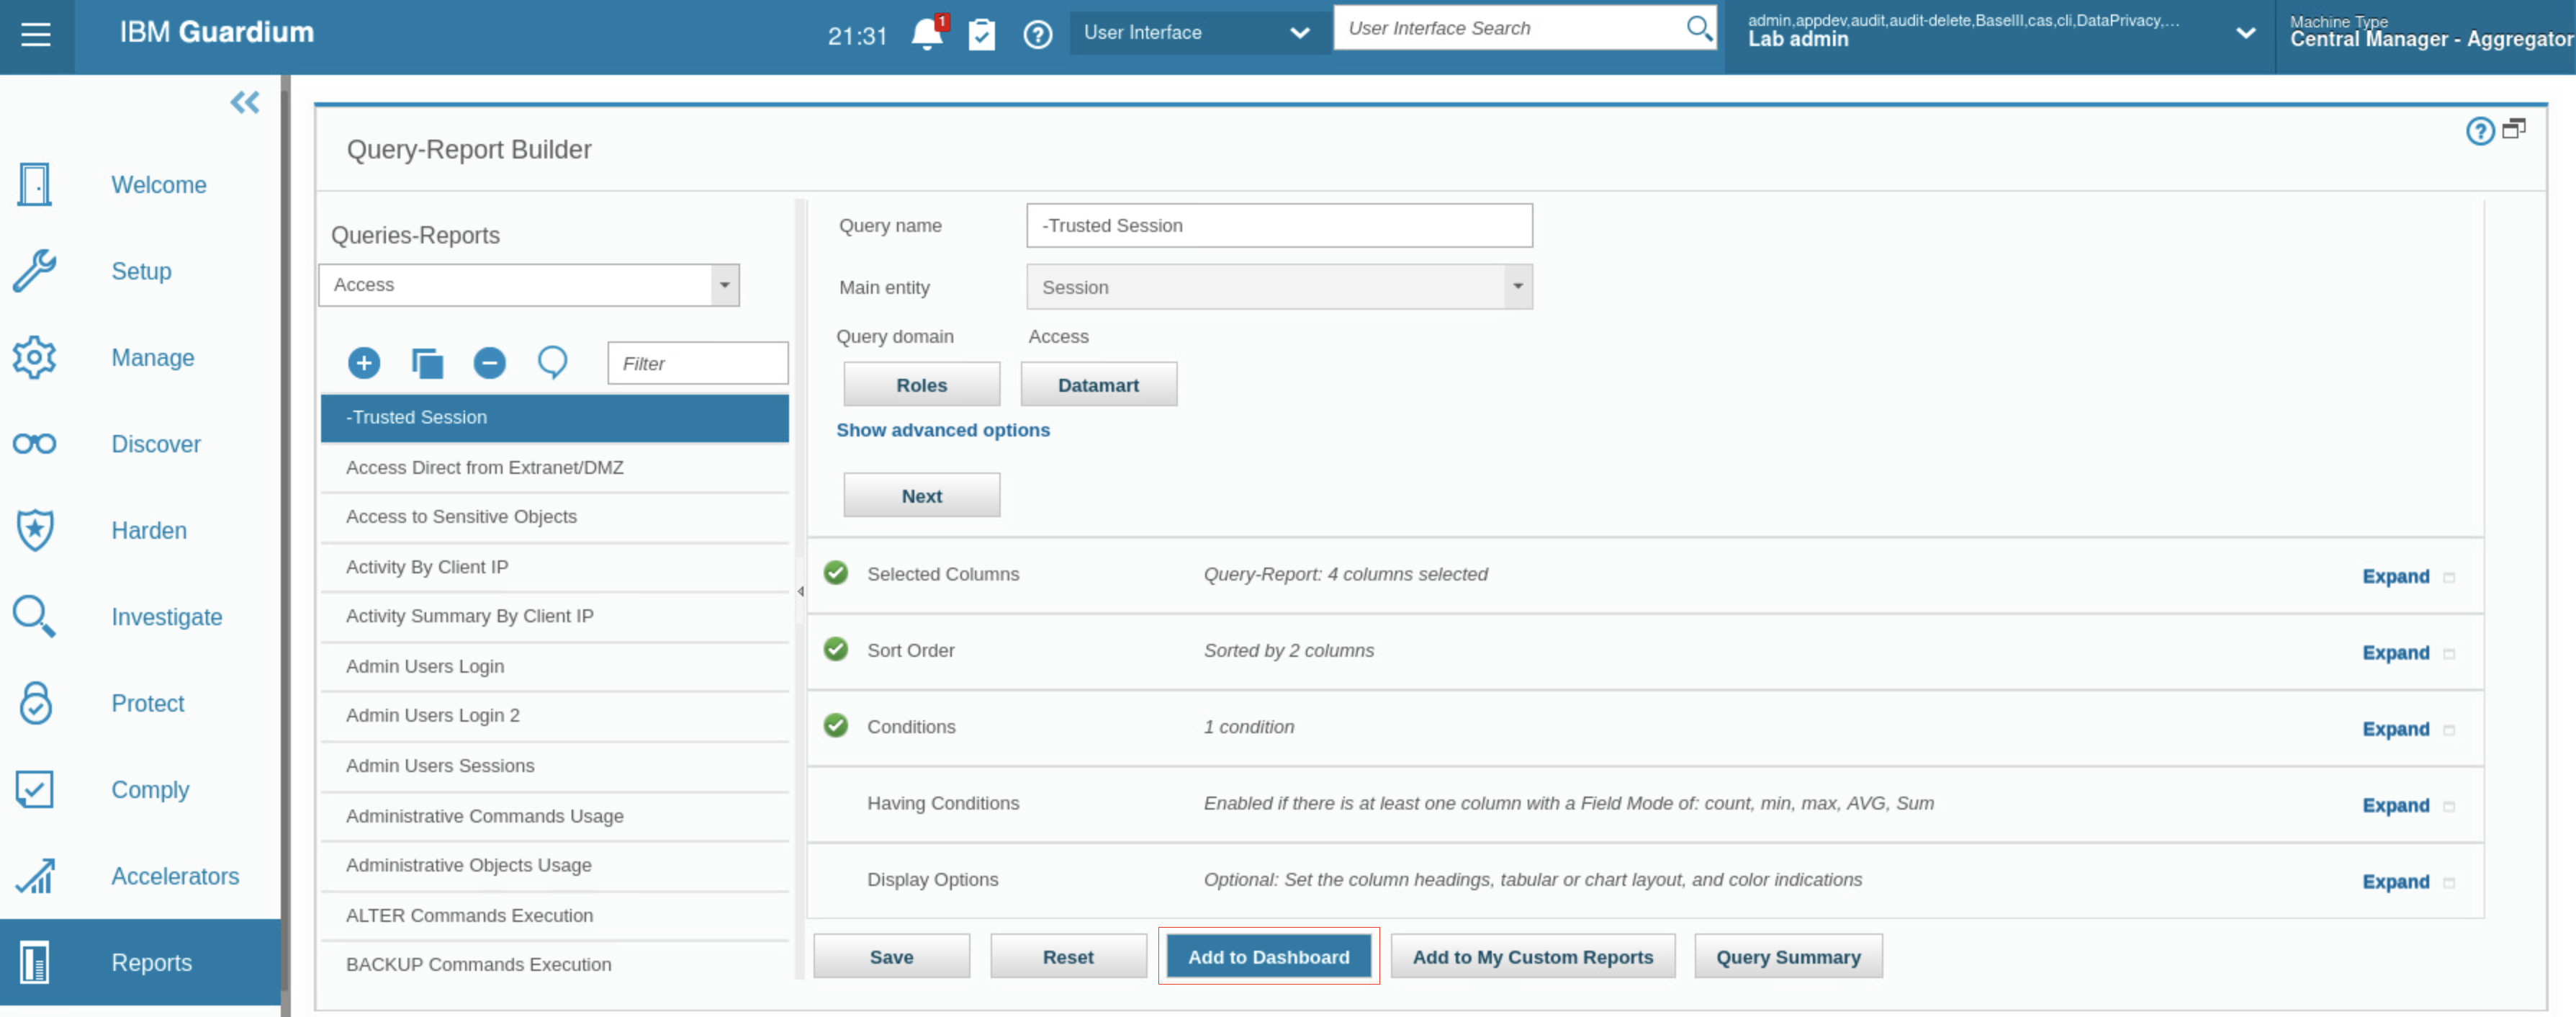
-
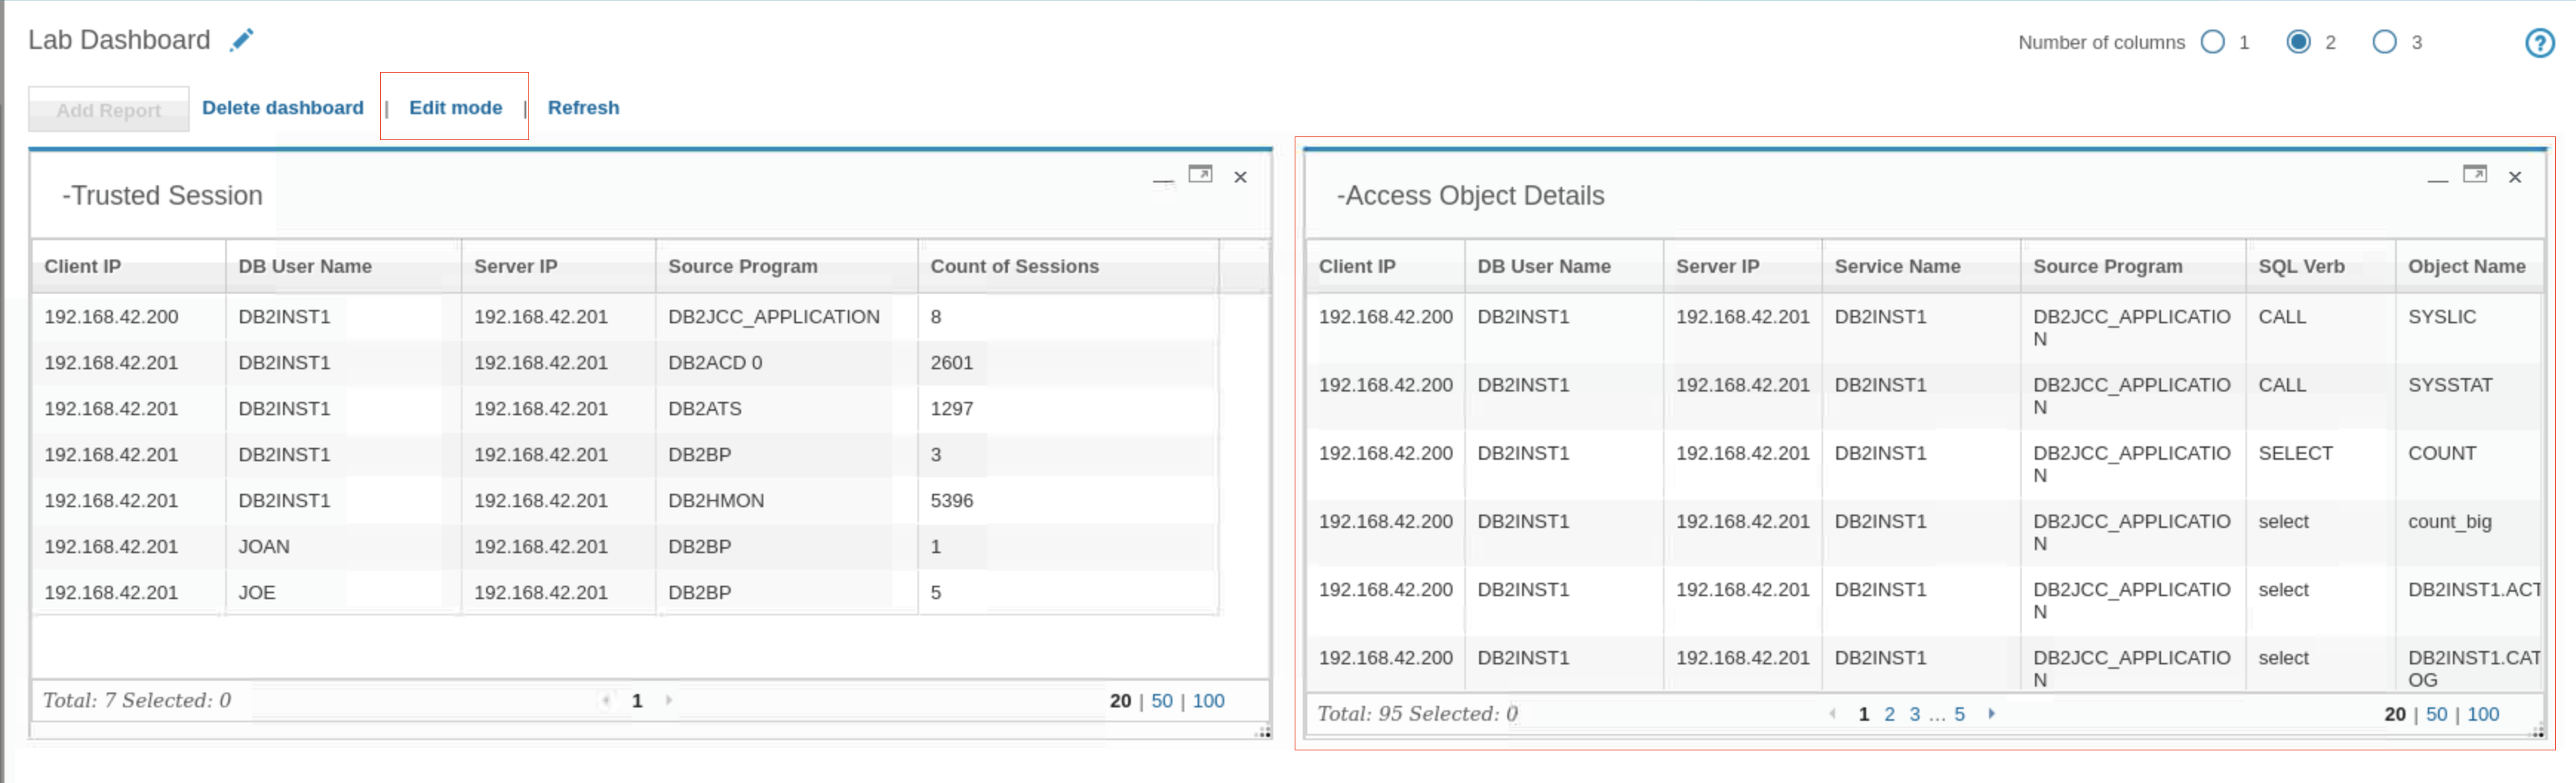
Select Lab Dashboard and click Add Report.
-
Click Save.
-
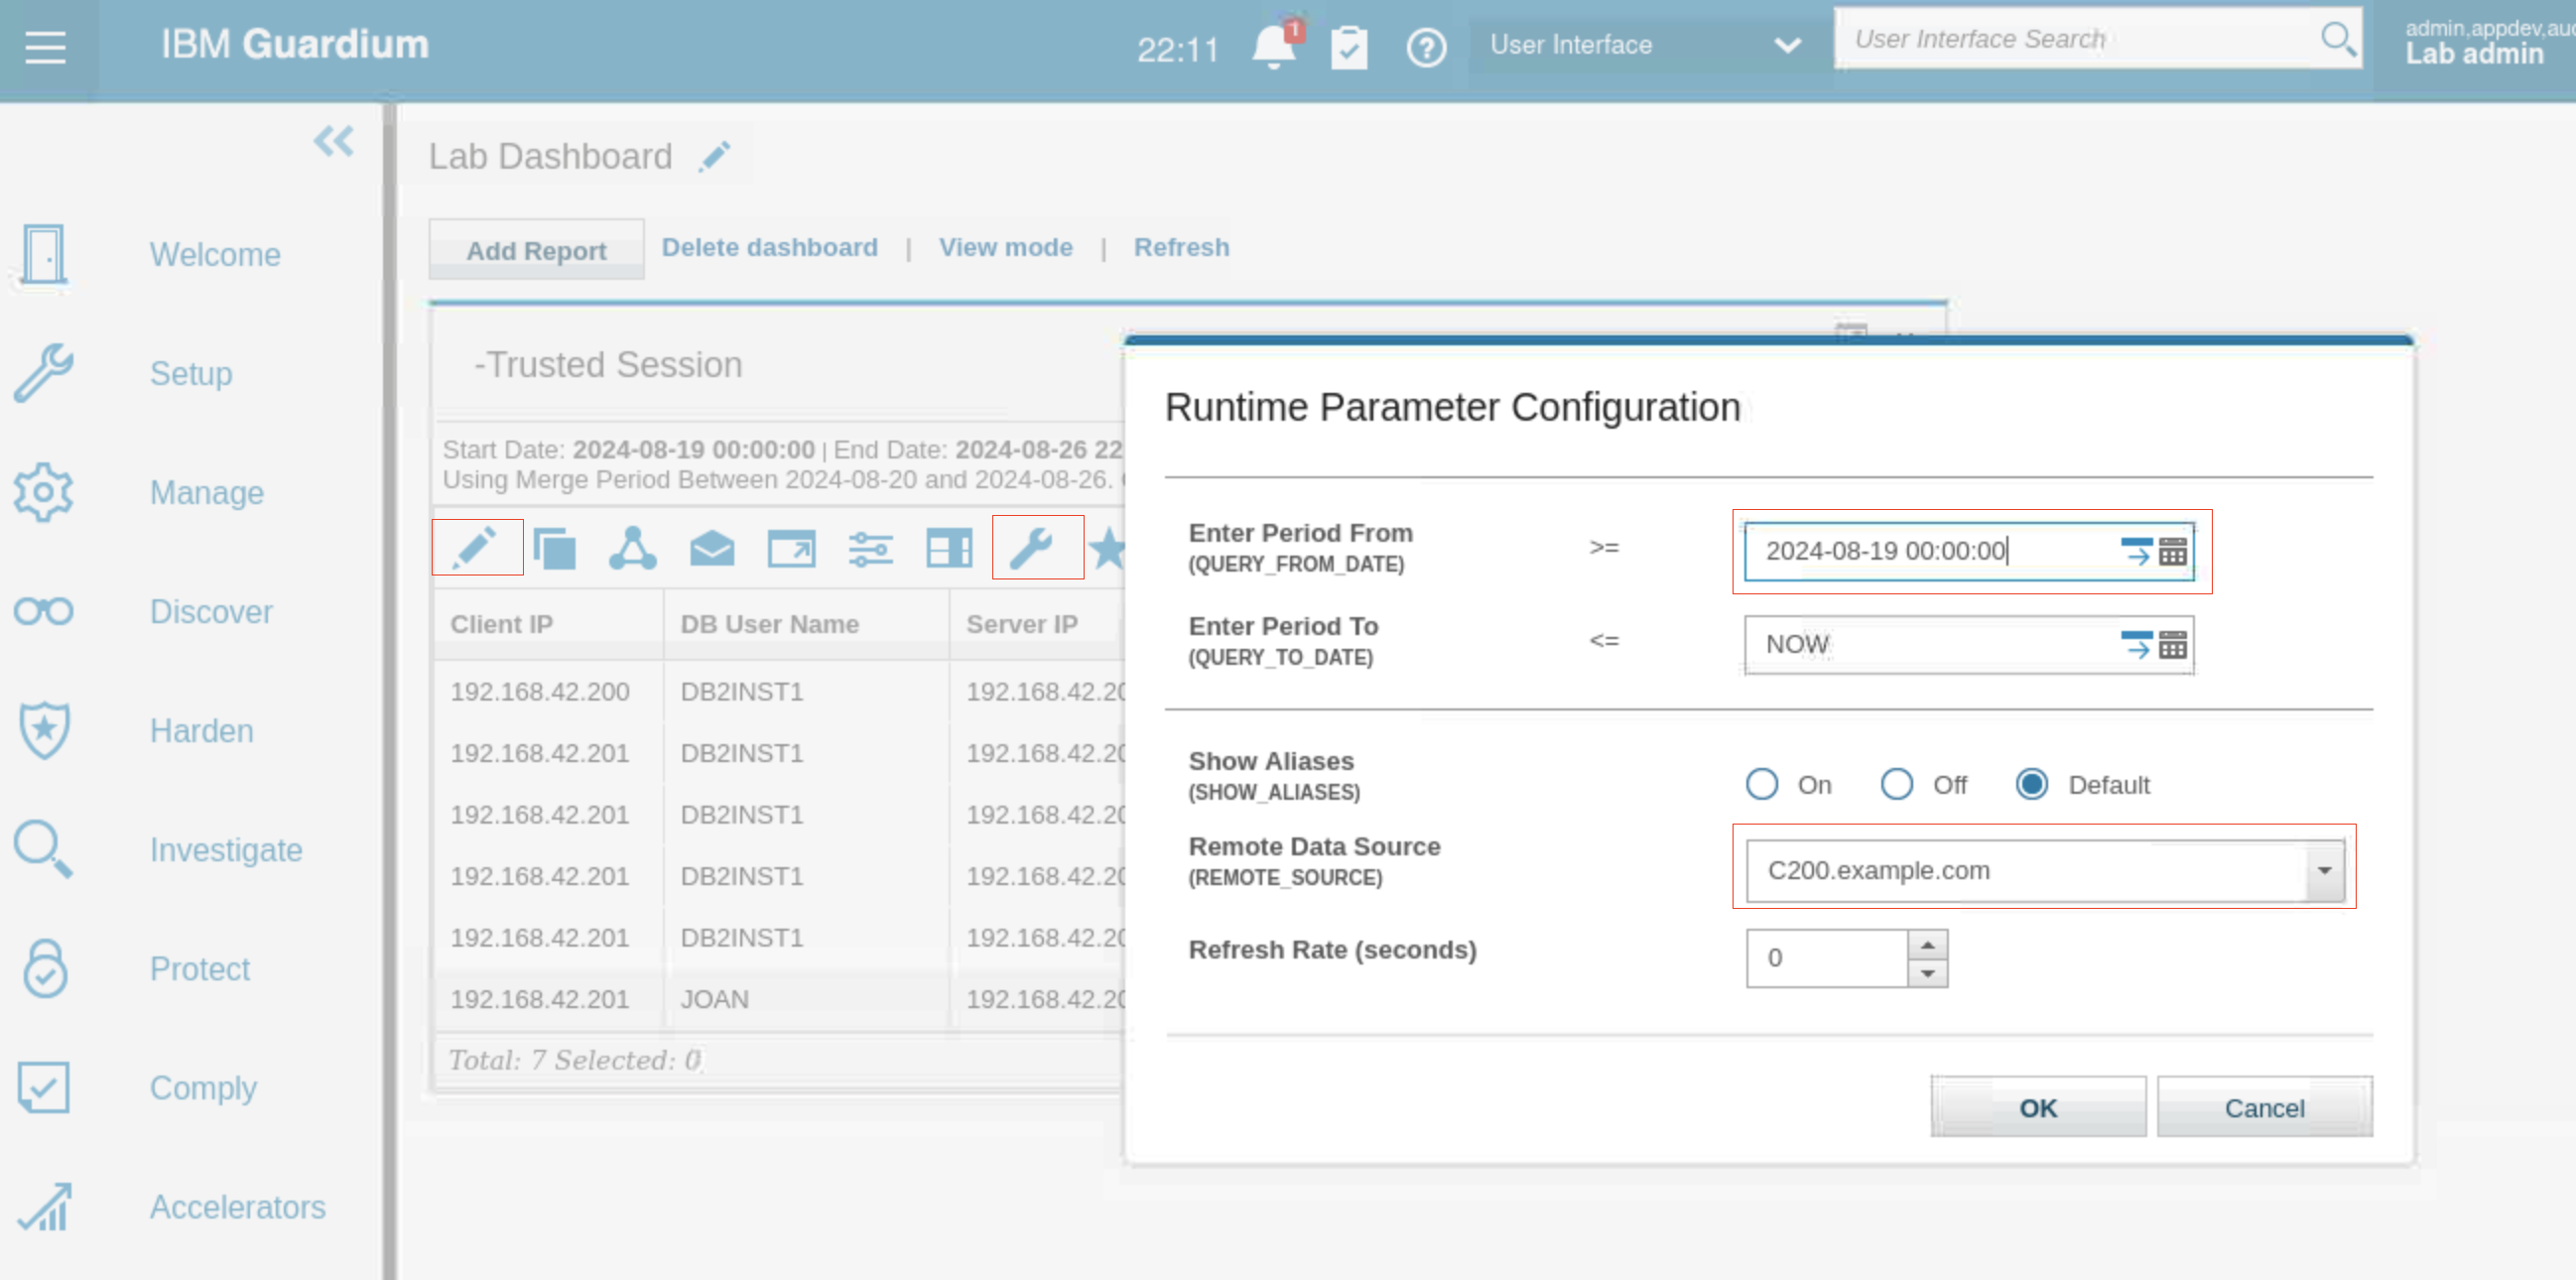
From the left navigation menu, click My Dashboards > My Custom Dashboards > Lab Dashboard. Your dashboard opens on the Add Report tab with the new report data.

- If there is no data in your report, edit your time-frame for this report.
- Click Edit mode.
- More icons and settings become available for customizing your report.
- Click the Configure runtime parameters icon . The runtime parameter configuration dialog opens.
- In the Enter Period From field, click the date picker icon and set the fields in the date picker to NOW minus 3 Day and click OK
- To close the runtime parameter configuration dialog, click OK. You now have data in your report.
Creating a query and report with drill-down capabilities
In this exercise, you create a report with runtime parameters. Reports that have this structure are available as drill-down reports from other reports where those parameters are also available.
The report returns details of all database objects that are accessed by a specified database user or client IP address combination. The database user and client IP are set up in parameter form so that you can define them at run time, either explicitly, or by using wildcards.
-
From the left navigation menu, click Reports > Report Configuration Tools > Query-Report Builder.
-
For Domain, select Access. An icon to add a new query and a list of access reports becomes available.
-
Click New. The New Query pane opens.
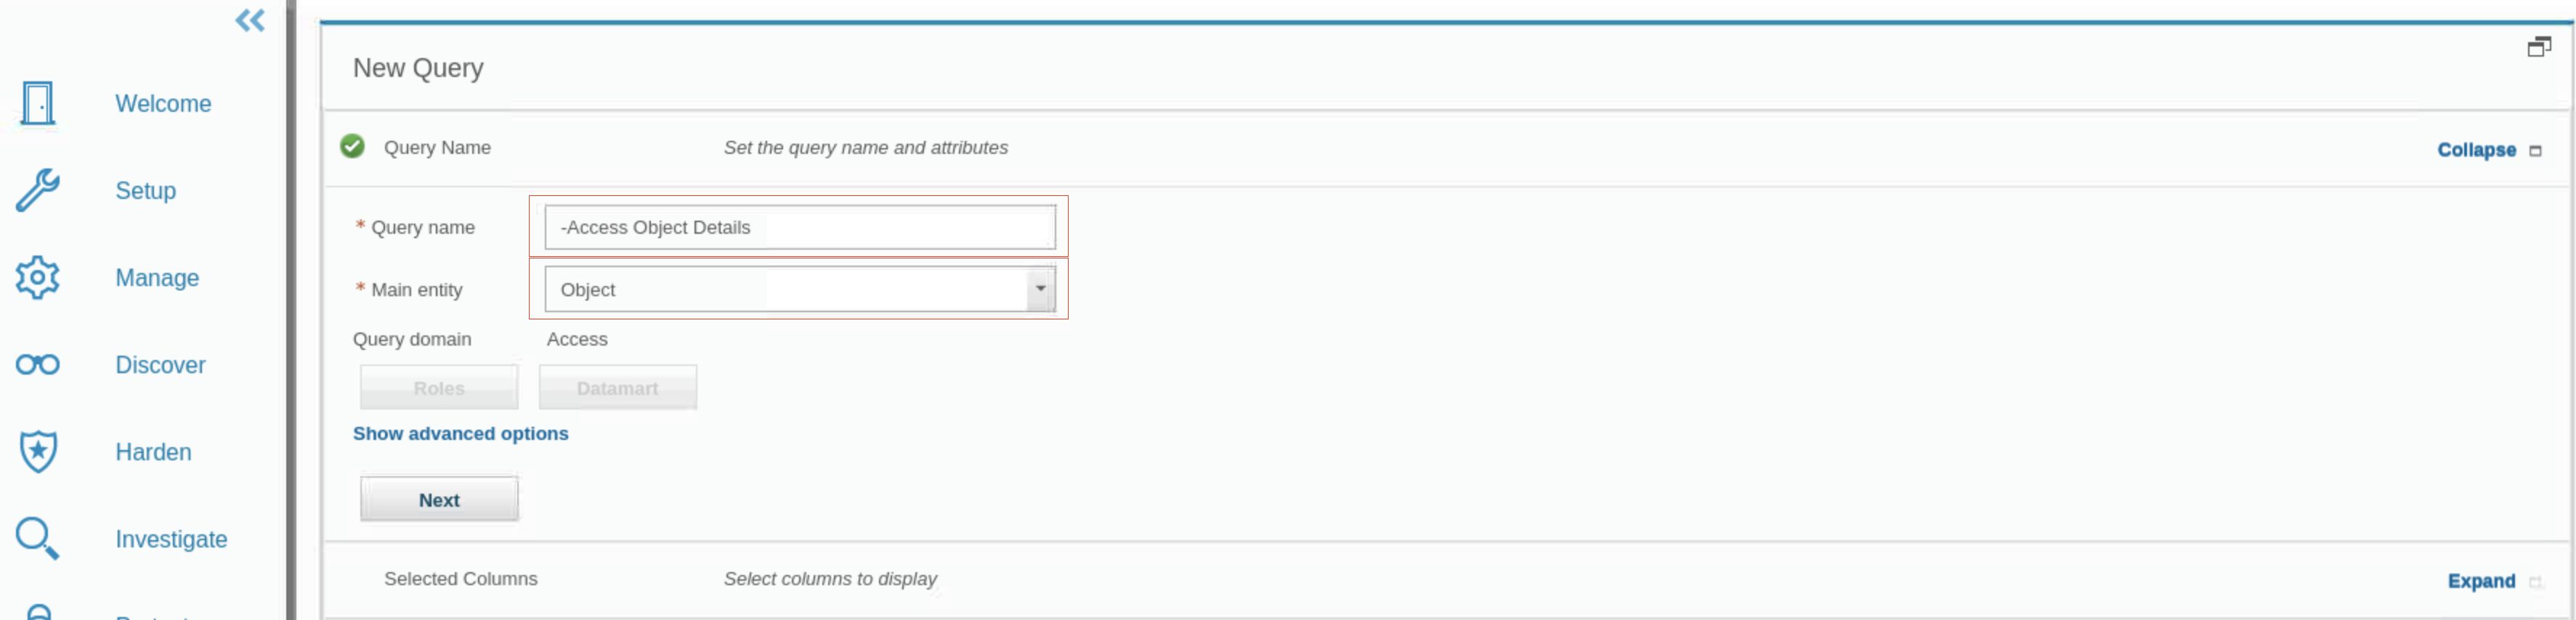
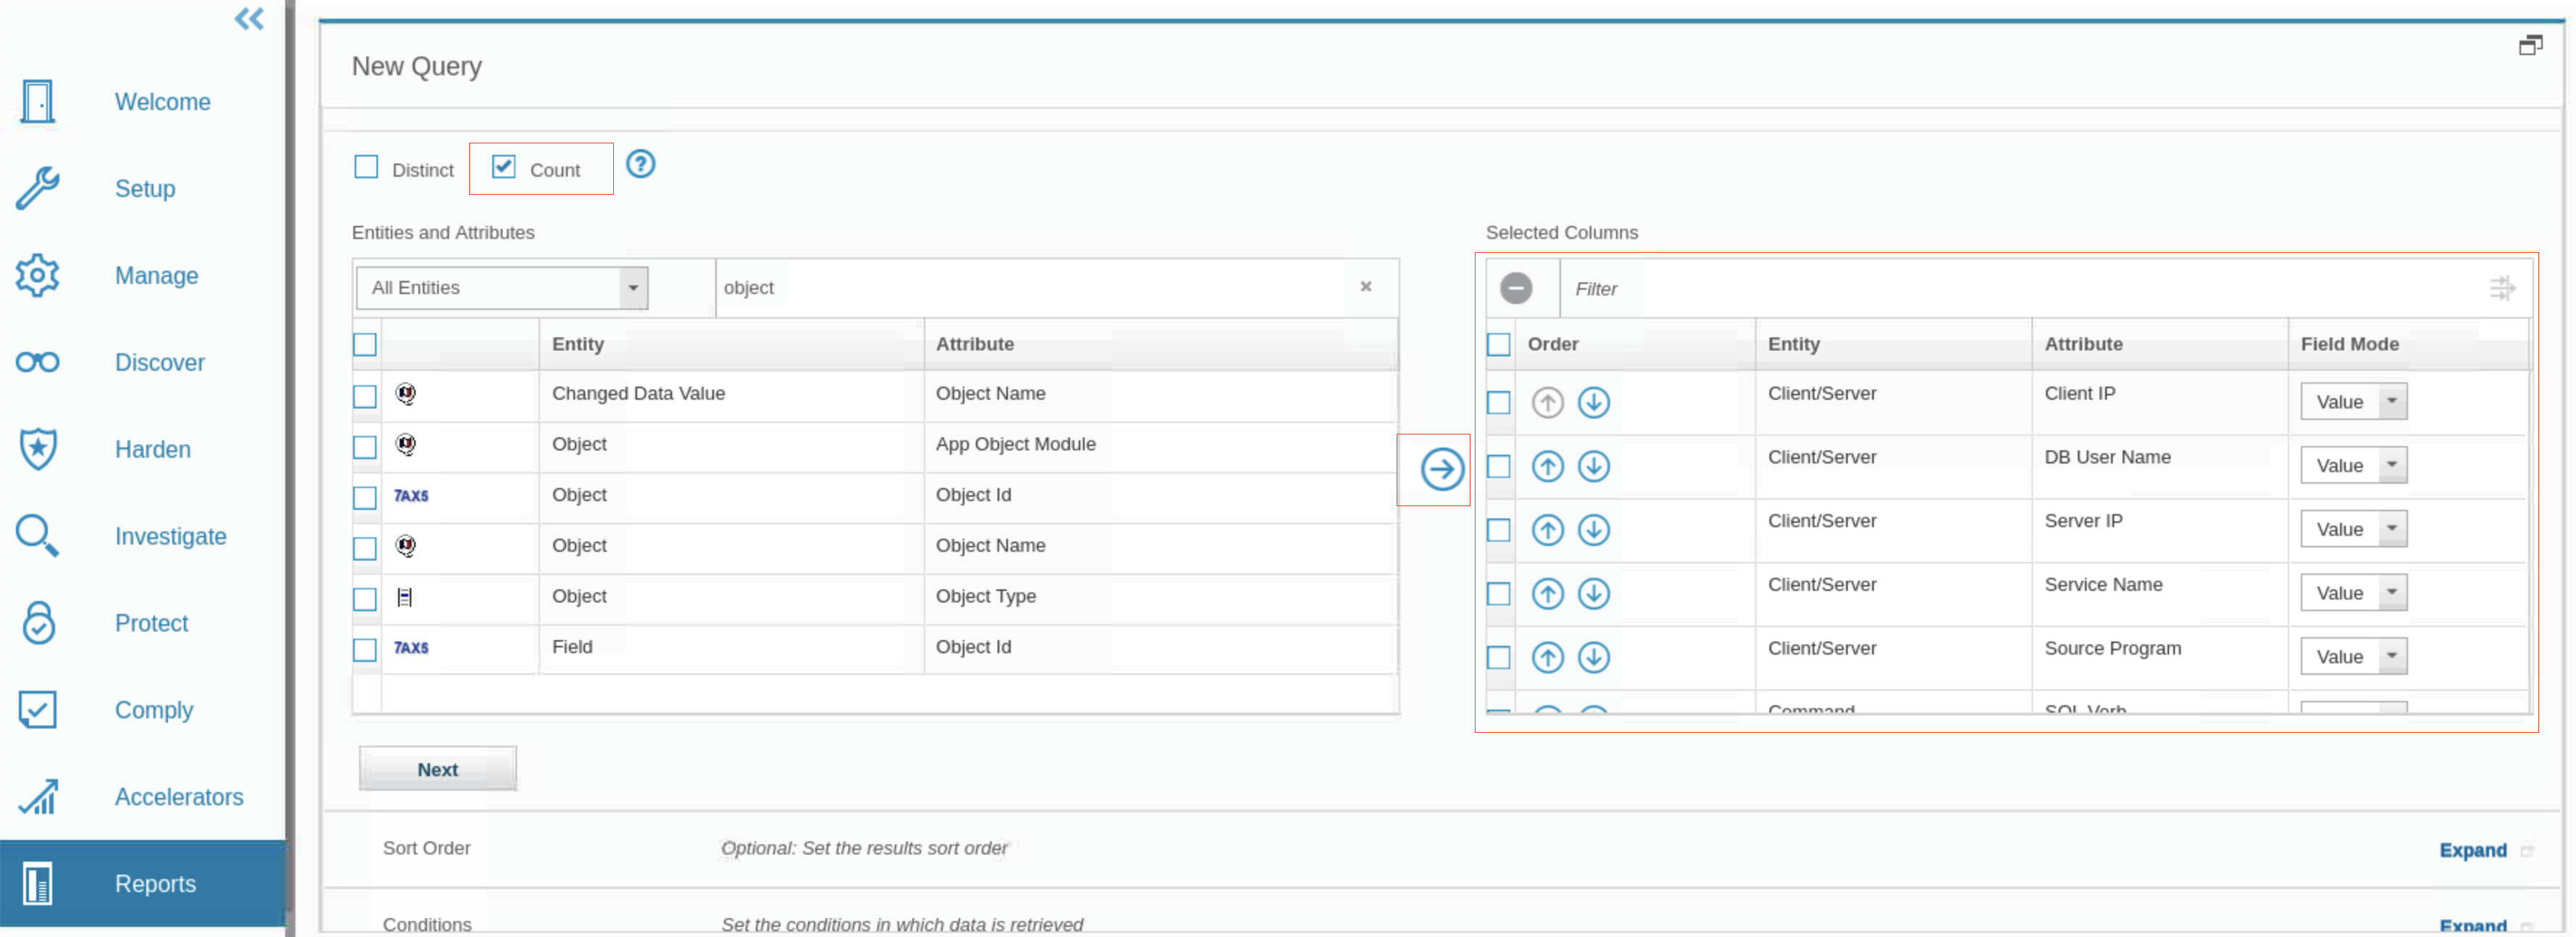
- For the Query name, type -Accessed Object Details.
- For Main entity, select Object.
- Click Next.
-
To ensure that subsequent reports display counts of the sessions rather than details of each individual session, select Count.
-
In the Entities and Attributes drop-down list, select Entity: Client/Server. Next, select the Attribute: Client IP and then click Copy.
The Client IP attribute is added to the Selected Columns section on the right side of the window.
- Select the following attributes and move them to the Selected Columns section:
- Entity: Client/Server, Attribute: DB User Name
- Entity: Client/Server, Attribute: Server IP
- Entity: Client/Server, Attribute: Service Name
- Entity: Client/Server, Attribute: Source Program
- Entity: Command, Attribute: SQL Verb
- Entity: Object, Attribute: Object Name
Now you have seven entity attributes in the Selected Columns table.
-
Save the report.
-
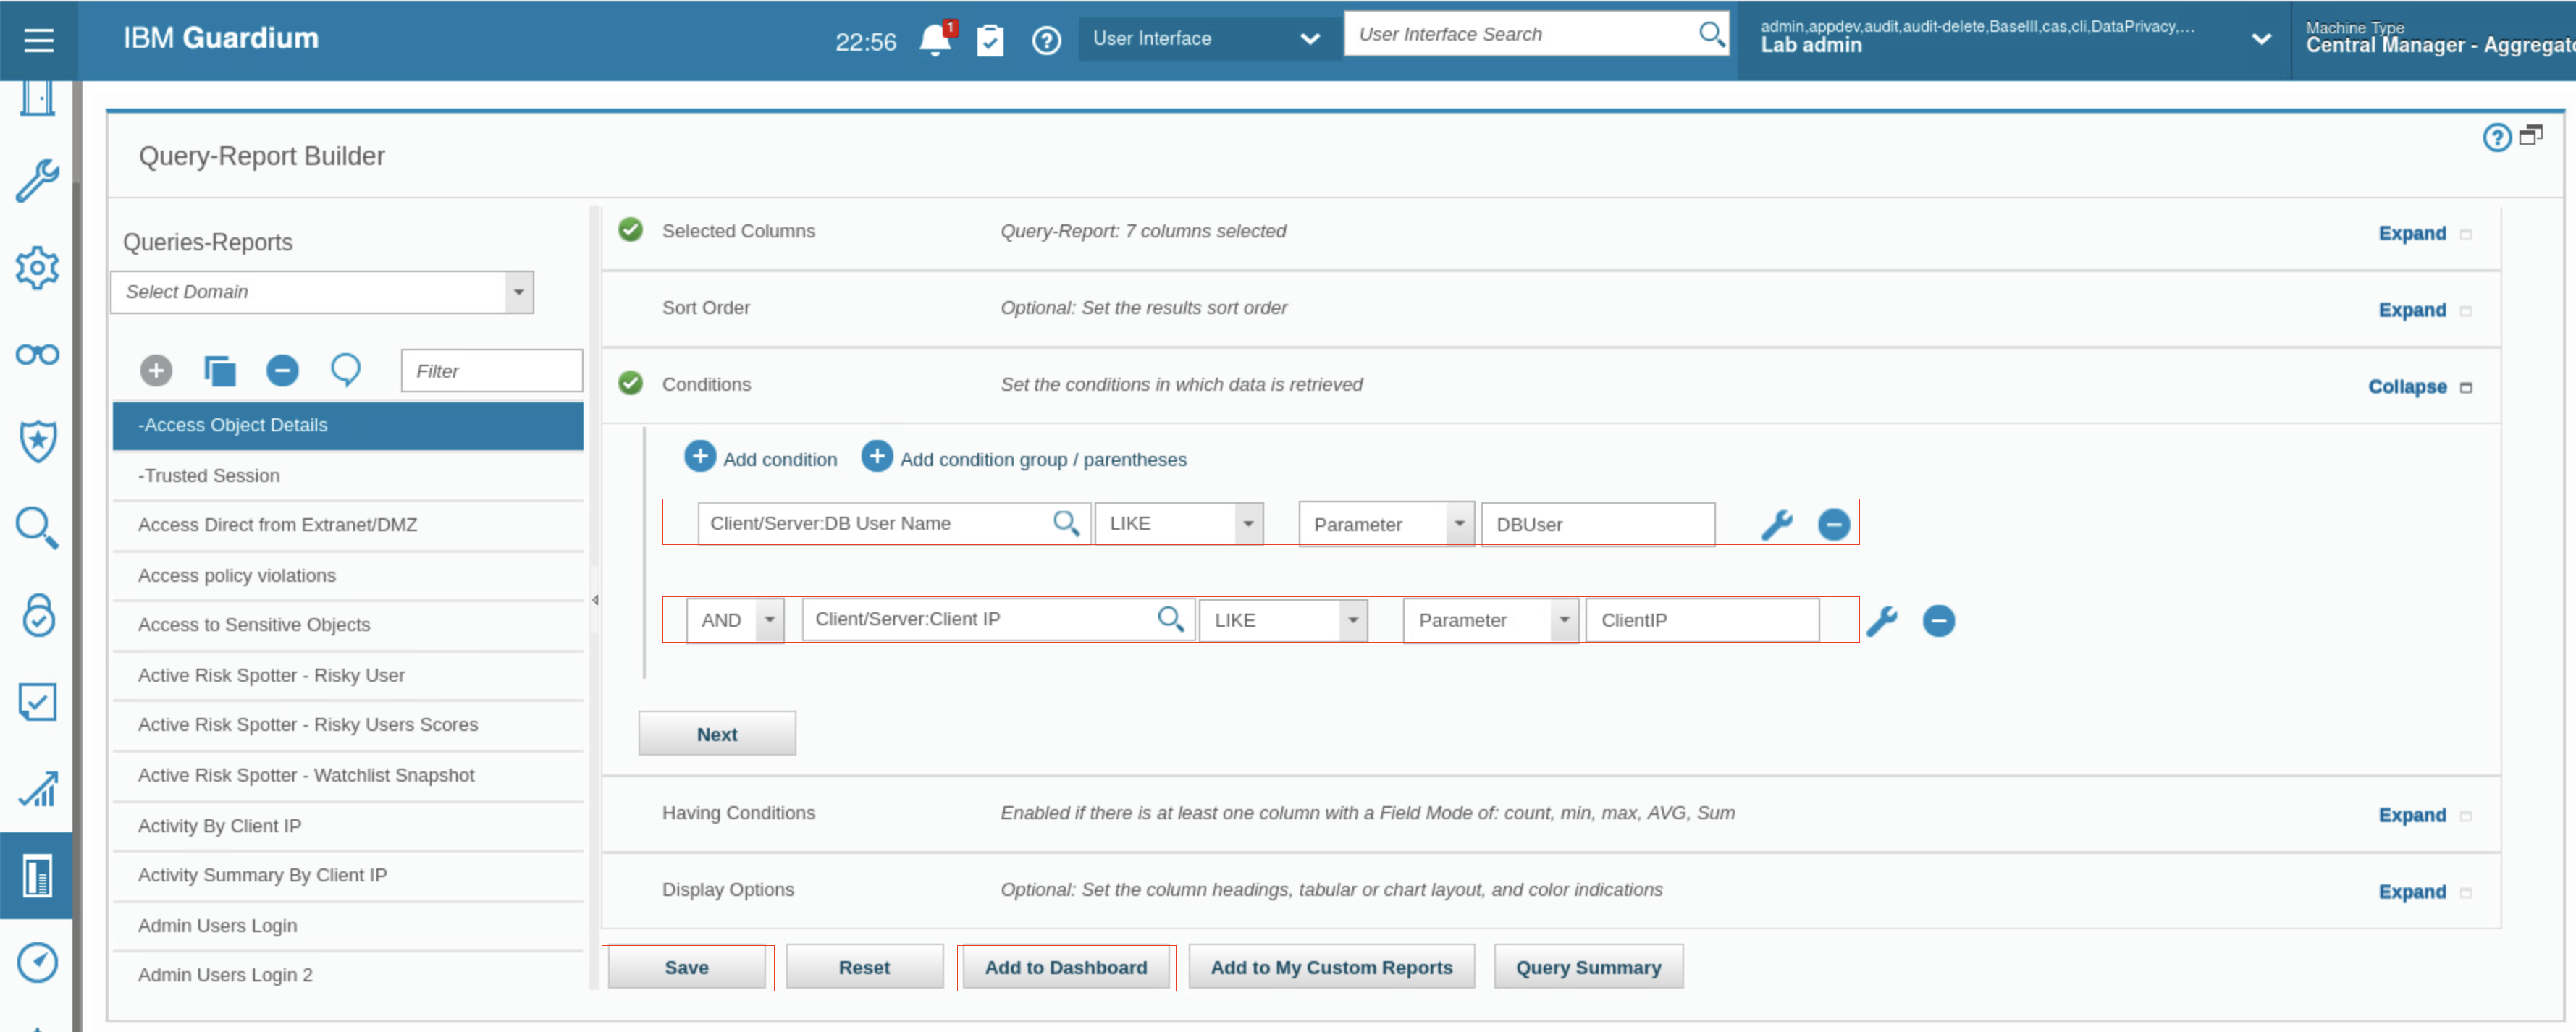
Add two conditions. You link these conditions with an AND, so both conditions must be met.
- To configure conditions for your report, expand the Conditions section.
- Add attribute DB User Name from the Client/Server folder of the entity list, with Operator set to LIKE, runtime parameter set to Parameter, and parameter value set to DBUser.
- Add attribute Client IP from the Client/Server folder of the entity list, with Operator set to LIKE, runtime parameter set to Parameter, and parameter value set to ClientIP.
- Save the report and add it to your dashboard.
- To view your dashboard, go to My Dashboards > My Custom Dashboards > Lab Dashboard, or by searching for Lab Dashboard in the user interface search field.
-
If there is no data in the -Accessed Database Objects report, enable edit mode and change the start date to NOW -3 DAY and click OK.
-
On the -Accessed Object Details report, locate one of the entries with DB User Name JOE and open the Full SQL by DB User report
- Click the DB User Name column until entries are sorted in descending order. Entries with DB User Name JOE will be at the top of the list. If not, scroll down until you find and Entry with DB User Name JOE.
- Right-click any entry with DB User Name JOE. A pop-up window opens with a list of drill-down reports.
- Scroll down and select Full SQL By DB User.
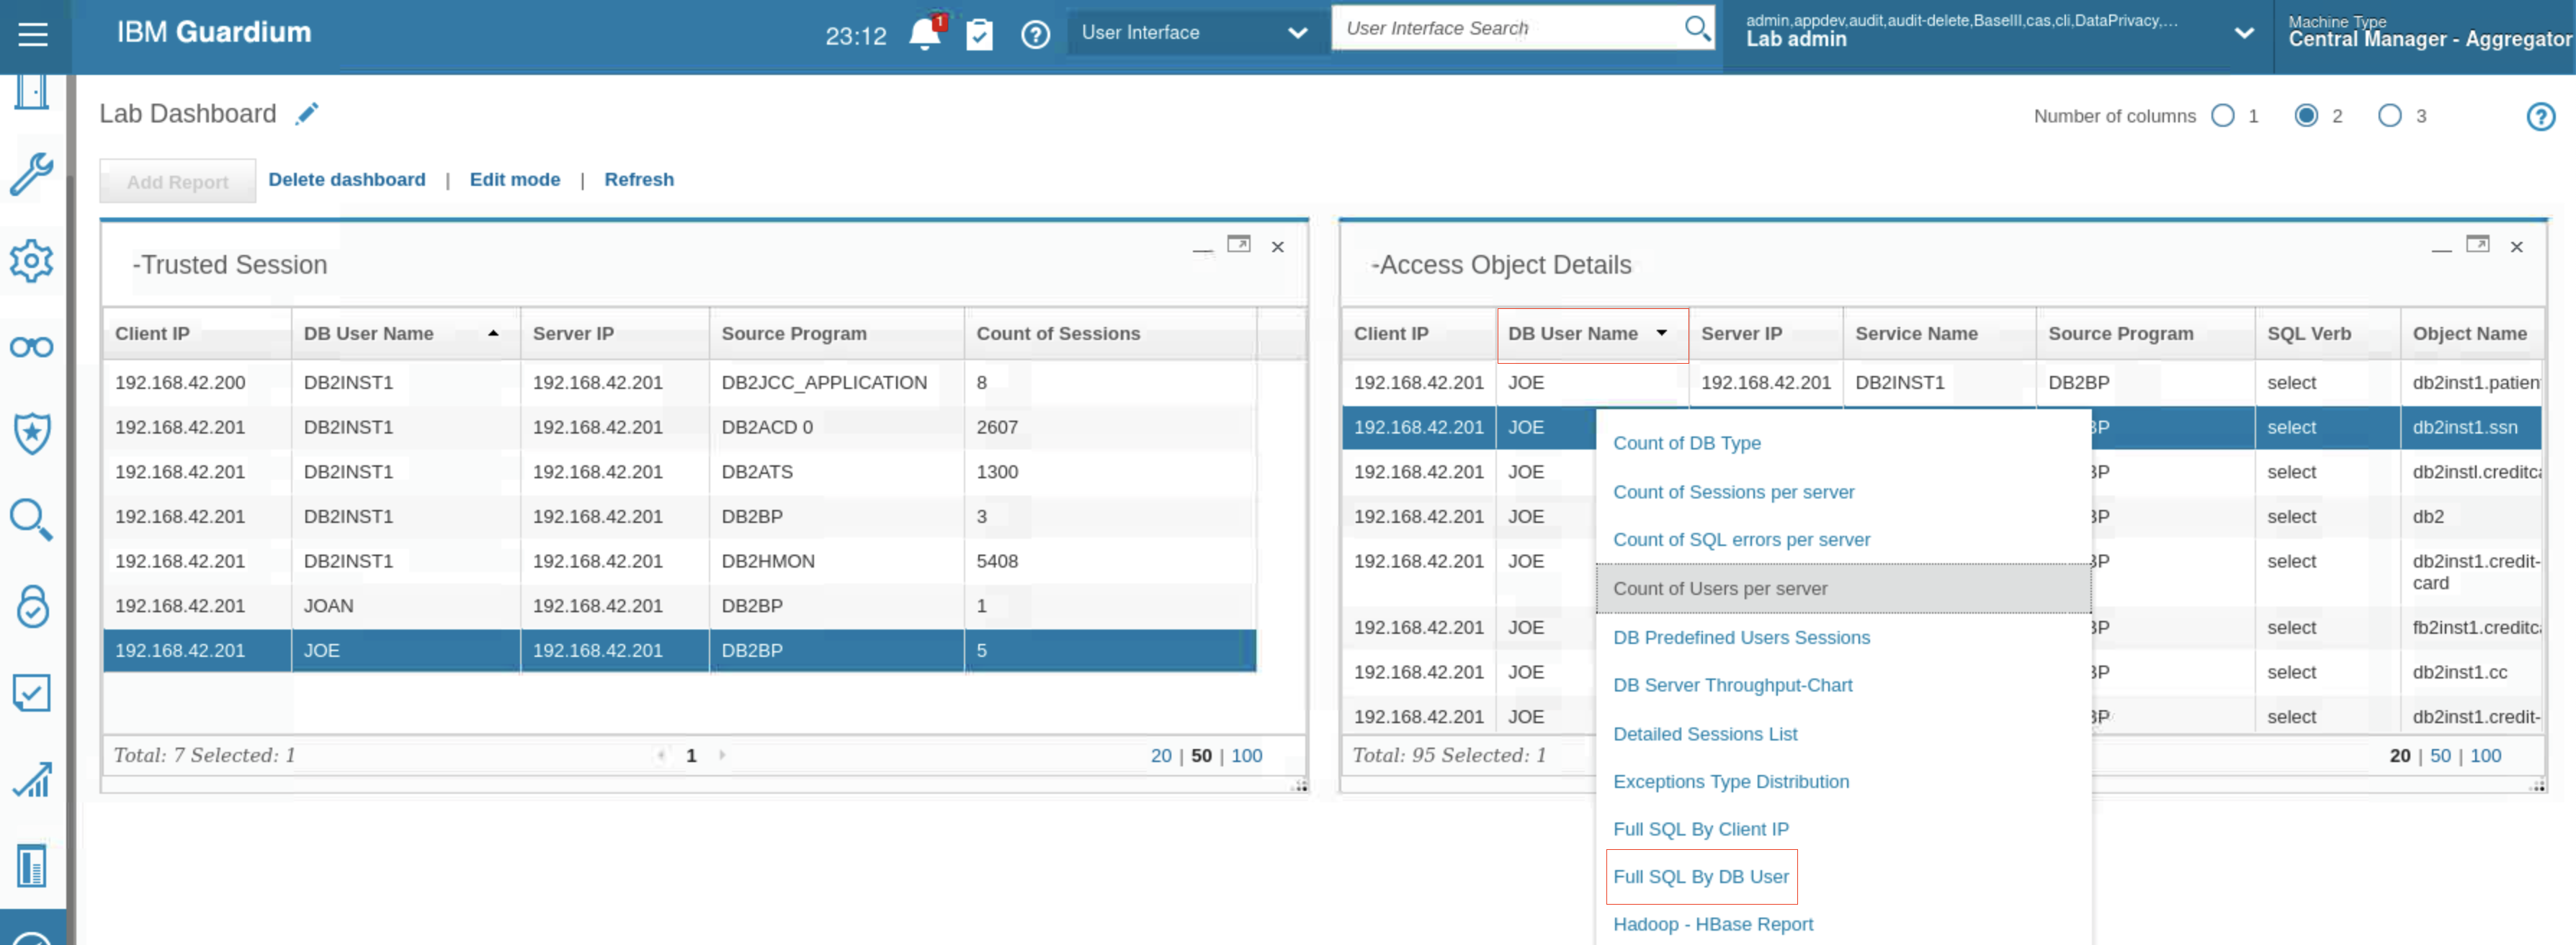
- A new window opens with the drill-down report, where the DB User Name parameter is JOE.

Congratulations, you've reached the end of lab 206.
Click, lab 207 to start the next lab.