207: Generate synthetic data
In this lab, you will be introduced to the following watsonx.ai capabilities:
- New foundation models available since the publication of the original watsonx.ai Technical Sales Lab Guide Part 1.
- Generating synthetic data for use with traditional AI or foundation models testing/tuning. This lab details two ways to generate synthetic data:
- Generate: Generate different data sets either from scratch
- Mimic: Generate new data based on a small existing data set
Prerequisites
You will need an IBM Cloud account to gain access to the TechZone account that hosts the
various Watson and watsonx services used in this lab.
If you are attending a workshop, follow your instructor's directions.
Synthetic data generation
Synthetic data is data that is artificially generated using advanced statistics, as opposed to real data, which is gathered by observing real-world events. Synthetic data can be used with watsonx.ai to augment or replace real data for improving AI models, protecting sensitive data, and mitigating bias. Synthetic data can be generated using foundation models to replicate data with the right statistical attributes. Synthetic data can be used for hackathons, product demos, internal prototyping, exploring market behaviors, or a large number of other use cases that require more data or have privacy concerns.
In this section, you will take a break from investigating foundation models to look at synthetic data generation, another important feature of watsonx.ai.
-
Open the watsonx.ai Prompt Lab and click your project.
-
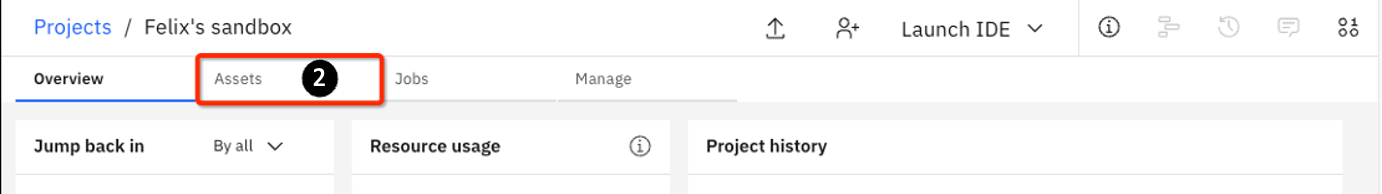
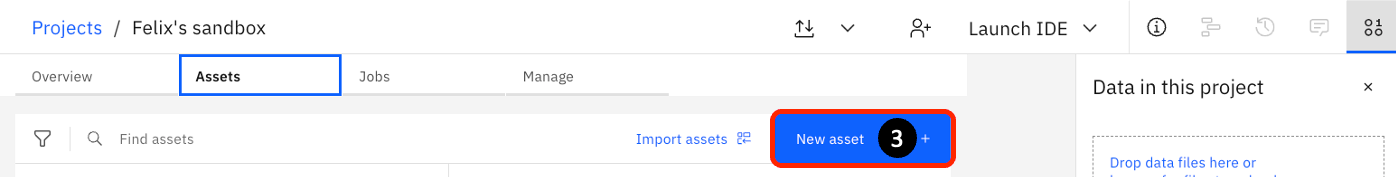
Select the Asset tab.
- Click New asset
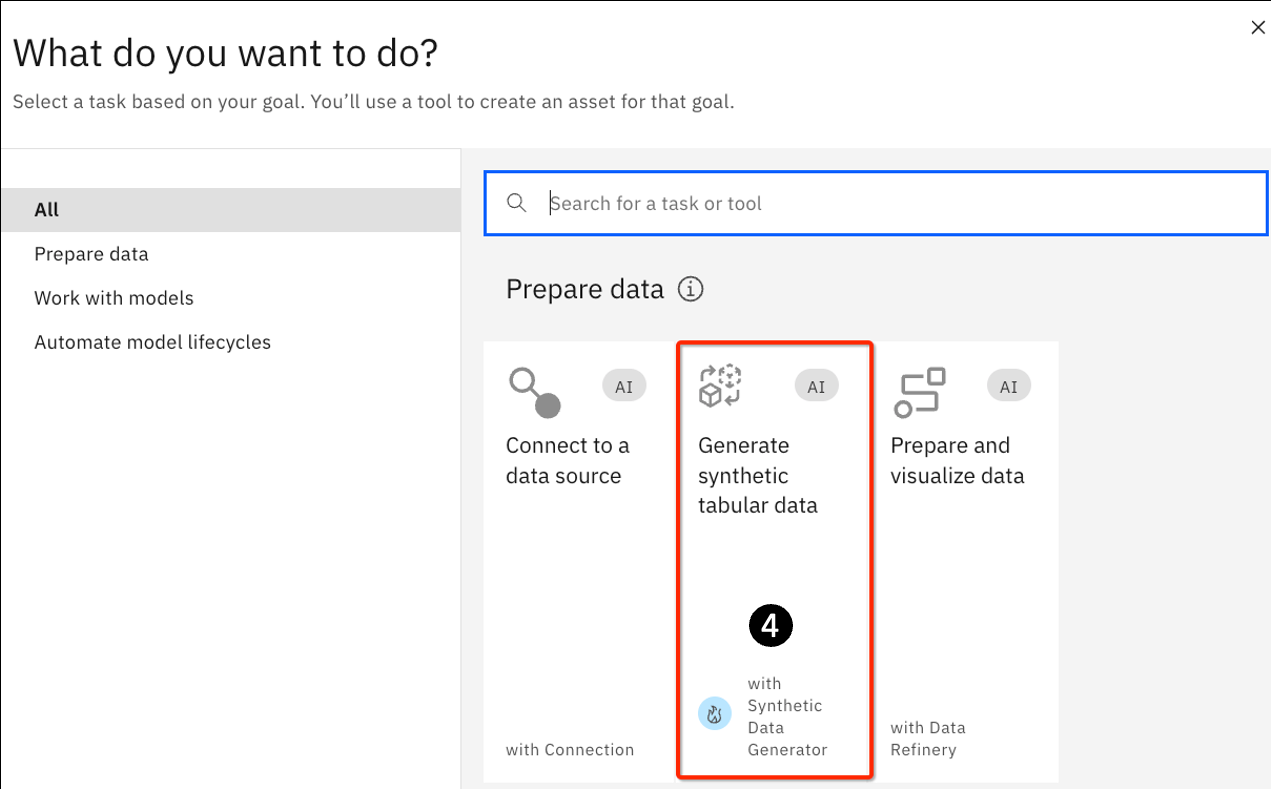
- Click on the Generate synthetic tabular data tile.
-
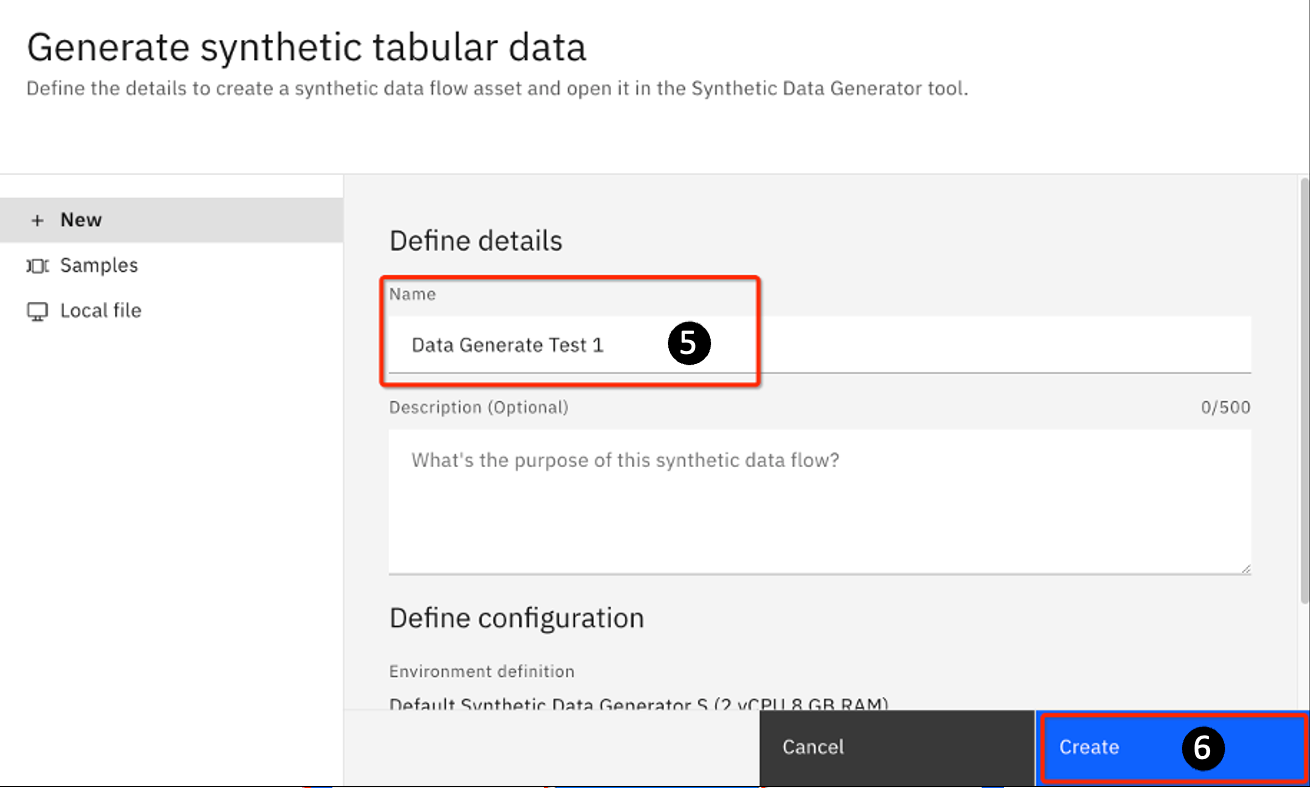
On the next panel, provide a name such as Data Generate Test 1. You can also optionally provide a description in the Description field.
-
Click Create.
You will see the following message:
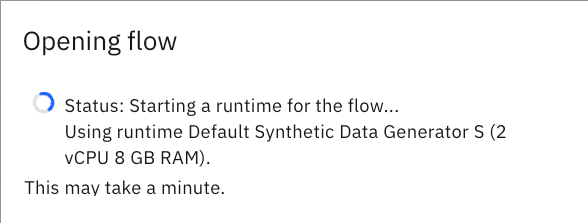
As noted in the message, this process may take a few minutes.
Note: sometimes the process may fail. If so, retry by clicking Create again.
-
On the subsequent panel, click on the First time user tile.
-
Click Continue.
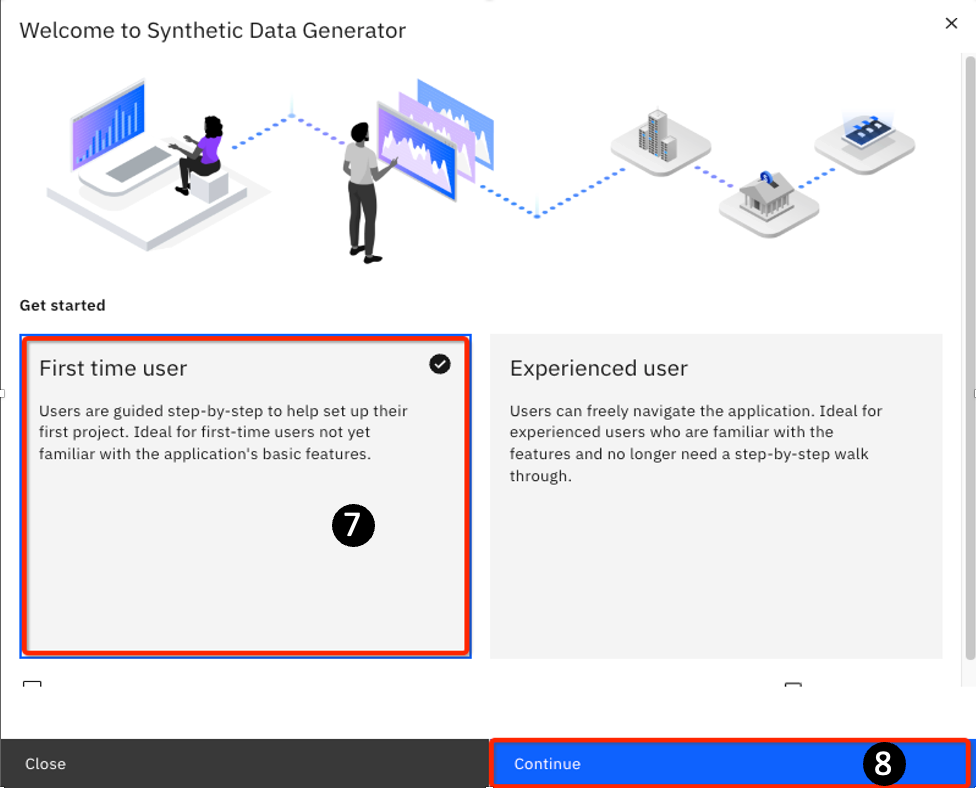
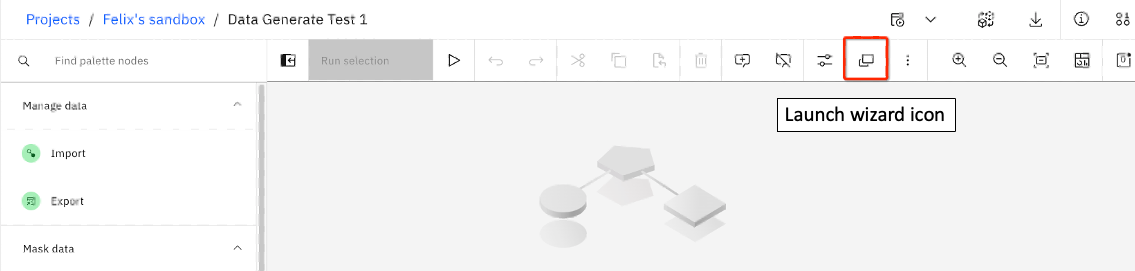
If you click on the Experienced user tile and then click Continue, you will be taken to the Synthetic data generation canvas tool for data generation. You can always come back to
the Welcome to Synthetic Data Generator wizard by clicking on the Launch wizard icon (you may need to scroll or expand your window to see this icon)
-
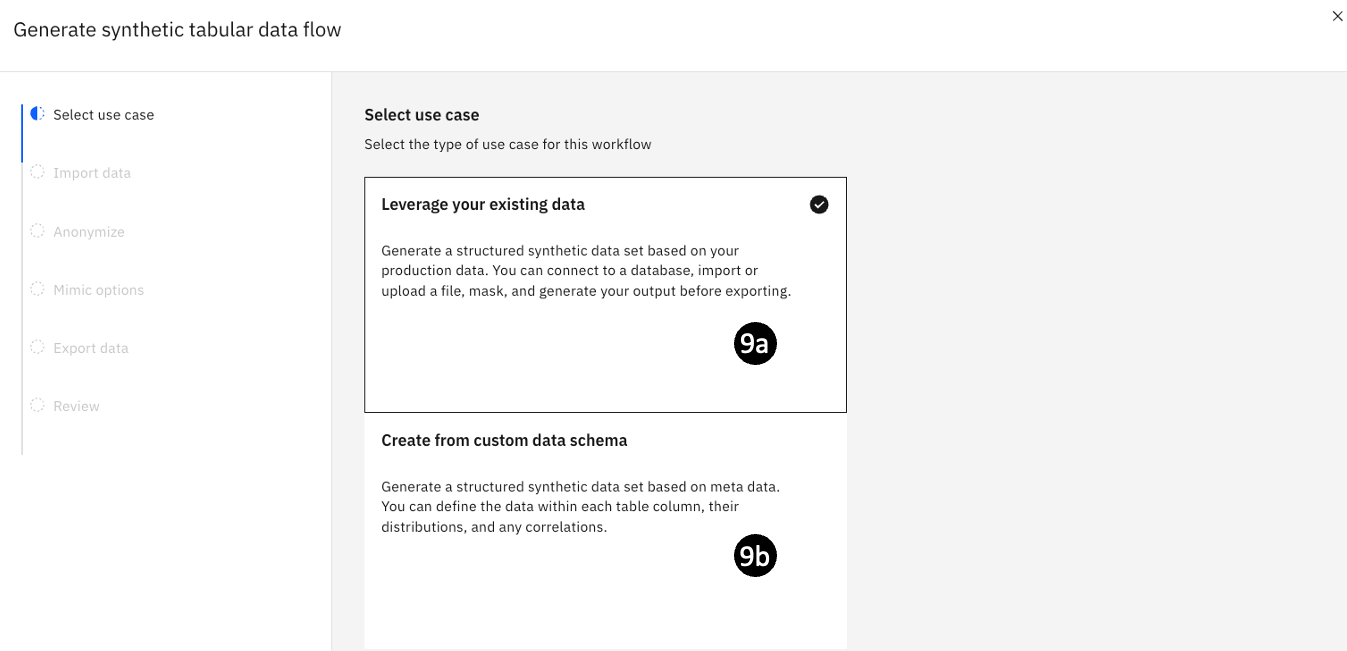
If you select the First-time user tile, you will see a panel showing 2 tiled options:
- Leverage your existing data – Use this to leverage existing data sets and
generate new synthetic data that resembles (but does not include) your existing
data. This is an easy way to generate data that is compatible with a specific
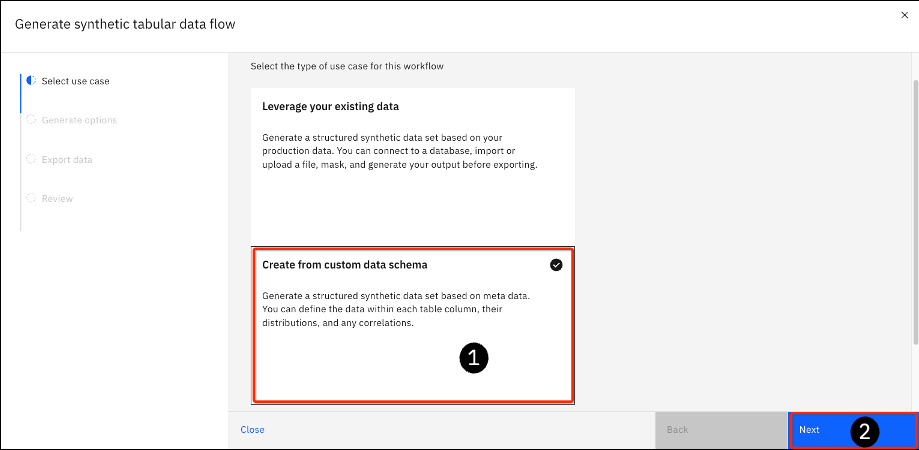
schema. - Create from custom data schema – Use this to create your own table schema
and populate it with synthetic data.
- Leverage your existing data – Use this to leverage existing data sets and
You will try both methods in this lab.
Don't select any options yet.
Create synthetic data by defining customized data schema
In this section, you will create synthetic data from scratch.
-
From the last step from the previous section, click on the Create from custom data schema tile.
-
Click Next.
-
The Generate synthetic tabular data flow page opens. You can set the number of rows to generate – the default is 100,000 rows.
-
You can also define the columns (the schema) of the table.
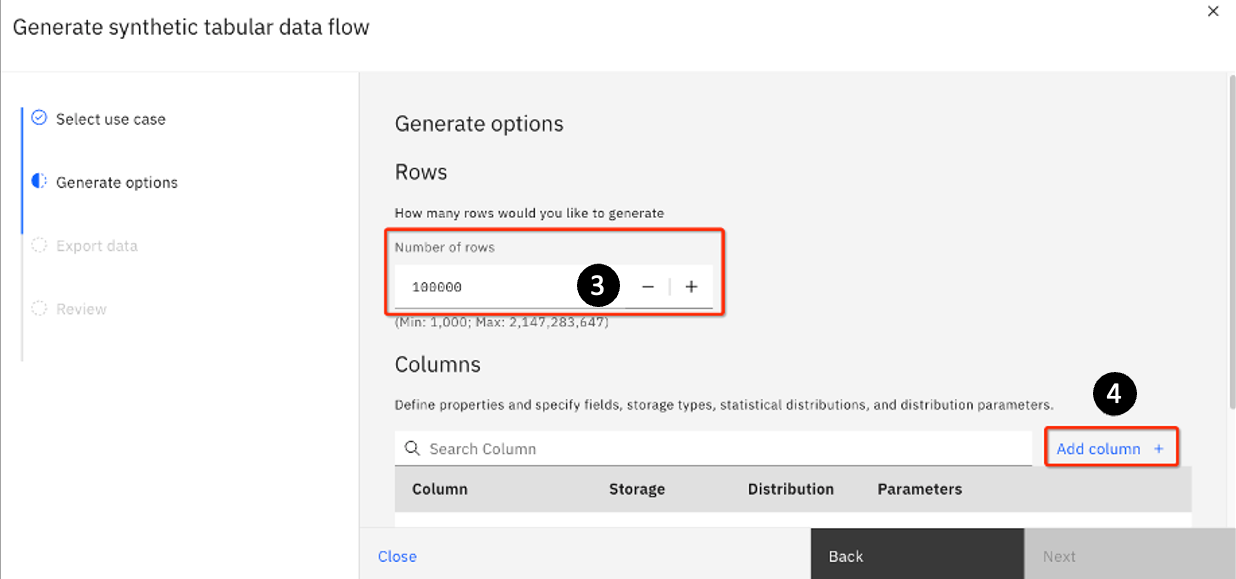
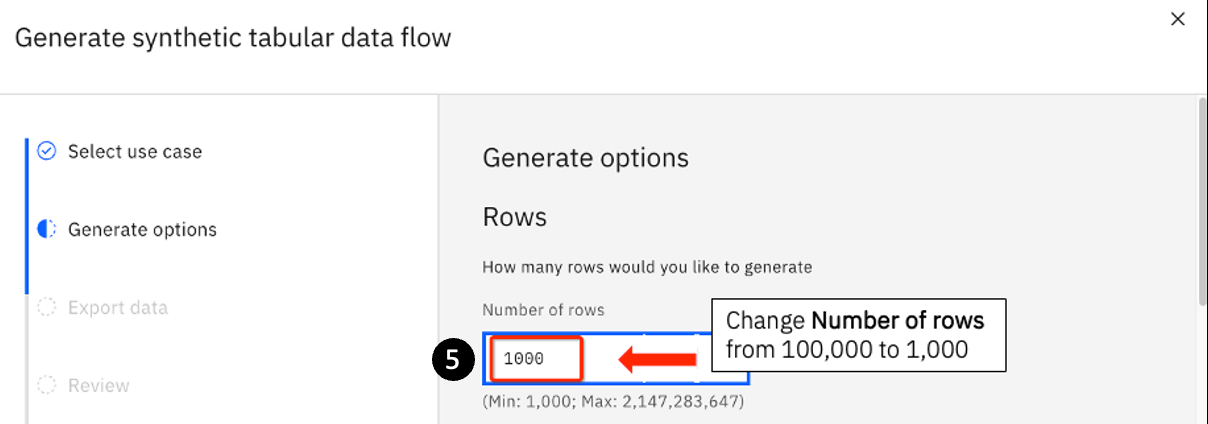
- By default, watsonx.ai will generate 100,000 rows. For this exercise, change the Number of rows field to the minimum number allowed: 1,000.
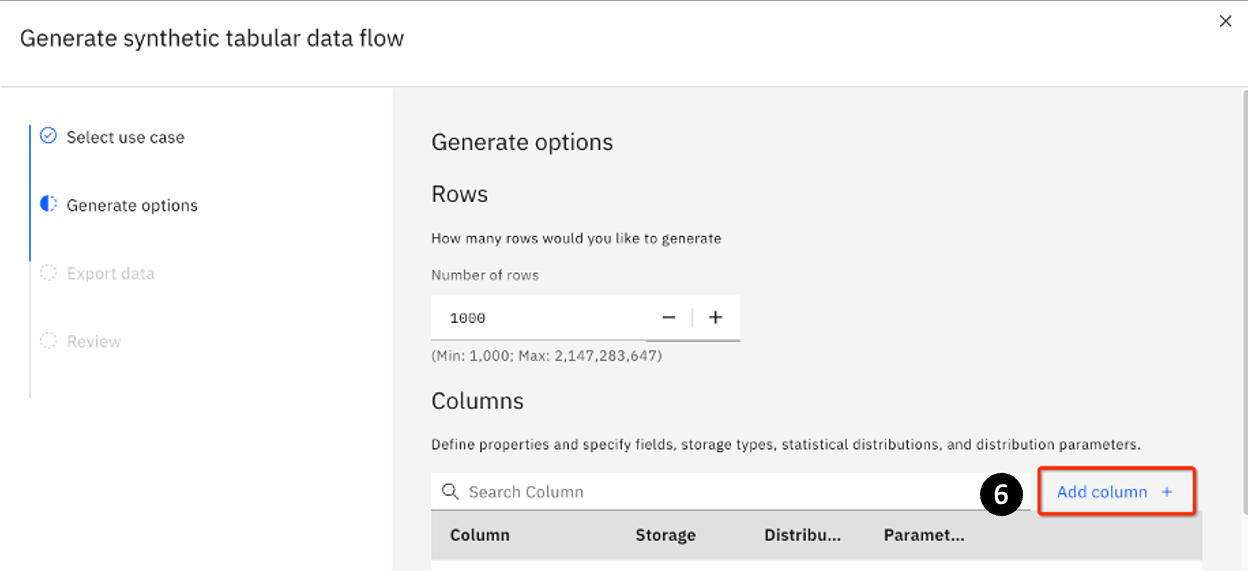
- Now you will start to define columns. You will define a simple table with an employee's last name, age, and salary range.
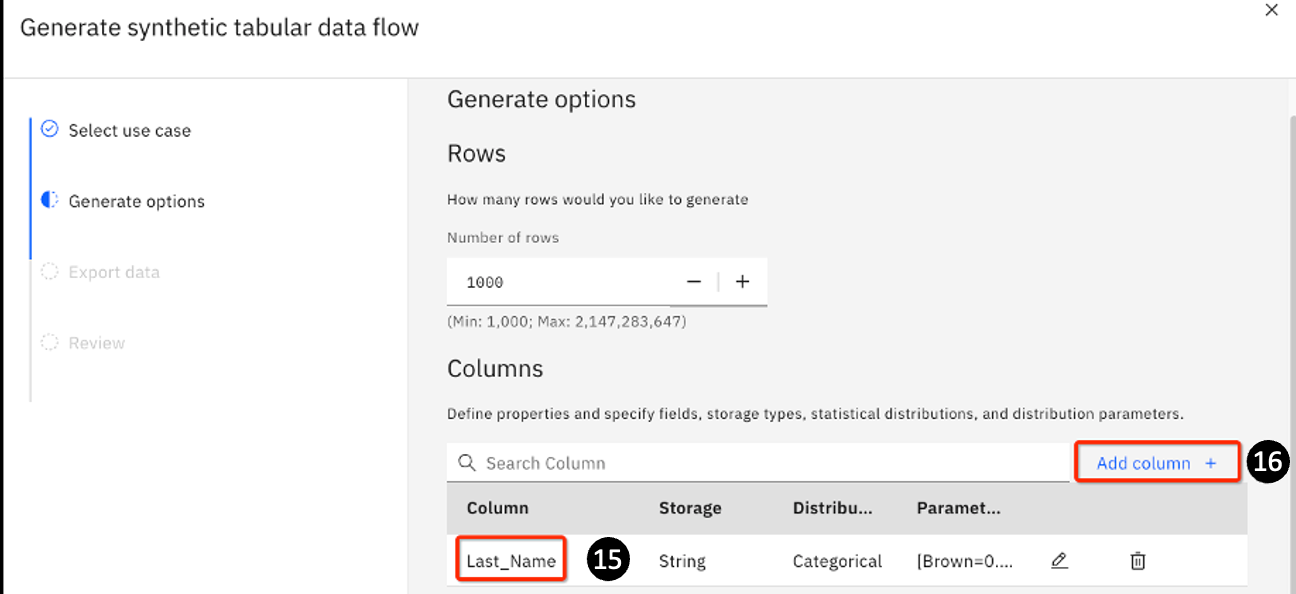
On this panel, click Add column +.
The following panel appears. Fill in the first 3 fields as follows:
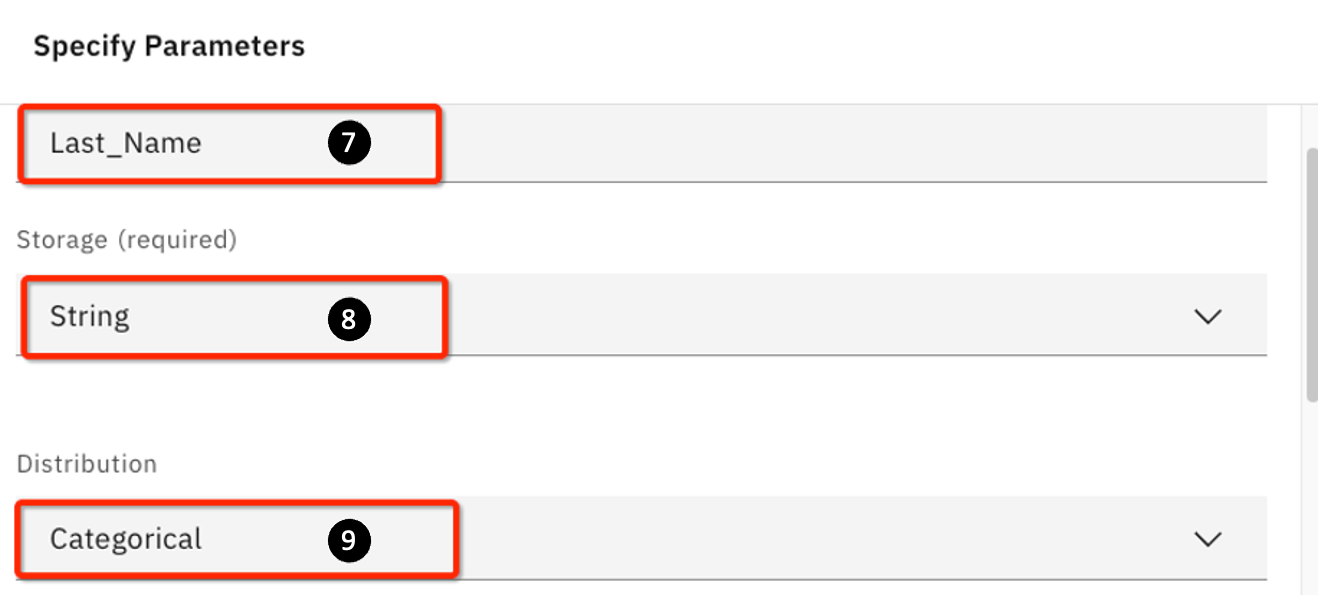
- Column: Enter
Last_Name - Storage: Select Enter
Stringfrom the drop-down list - Distribution: Select
Categoricalfrom the drop-down list
Since you are defining a string column, the Distribution is simply a categorical list of last names. In this case, watsonx.ai is asking you to provide a list of possible outcomes (here is a list of last names, in general, it would be whatever valid values that a string variable can take on). You will need to provide a list and the probability value for each item on that list; the sum must be 1.0.
When you scroll further down, you will see fields for Value and Probability. For the first name of the category, enter the following values:
- For Value: Enter
Brown. - For Probability: Enter
0.075.
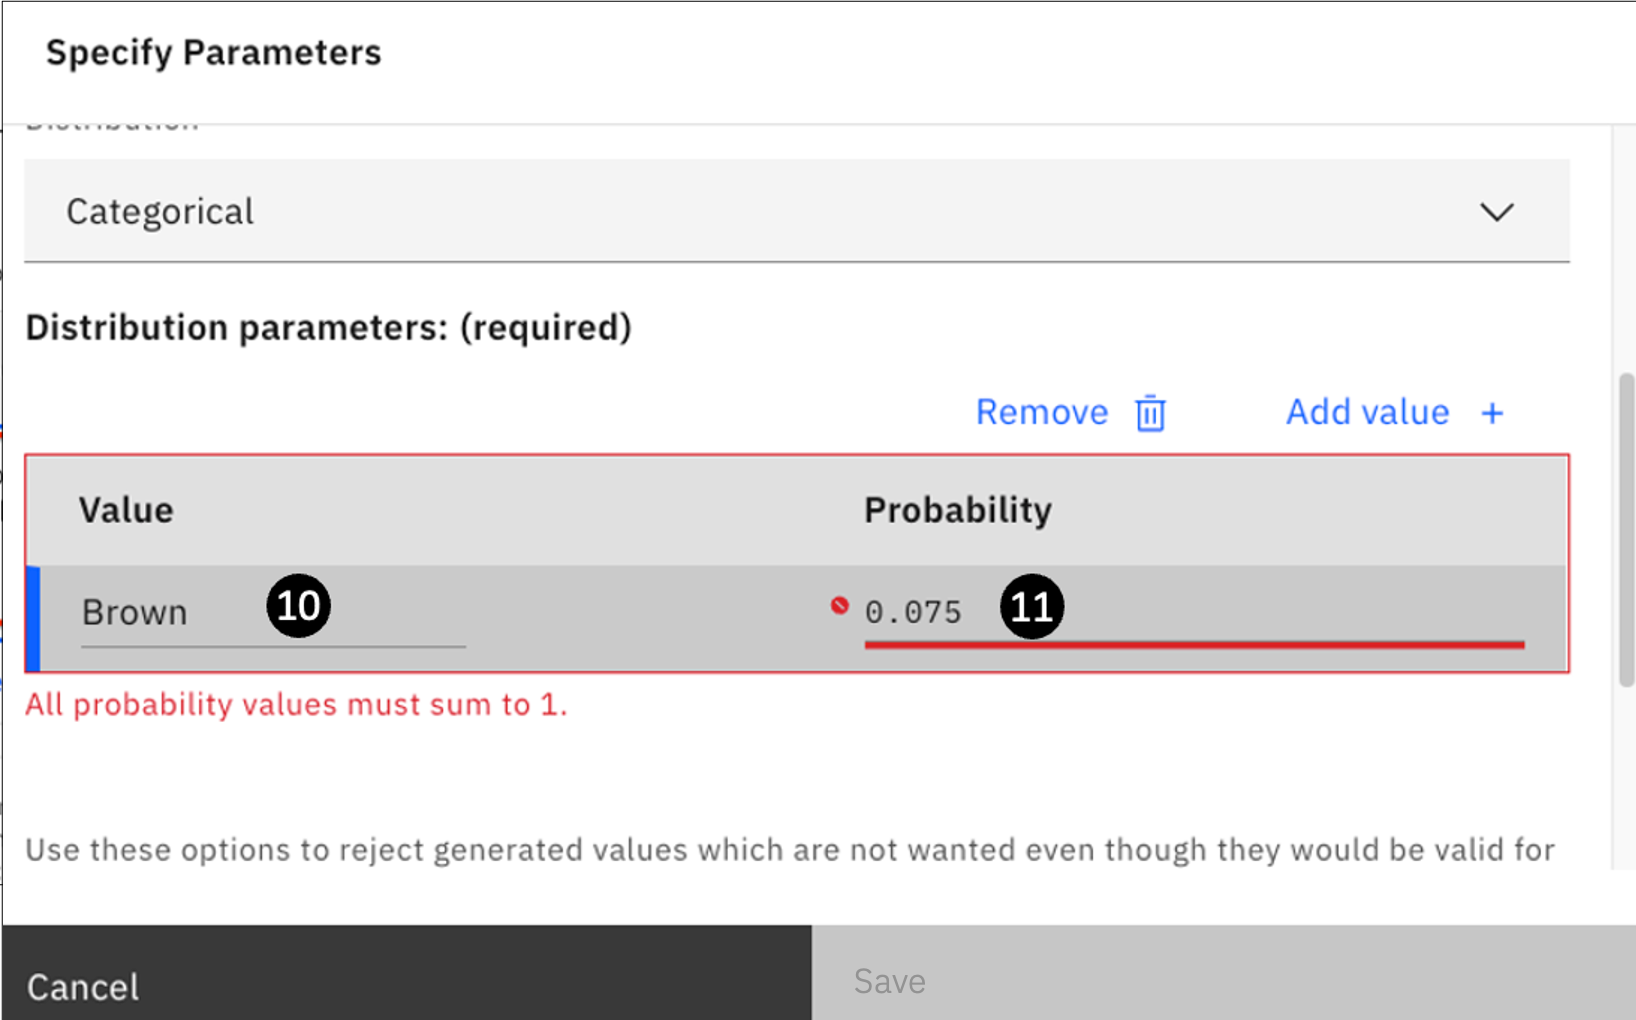
- Notice that the Save button is still grayed out. The reason is stated in red above: All probability values must sum to 1. You will need to keep adding additional values until all the probability adds up to 1.0.
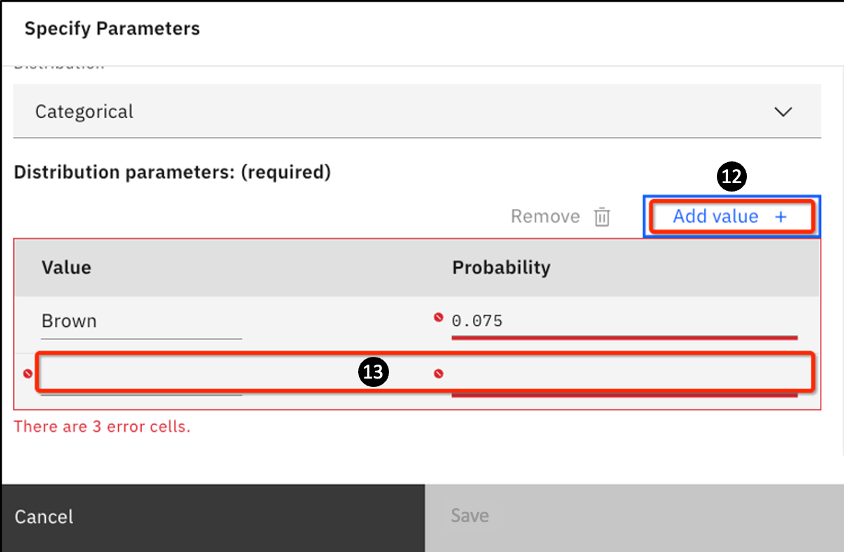
Click on Add value +.
- A new row will be added, which you will fill in next.
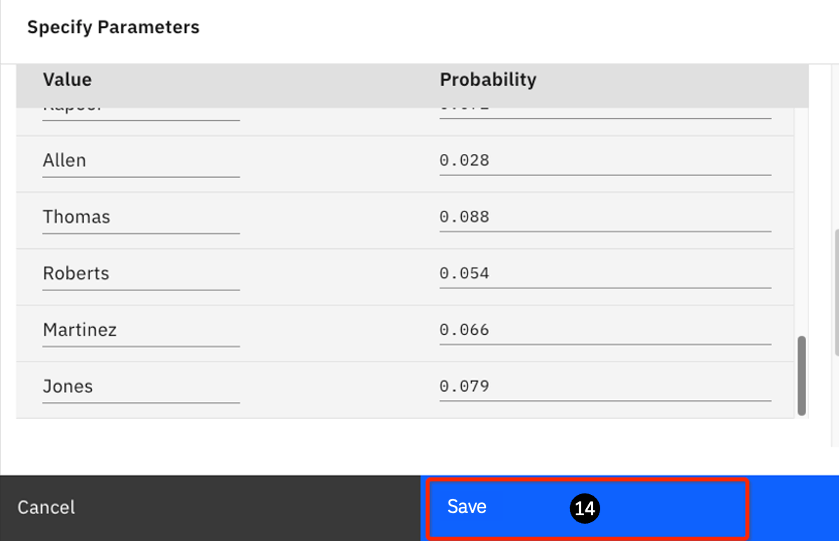
Carefully add all the values in the following table (they add up to a total of 20 last names); remember you already added the Brown row.
Brown0.075Leung0.096Gordan0.054Wilson0.019Newman0.037Duncan0.022Chen0.082Wong0.085Lord0.023Kapoor0.072Muthu0.027Allen0.028Bird0.022Thomas0.088Bentley0.024Roberts0.054James0.018Martinez0.066Abrams0.029Jones0.079Once you have a list with a probability value adding up to 1.0, the Save button will turn blue; if it doesn't you have an error in the Probability numbers ... recheck them.
- Click Save to create the column.
-
You are redirected to the Generate synthetic tabular data flow page. Notice that the Last_Name column is now added.
-
Click **Add column + **to add another column.
Insert the following data:
-
For Column: Enter
Age -
For Storage: Select
Integerfrom the drop-down -
For Distribution: Select
Normalfrom the drop-down
With an integer column, you can optionally use a Categorical distribution (like you did in
Step 9). In that case, you will need to provide a list of ages and the probability of each, similar to what you did with Last_Name. For this lab, you will use a typical normal distribution for number-based items (this is the default assumed by watsonx.ai)
-
Notice that watsonx.ai automatically filled in a mean value of 50.
-
Watsonx.ai also puts in a default Stddev (standard deviation) value of 10. As you are working with a global company, you might want to have a larger spread of data. Keep the mean value for this lab, but change the Stddev to 15 instead of 10.
-
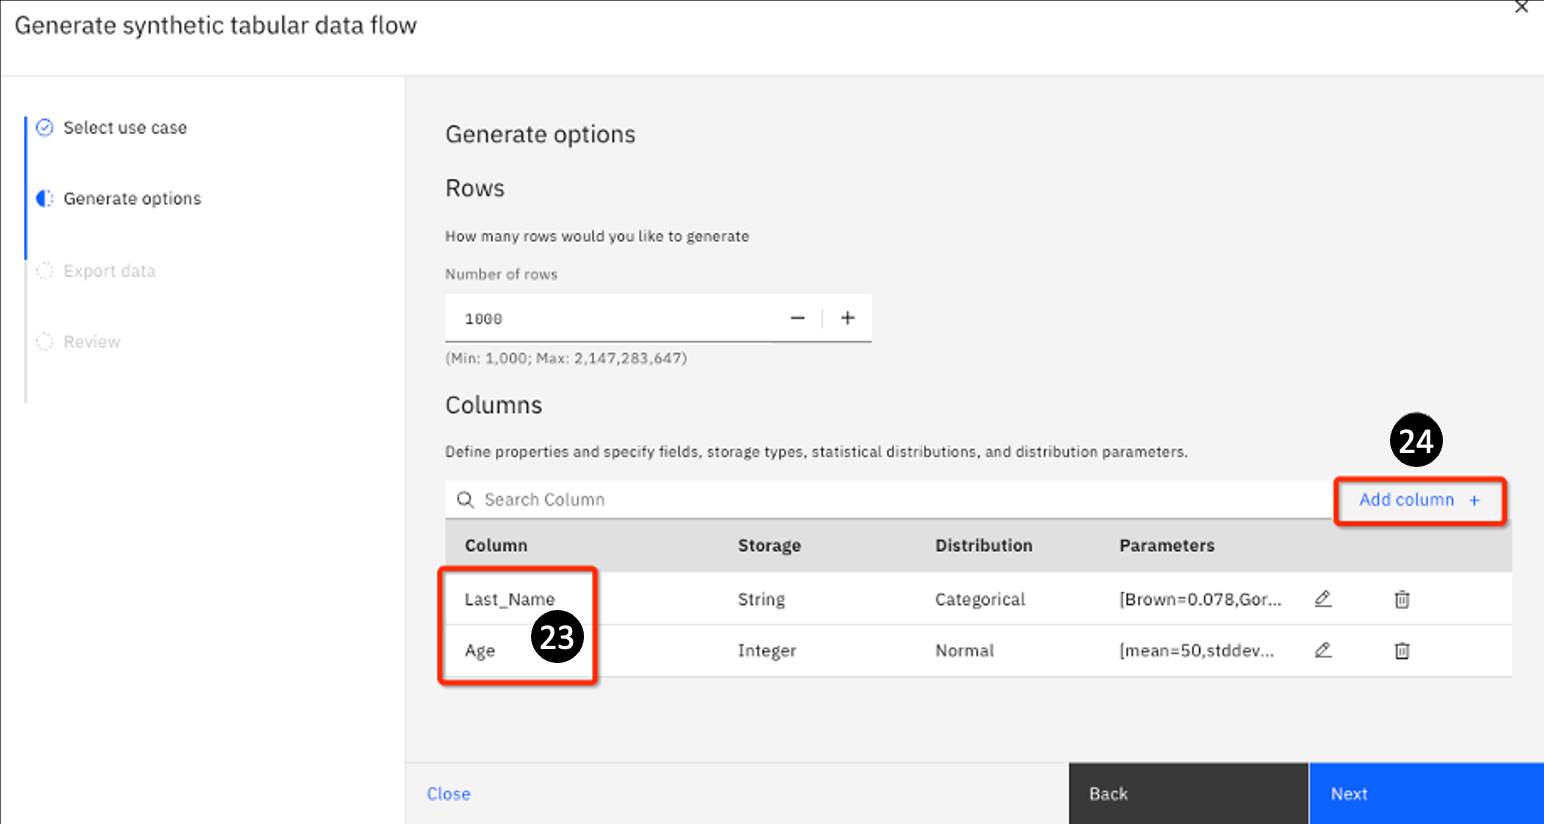
Click Save.
-
The Generate Synthetic tabular data flow reopens. The Last_Name and Age columns are now added.
-
Click Add column+ to add a third and final column.
-
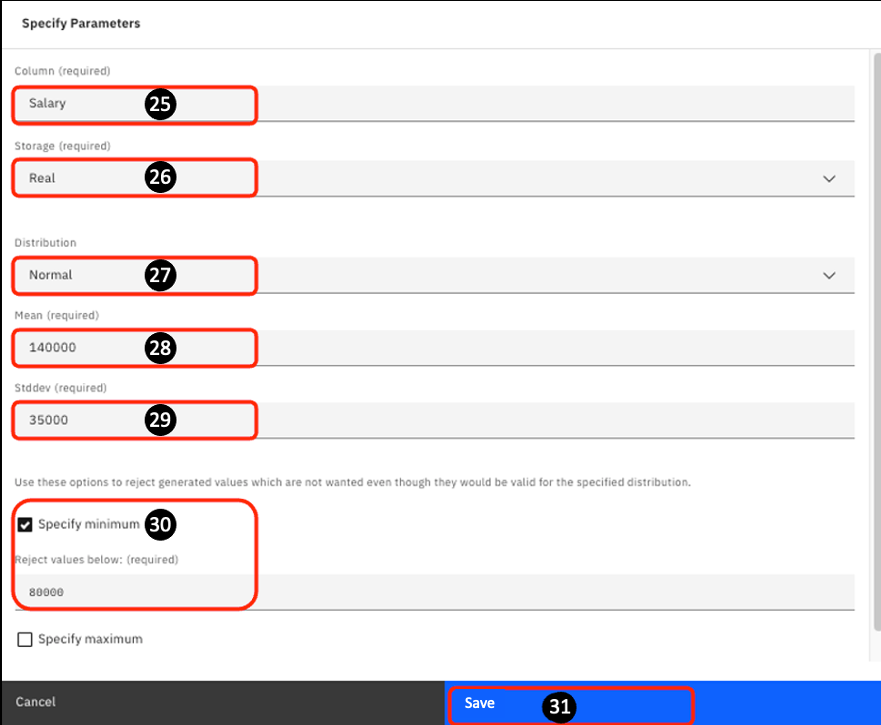
For the last column, use the following values. For Column: Enter
Salary. -
For Storage: Select
Realfrom the drop-down -
For Distribution: Select
Normalfrom the drop-down -
For Mean: Enter
140000 -
For Stddev: Enter
35000 -
Select the Specify minimum check box. Enter
80000for the Reject values below: field.
In this example, you want to ensure that you generate a range where the salary cannot be lower than $80,000. You may want to do this to eliminate a salary that is valid but not desirable. You may also define a maximum. In this lab it is not set.
- Click Save.
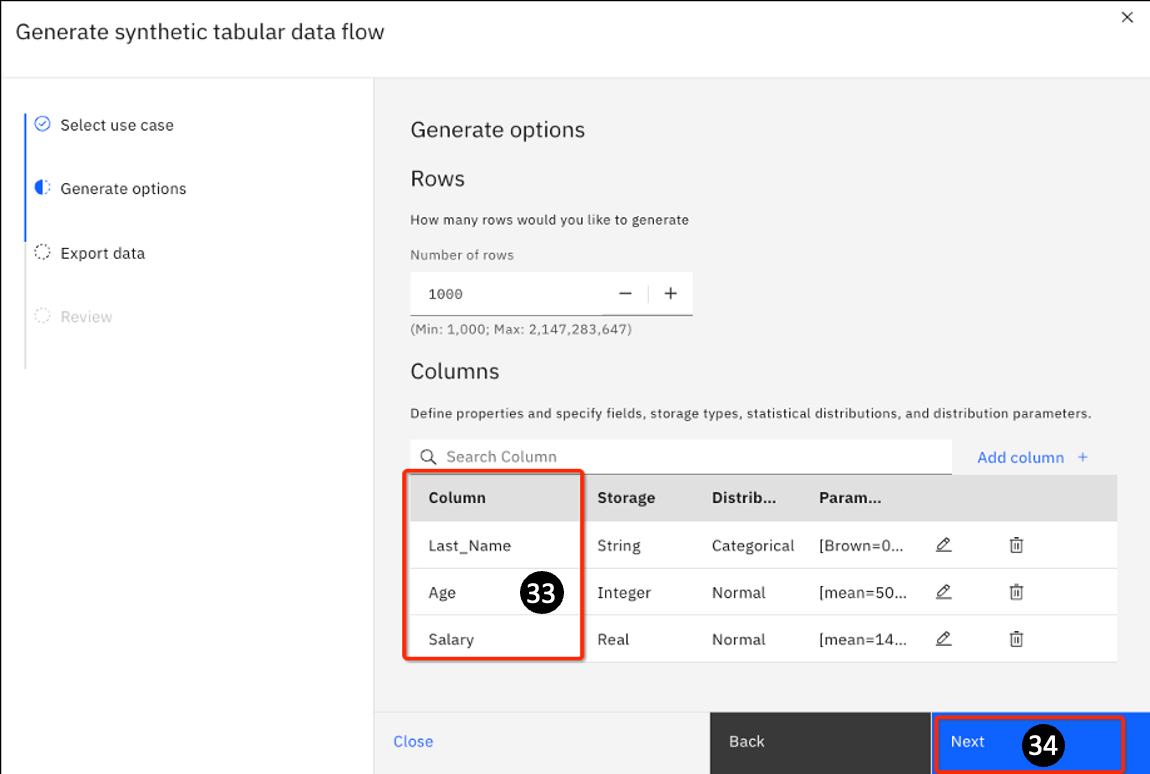
-
You are returned to the Generate synthetic tabular data flow page. You now see all 3 columns you defined have been added.
-
Click Next to generate the data.
-
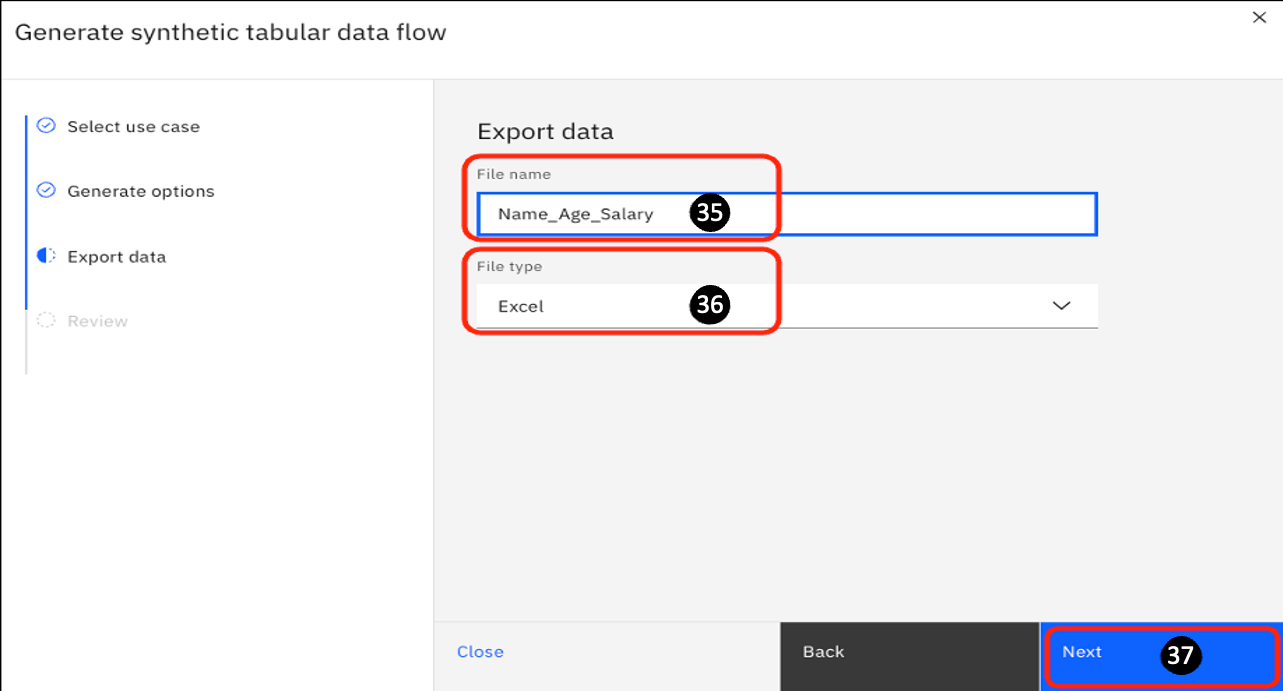
On the next panel, you can specify the output File name. Change it to Name_Age_Salary.
-
Click on the File Type drop-down and select Excel.
-
Click Next.
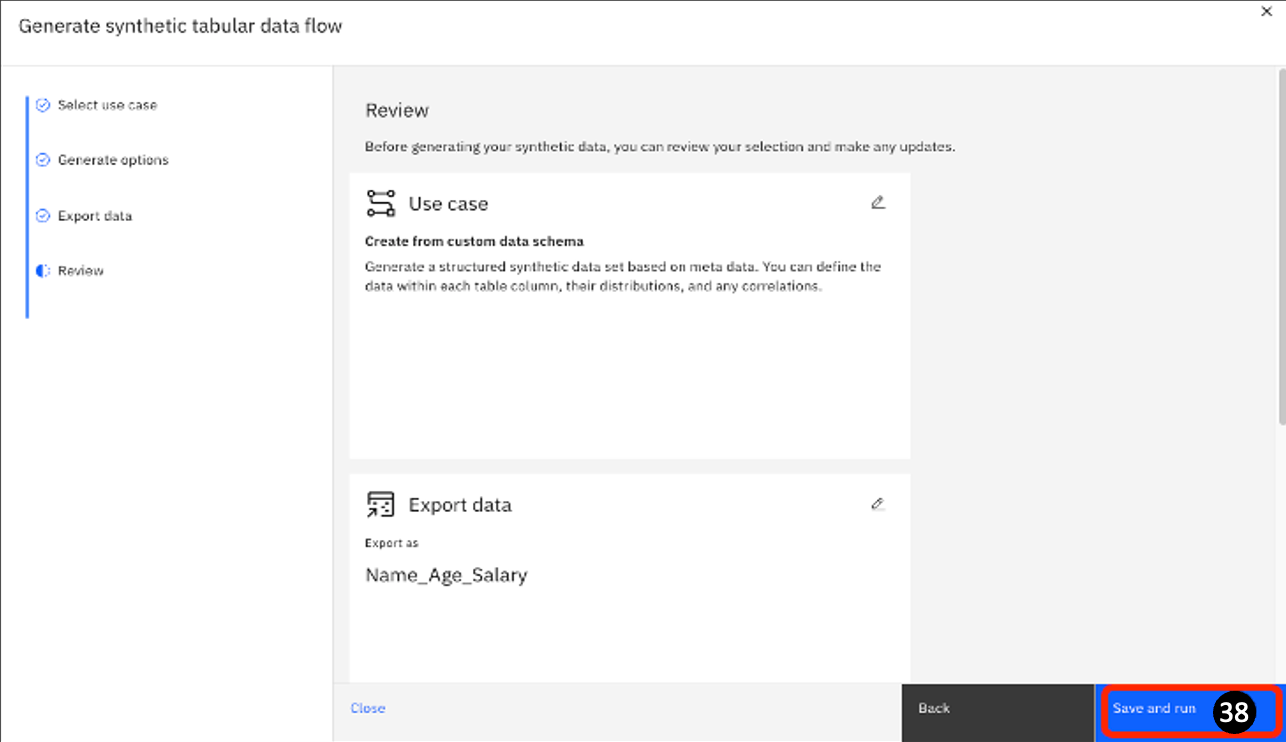
- On the next page, review the information. If it is correct, click Save and run.
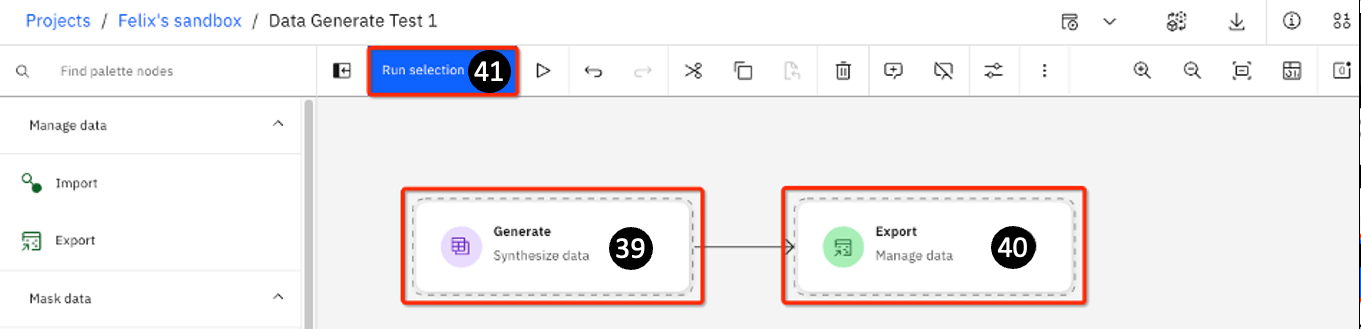
The next page shows a graphical representation of the synthetic data generation tasks. There are 3 main areas:
-
Generate – this is where you define how you want to generate your data.
-
Export – this is where you define how you want to export your output; in this lab (Step 1) you selected the output to be an Excel file with the name Name_Age_Salary.xls.
When you click on Generate and Export, you will see that dotted lines will now surround
both actions.
- Run selection – you can separately highlight the Generate and Export icons to run the code individually (you will need to first run Generate pipeline before you can run Export). In most cases, simply select both of the icons to first Generate and then Export the generated data in one single pass.
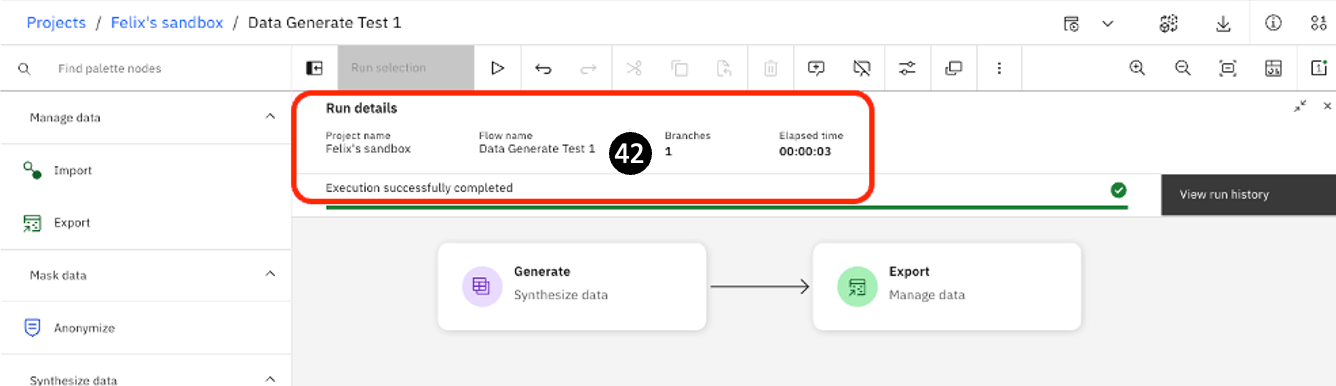
- The pipeline will take some seconds to run (it can vary depending on the availability of resources – anywhere from several seconds to tens of seconds, so be patient if it takes a little longer).
You will see a quick summary with the Run details.
- Go to the breadcrumb (top left) and click on your project.
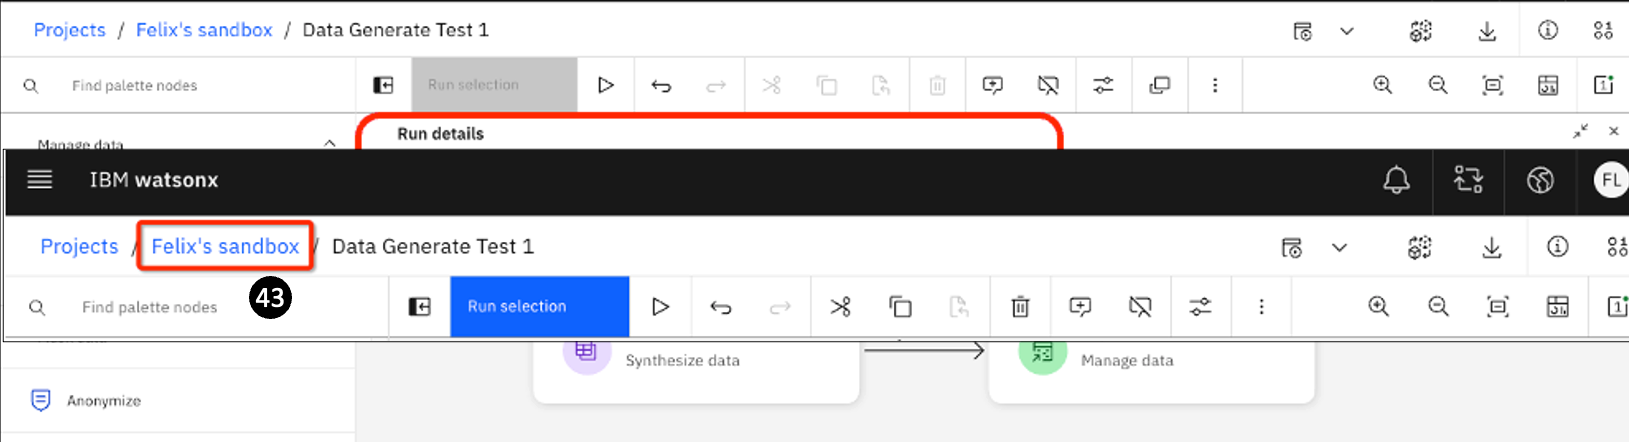
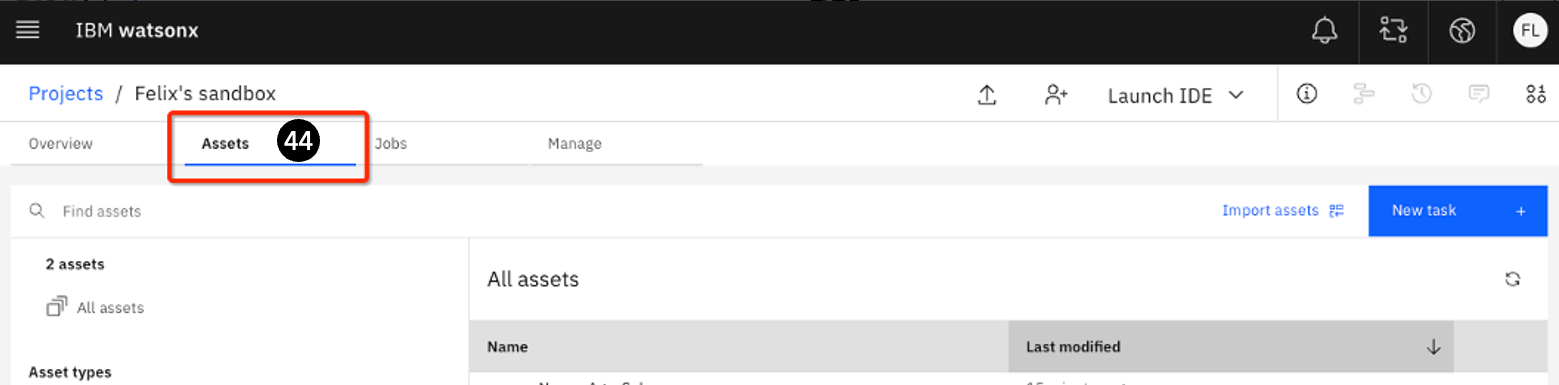
Watsonx.ai should open up in your project's Assets tab.
- If not, select the Assets tab.
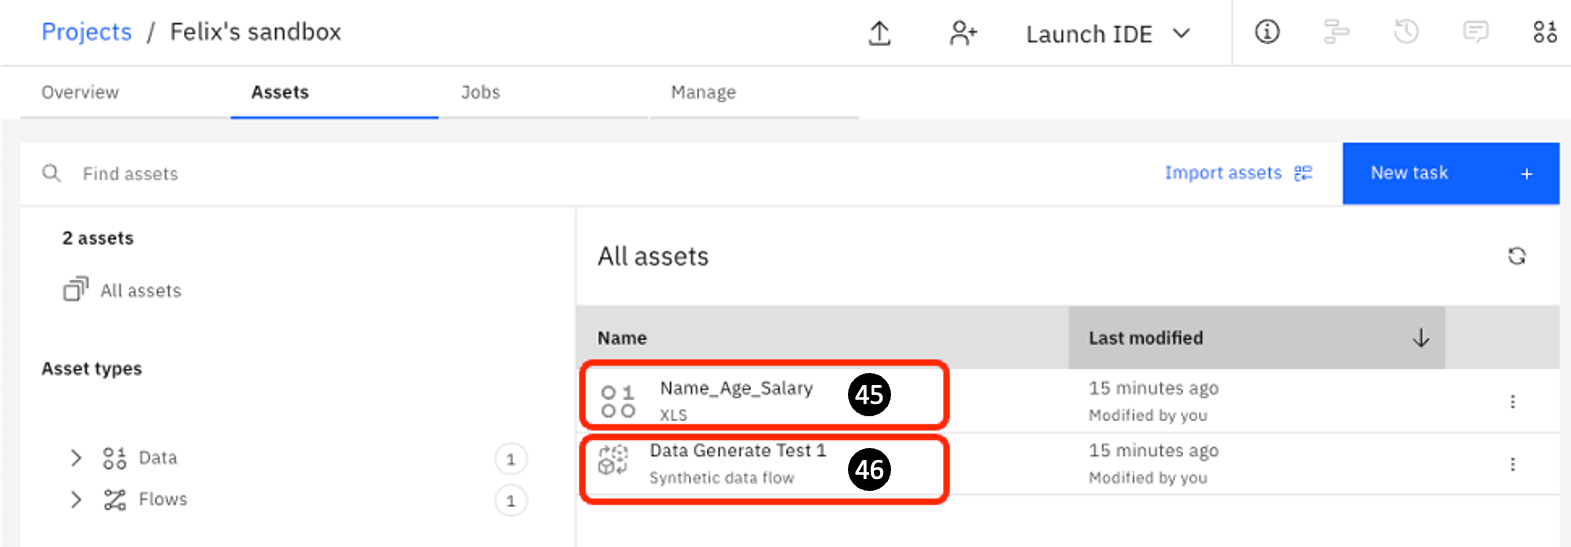
You will see the following (you may have other assets):
-
Name_Age_Salary.xls... the name of the
xlsfile. -
Data Generate Test 1 ... the name of the Synthetic data flow specified in Step 5 of this lab.
Using watsonx.ai to examine and update your synthetic data
One of the key points in generating synthetic data is how closely the data resembles real-life
data. It is important to keep in mind that to the AI model, there is no inherent meaning in Last_Name, Age, and Salary. These are simply tokens used. This means that it can sometimes
generate data that is “valid” but perhaps makes little sense (or quite unlikely in real life).
In the last section, you generated a Name_Age_Salary.xls file with 1000 rows of synthetic data. This data was generated randomly, so your data may not have the same entries as highlighted below; although if you look carefully, the same type of issues are probably present.
Here are some generated data that clearly exhibit various issues.
- There are 2 names with age 0, 8 names with age < 10, and 30 names < 20. Certainly, you would want to remedy this.
- At the other extreme, there are 28 names of age > 75, with 3 of them older than 90. You probably want to also remedy this.
- One more subtle issue is that many older employees are making a lot less than younger employees. This is possible but the distribution simply looks unreal.
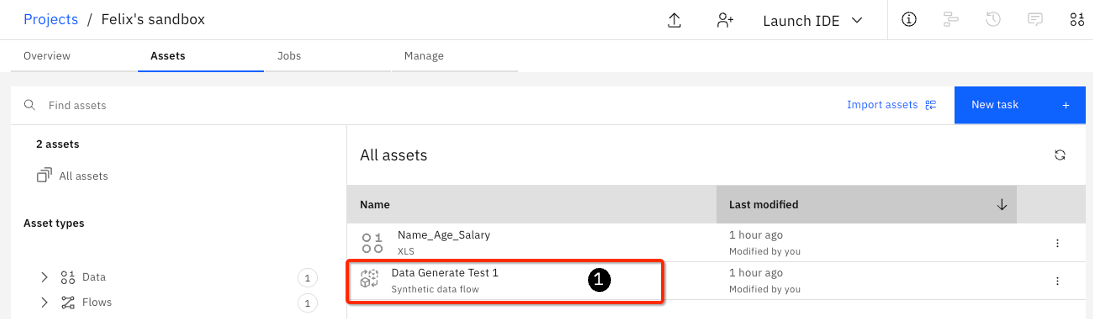
In this section, you will look at how to use watsonx.ai to generate better data.
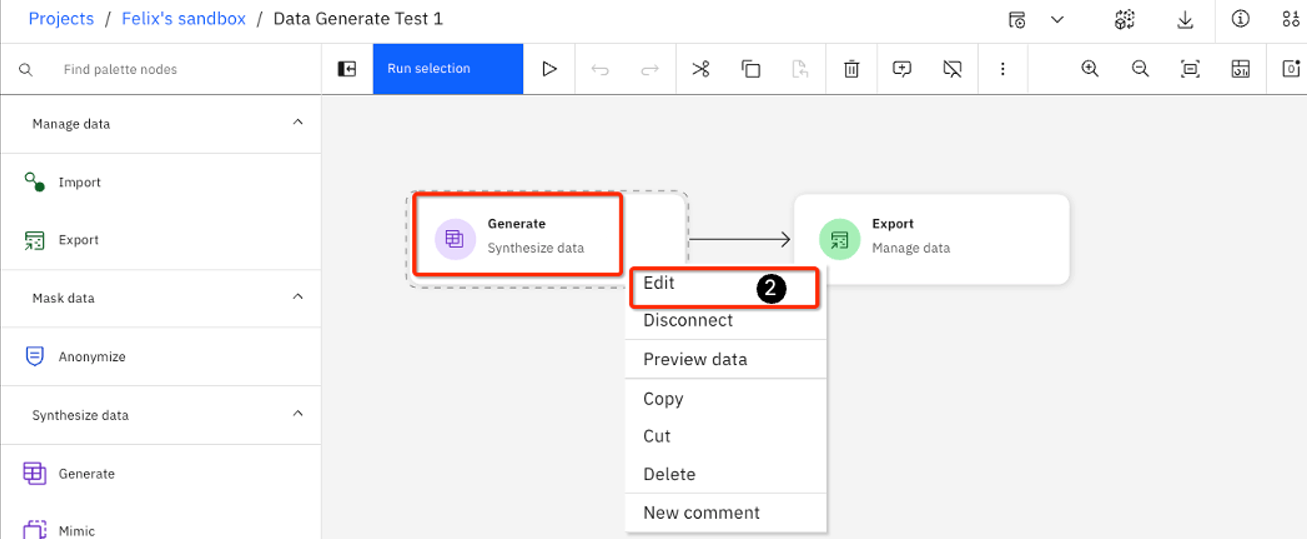
- Ensure you are in the Assets tab of your project and click the Data Generate Test 1 asset.
- The Flow page opens. Hover over Generate to display 3 vertical dots, then click on them and select Edit.
- Click on the pencil icon for the Age row.
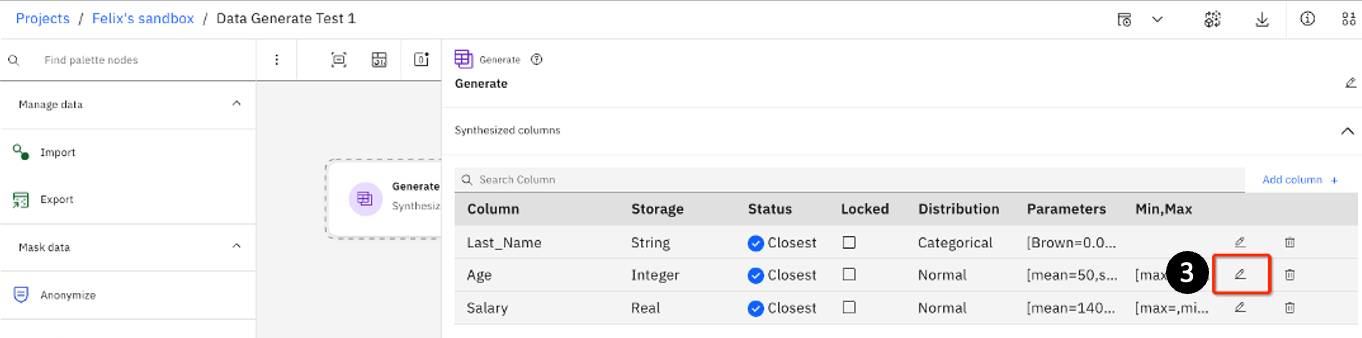
-
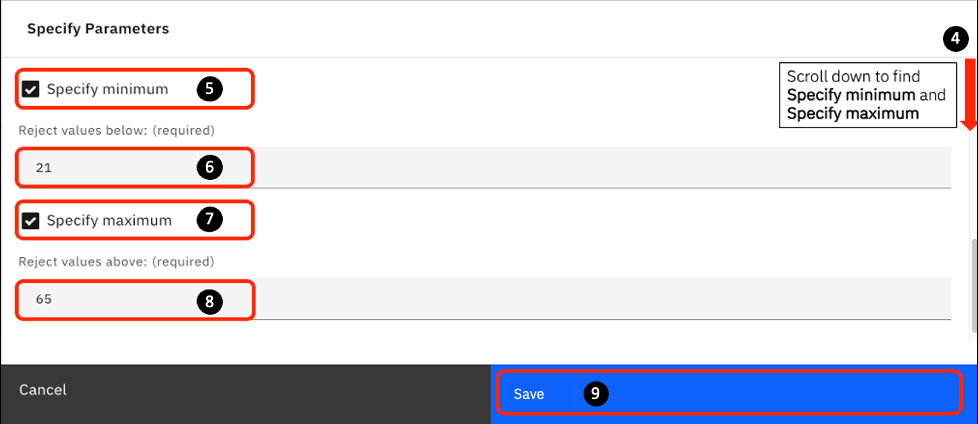
The Specify parameters page opens. Scroll down to find the Specify minimum, and Specify maximum checkboxes.
-
Select the Specify minimum checkbox.
-
For Reject values below: Enter 21.
-
Select the Specify maximum checkbox
-
For Reject values above: Enter 65.
-
Click Save.
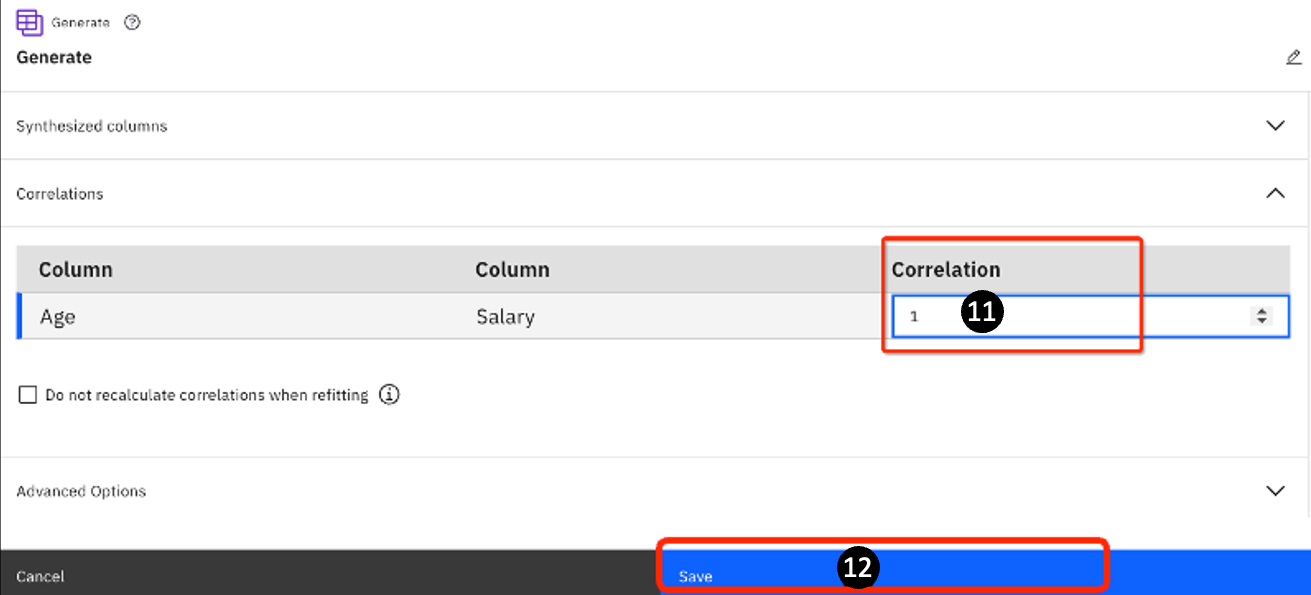
- The Generate page opens. Click on Correlation.
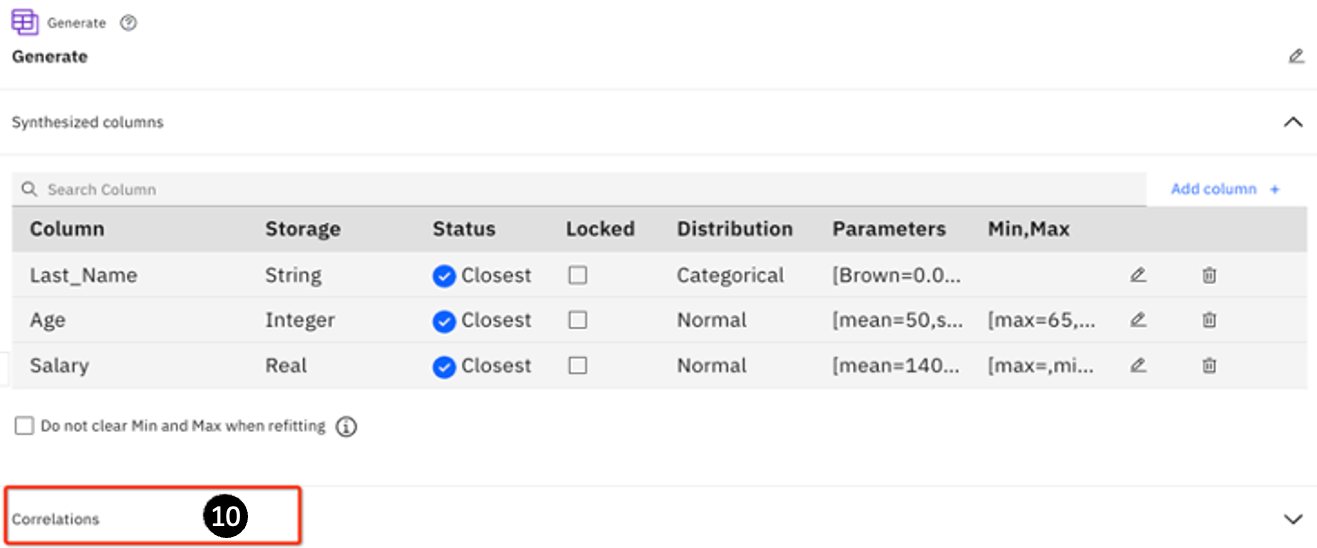
-
Watsonx.ai automatically finds the columns that can correlate: Age and Salary (there is no correlation between a String and a number). Notice that initially the value of Correlation is set to 0 – meaning that there is no correlation. Change the value to 1.
-
Click Save.
-
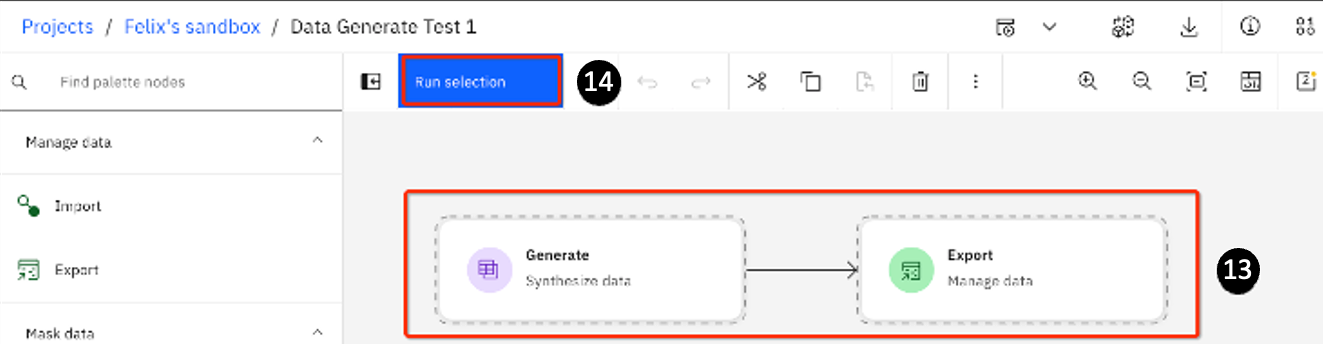
The Data Generate Test 1 page opens. Click both Generate and Export.
-
Click Run selection.
- Click on your project's name on the breadcrumb.
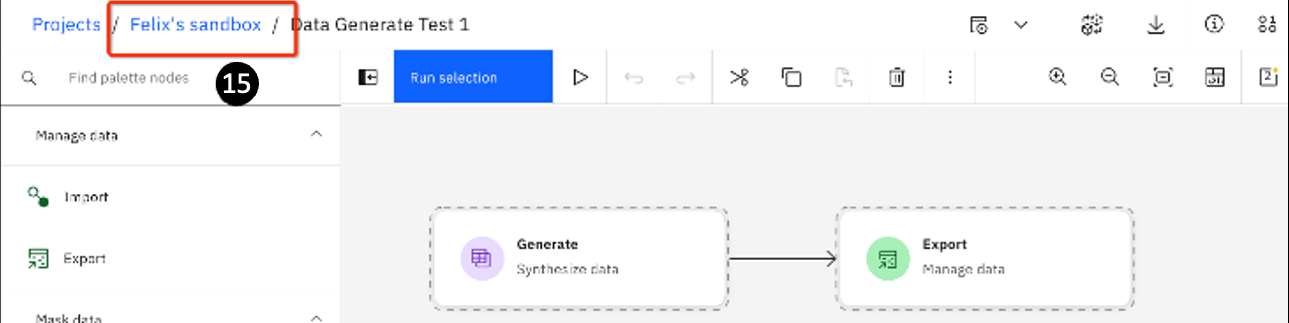
-
Your project should open in the Assets tab. If not, select the Assets tab. You should see the newly exported Name_Age_Salary.xls file. Click on this file to open it. When you examine the file, the previous issues with employees being too young (< 16) and too old (> 65) are gone.
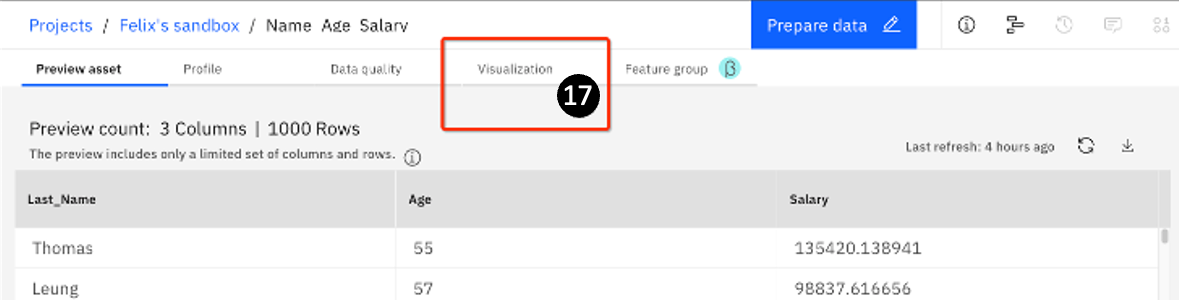
-
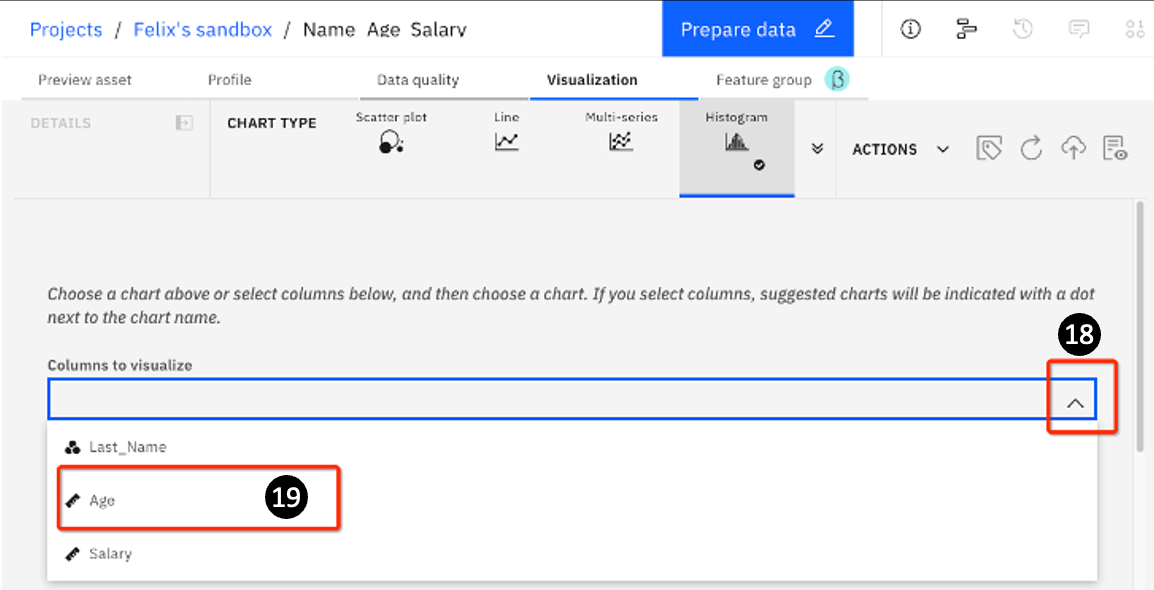
Click Visualization on the Name_Age_Salary preview page.
-
On the Visualization page, click the Columns to visualize drop-down.
-
Select Age.
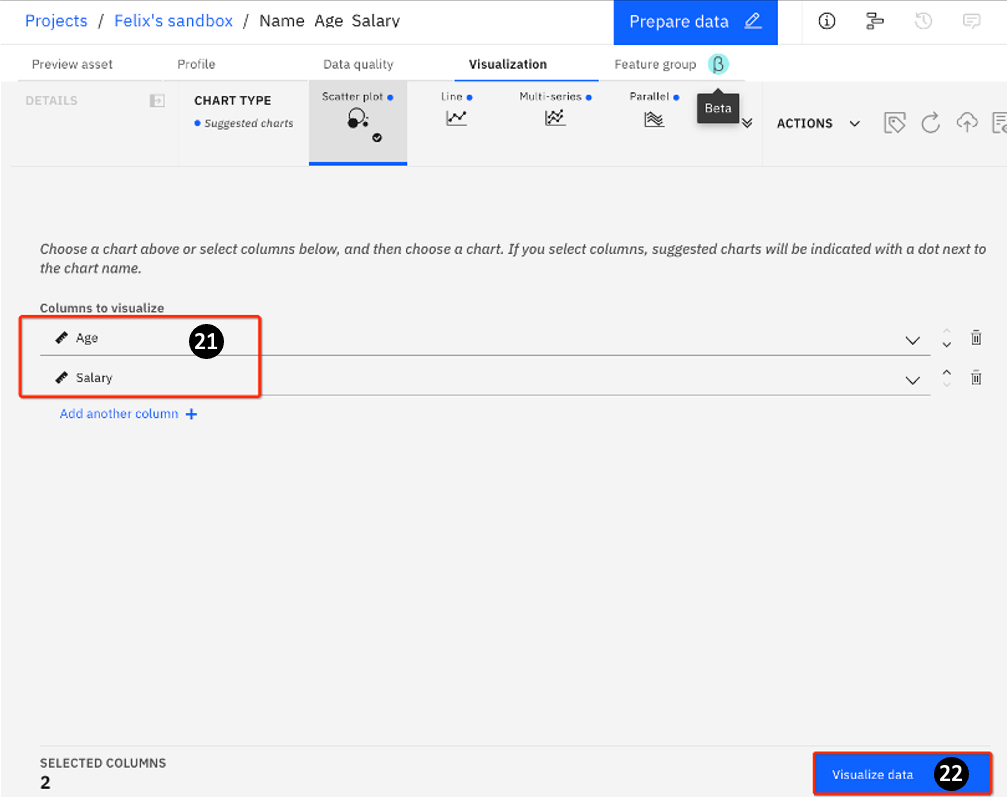
- Click Add another column +, then repeat Step 10 to add a Salary column:
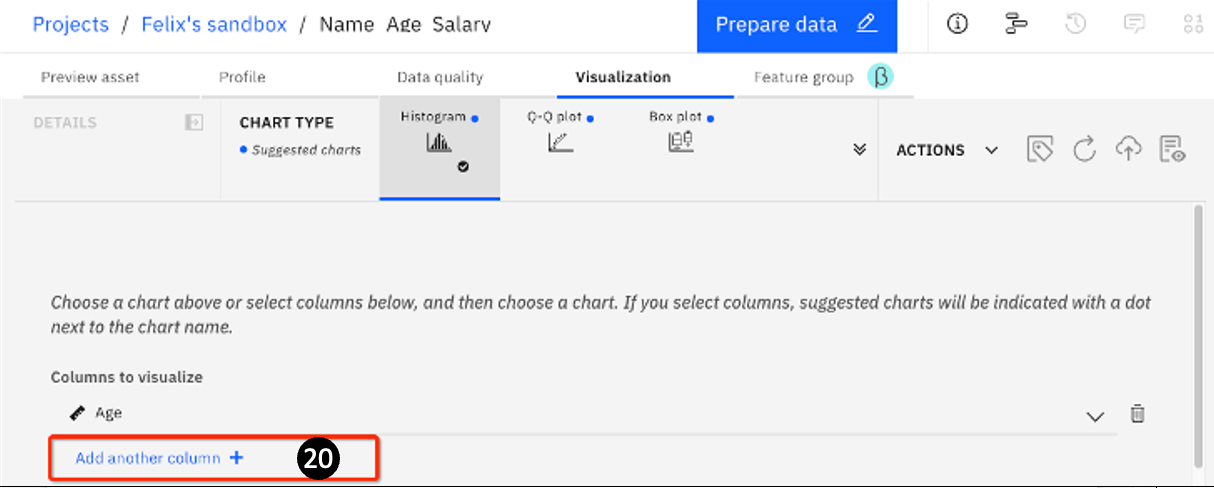
-
You now have both the Age and Salary columns added.
-
Click Visualize data.
- You will see something similar to this:
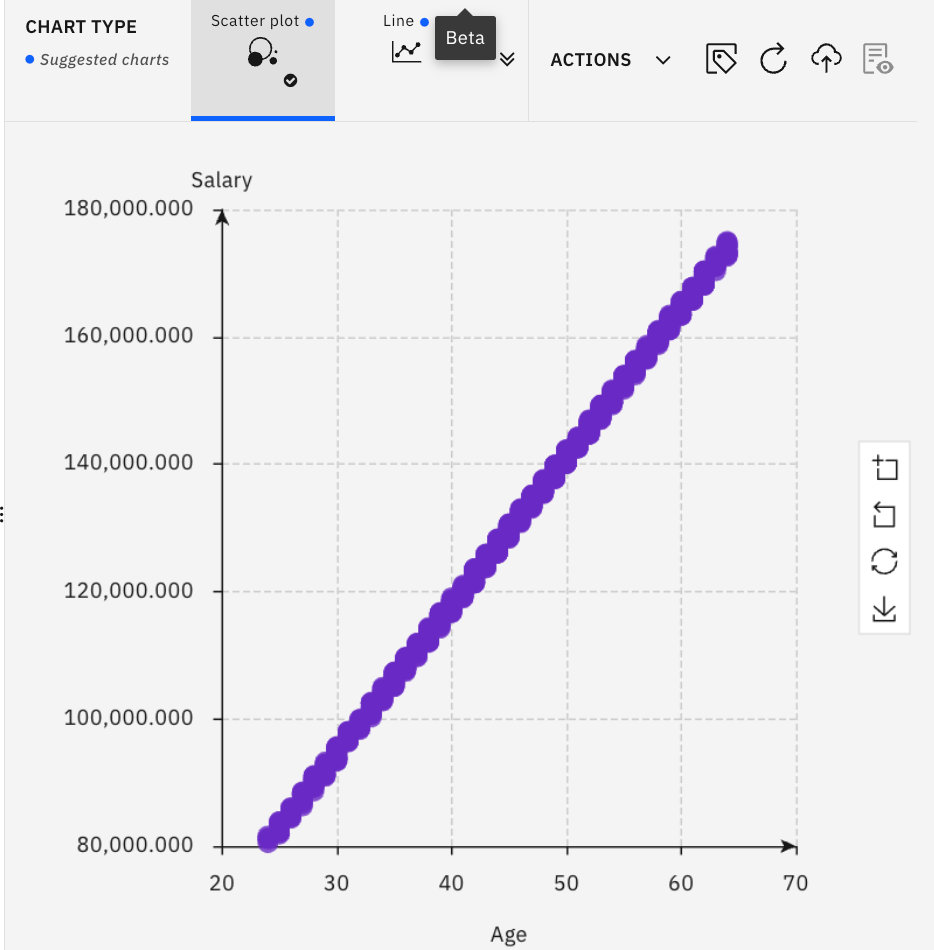
Looking at this though, it does NOT look realistic – because this is a perfect correlation – meaning that the older you get, the higher your salary. While this may be a general trend, experience tells you that it is not realistic. You need something with more variance.
- You realize that setting the value for Correlation to 1 previously is the problem. To get a more realistic set of data, repeat Steps 5-13. This time setting the value of Correlation to 0.8 in Step 5. Run through Steps 6-13 to re-generate and visualize the data again.
Now, you should see a scatter plot looking similar to this:
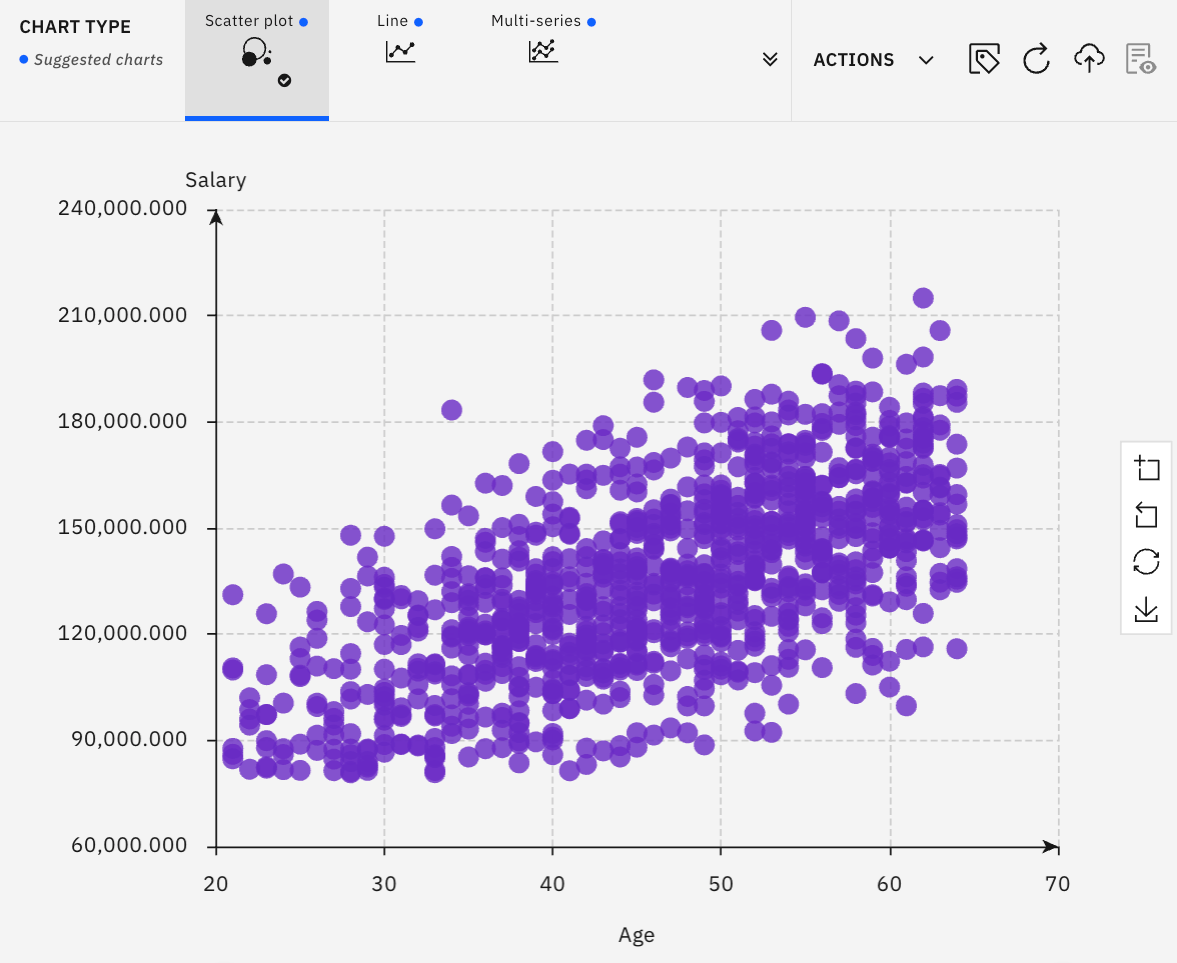
You can other values such as 0.7 if you want. However, this set of data looks reasonable to be used.
Section summary
In this section, you generated synthetic data to your specifications. IBM watsonx.ai provides a
wide range of capabilities – allowing you to control how the data can be generated, including:
- Columns of different types: string, integer, real, time, date, timestamp
- Different data distributions: normal, binary, binomial, and categorical. This provides the ability to create data that resembles real-life data.
- You can do “manual” probability assignments to entries. However, keep in mind that as you may be generating hundreds of thousands of rows this can be time-consuming.
- You can define maximum and minimum boundaries for data distribution to reflect real-world data.
- You can define the correlation between different columns to reflect real-world data.
Create synthetic data by mimicking existing data/schema
Another way to generate a large body of synthetic data is by leveraging existing data. In this section, you will provide a small sample to watsonx.ai and generate a large set of synthetic data that resembles the characteristics of your input data (in distribution, correlation, etc.).
Adding a data asset to your sandbox project
- Open the watsonx.ai console and click on the sandbox project.
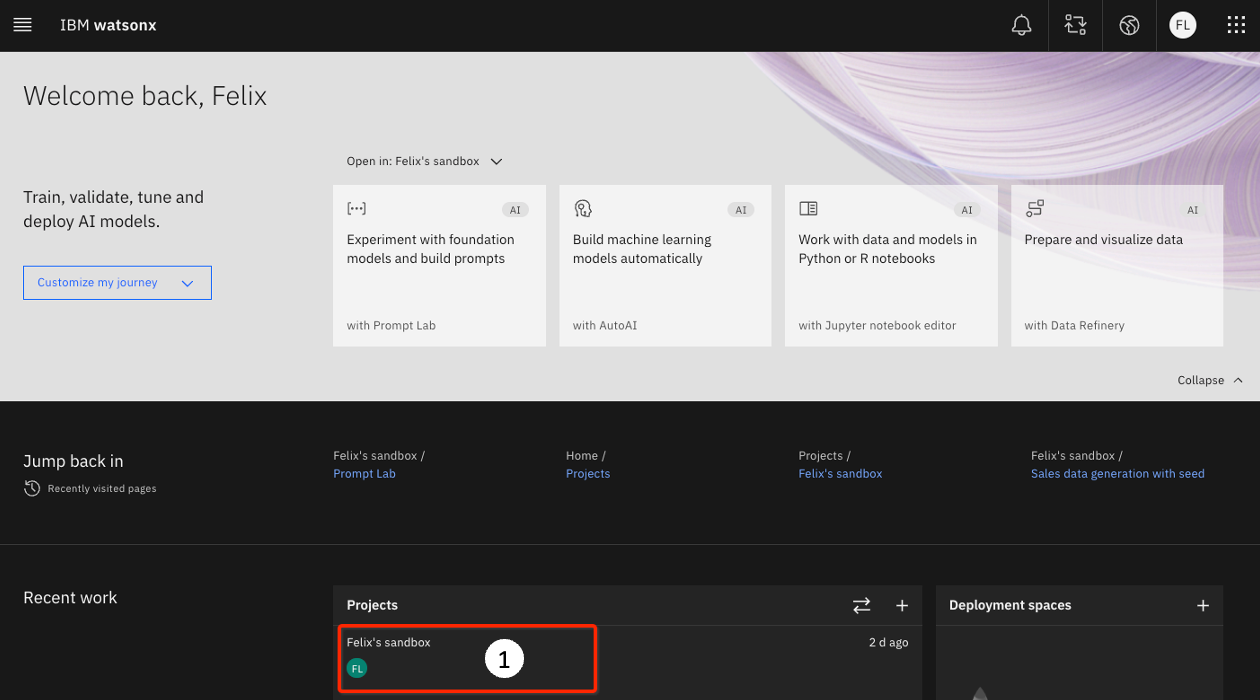
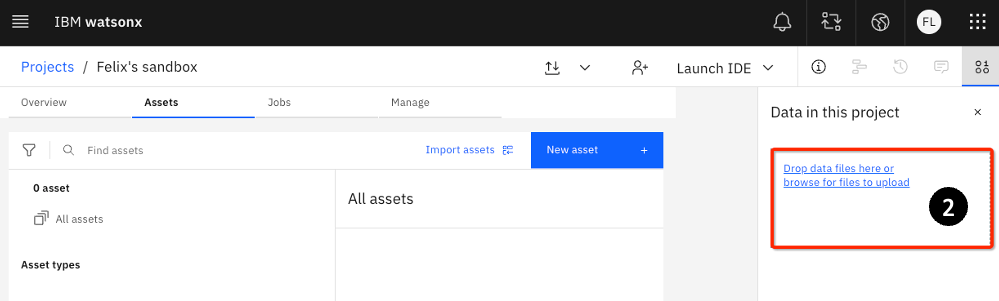
- Download this data asset from this link as a seed file. Store on a local directory. Add the file to your project by clicking on the Drop data files here or browse for files link to upload the titanic.csv file from a local directory.
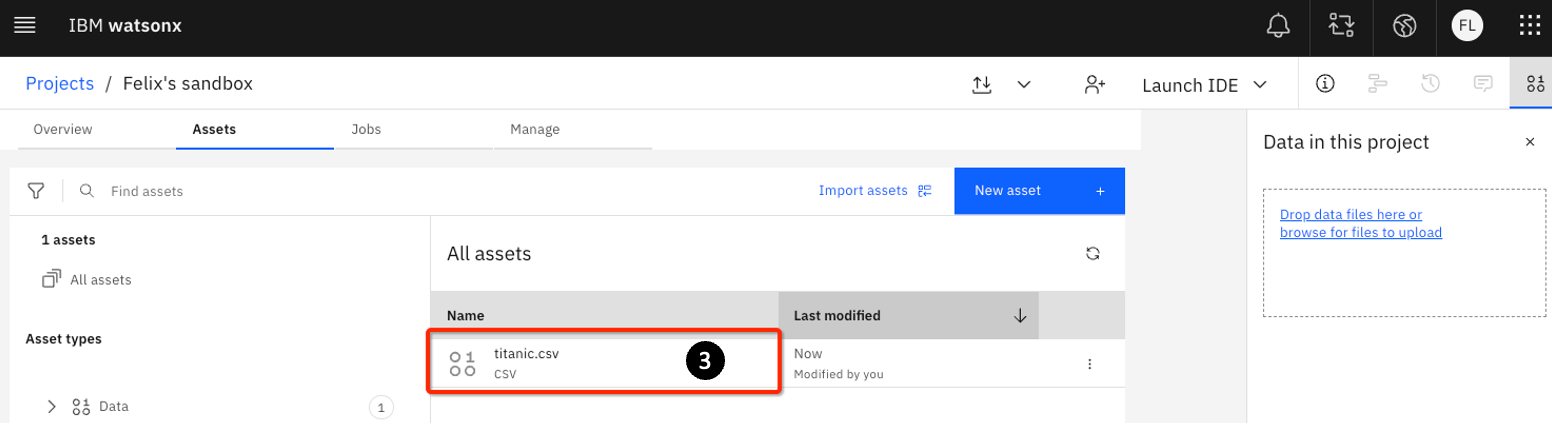
- The sandbox project page opens. You will see that this file shows up in the Assets tab.
Generating data with a seed file
Repeat Steps 1 - 5 from the Synthetic data generation section above. For Step 5, use the following values:
-
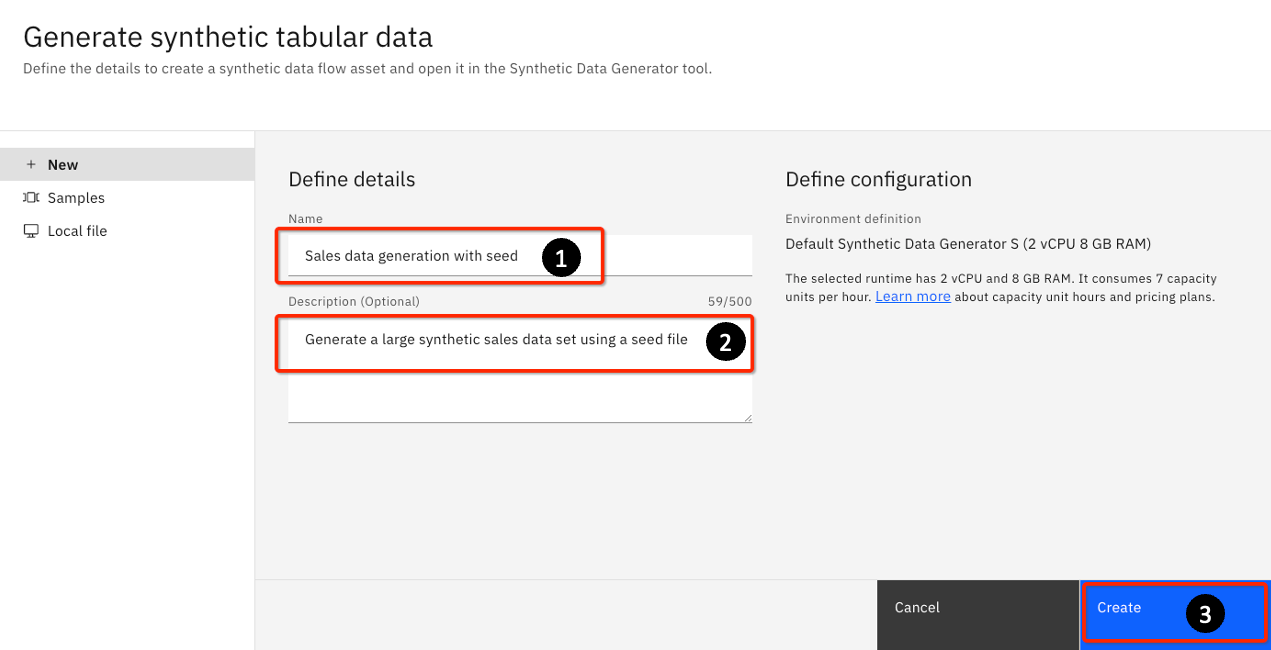
For Name: Enter Sales data generation with seed.
-
For Description: Enter Generate a large synthetic sales data set using a seed file.
-
Click Generate.
-
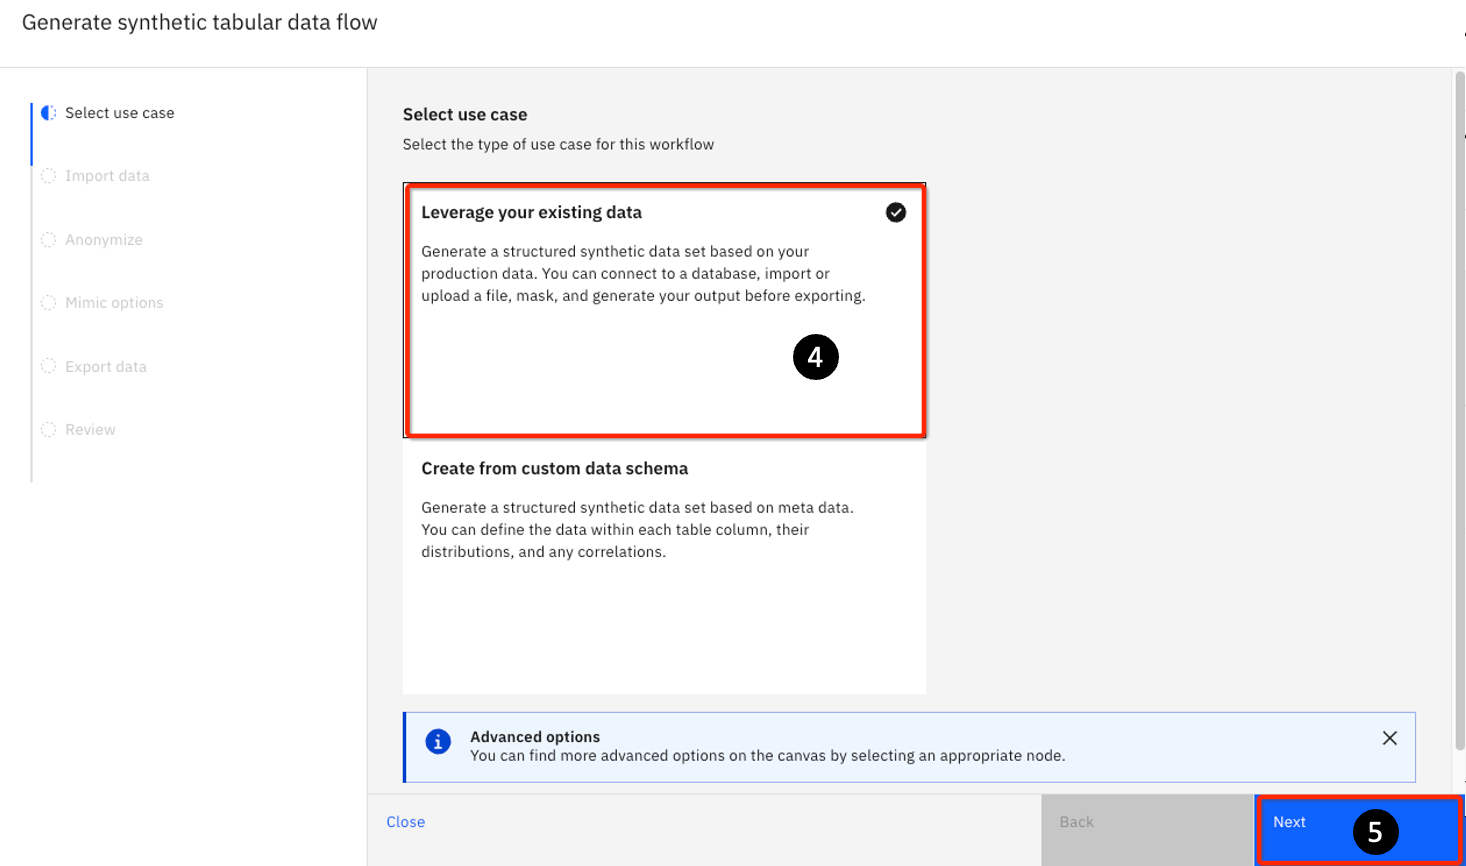
Repeat Steps 6 – 9 from
Synthetic data generation. Only this time for Step 9, select the Leverage your existing data use case on the Select use case tab. -
Click Next.
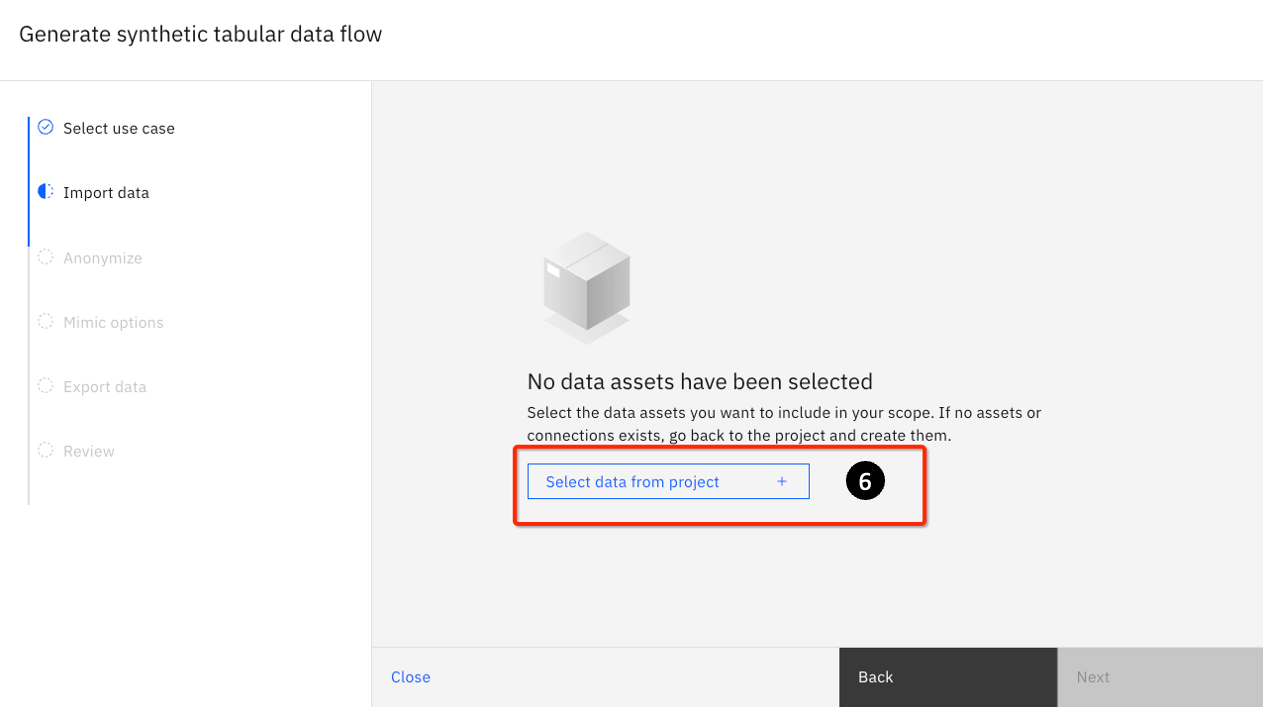
- The focus is changed to Import data task. Click on Select data from project.
-
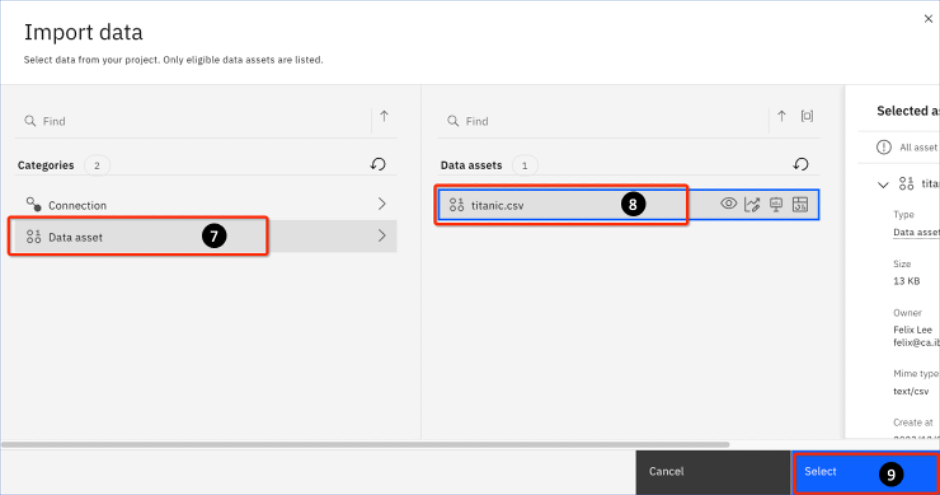
Click on Data asset. This will slide open a pane on the right.
-
Select the titanic.csv file.
-
Click Select.
- You are returned to the Generate Synthetic tabular data flow page. Note that the titanic.csv file has now been imported. Click Next.
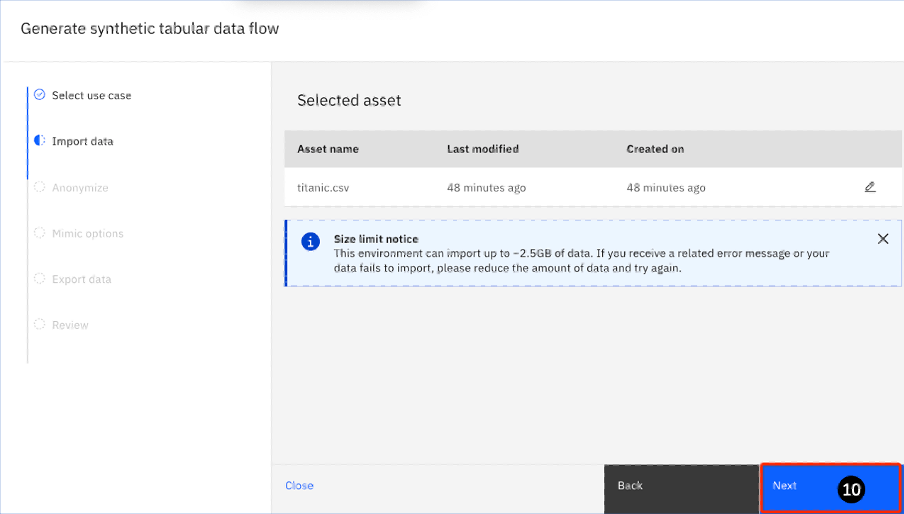
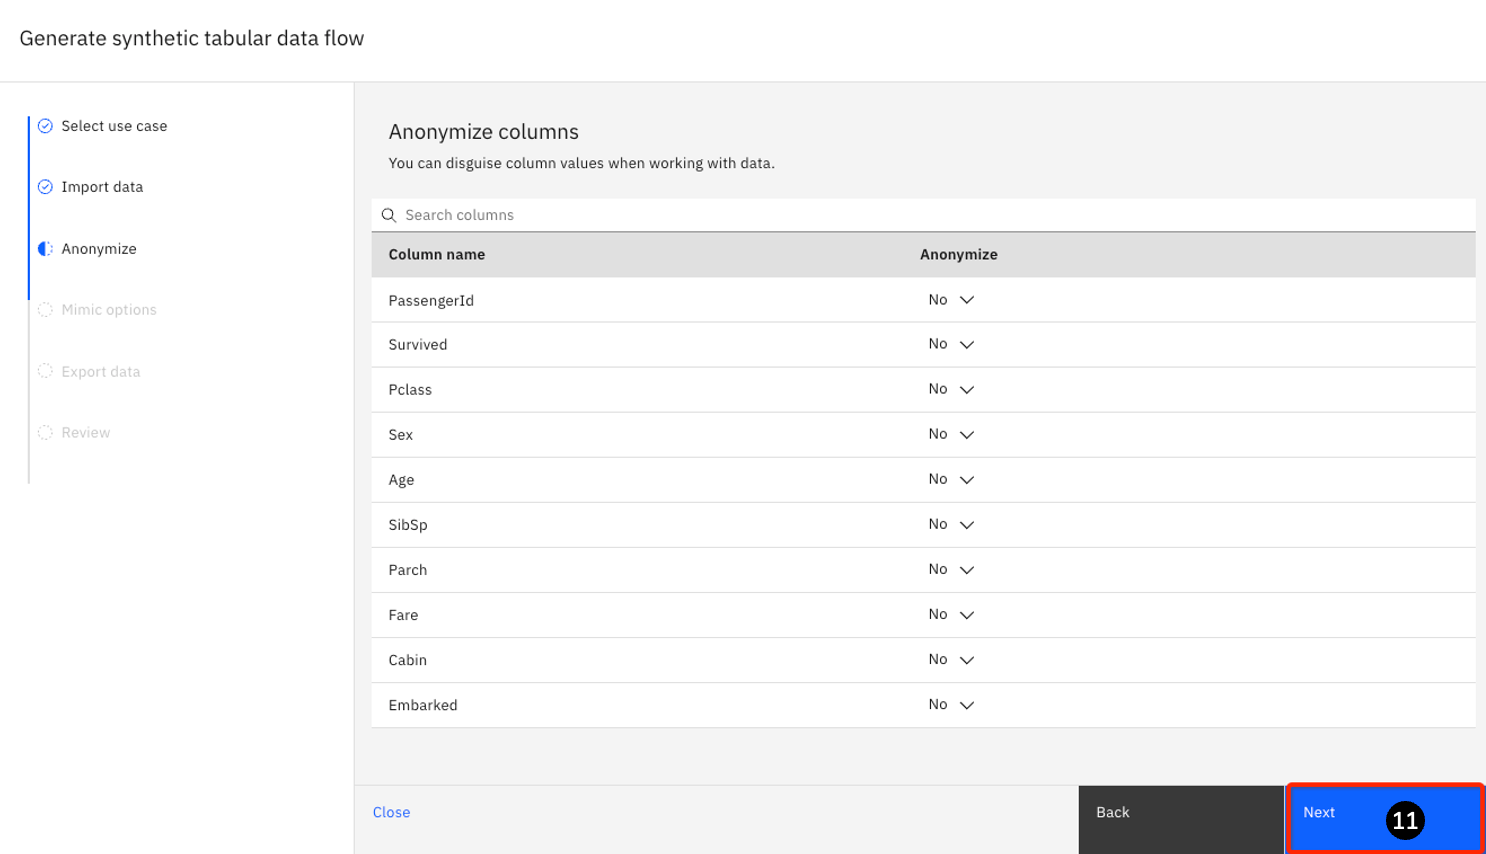
- Focus now changed to the Anonymize task, options are provided to determine if any columns need to be anonymized. For this lab, anonymization is not required. Click Next.
-
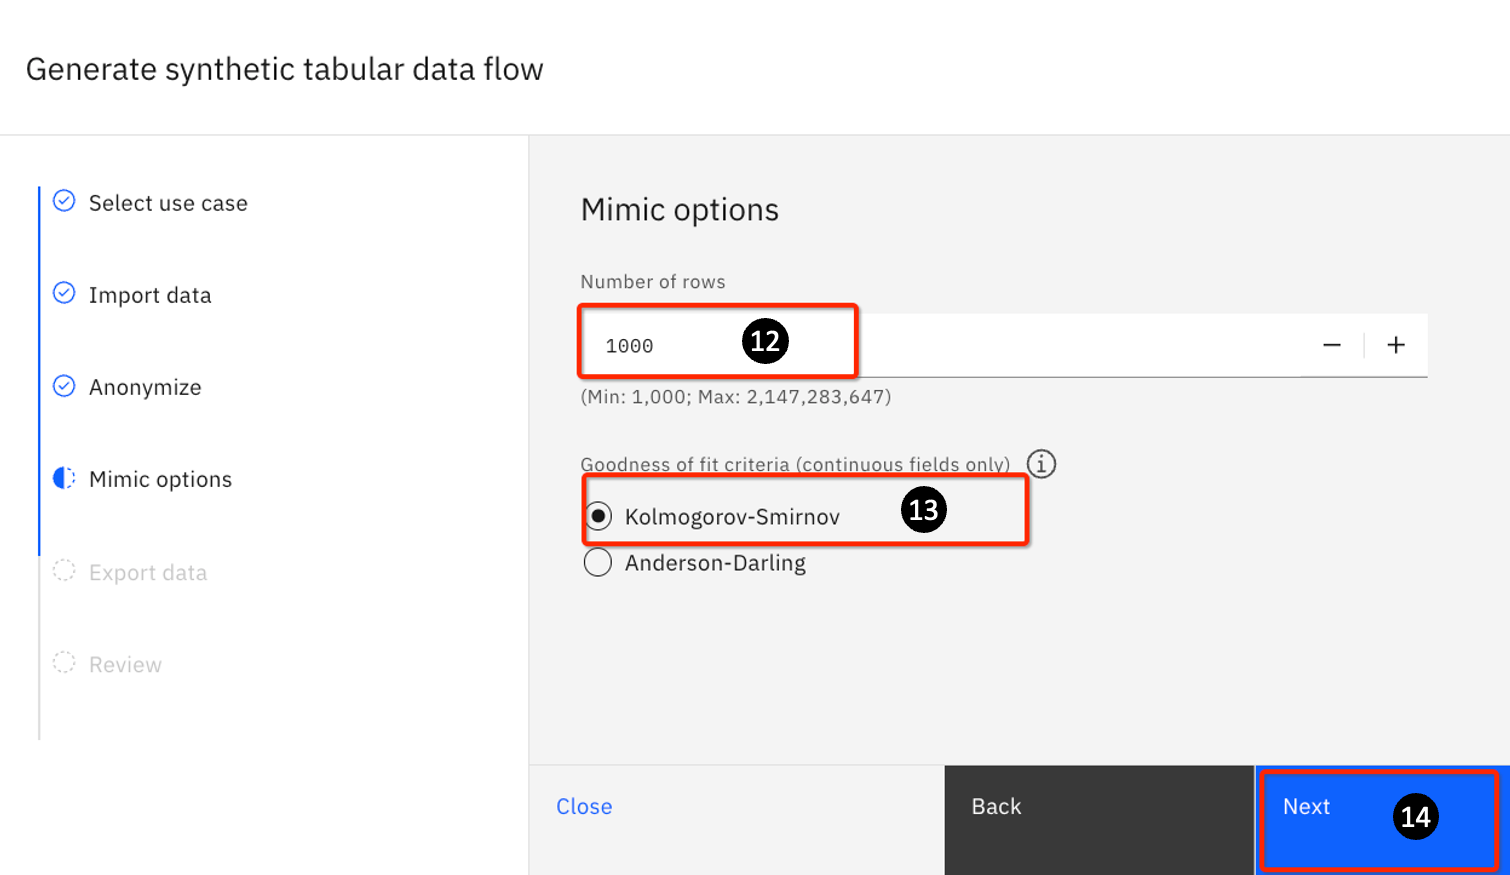
This tab lets you some mimic options. In mimic, the synthetic data generated takes on the characteristics of the input data (in terms of data type, distribution, etc.) By default, watsonx.ai will generate 100,000 rows. For this exercise, change Number of rows to the minimum number allowed: 1,000.
-
For the Goodness of fit criteria, use the default Kolmogorov-Smirnov.
Both Kolmogorov-Smirnov and Anderson-Darling are statistical tests that measure how close are two sets of data (the seed data and the one being generated).
Kolmogorov-Smirnov is a better test for the more sensitive data around the center of the data distribution, whereas Anderson-Darling is more sensitive to the tails.
For this exercise, simply take the default.
- Click Next.
-
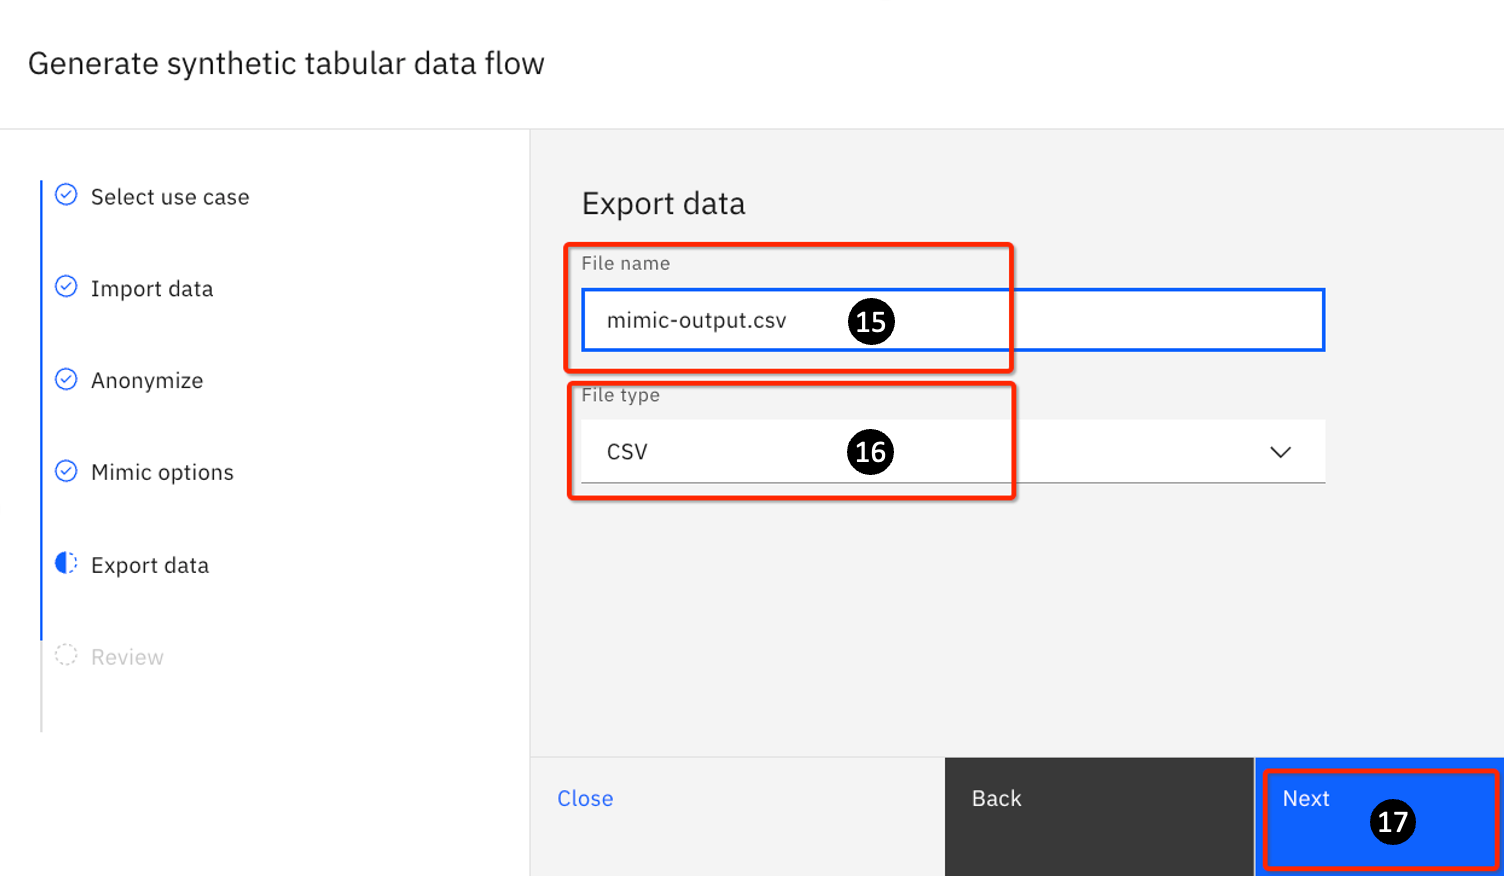
For File Name: Enter mimic-output
-
For File type, keep the default value of CSV
Note: There are other formats like - delimited, Excel, JSON, parquet, SAV, XML.
- Click Next.
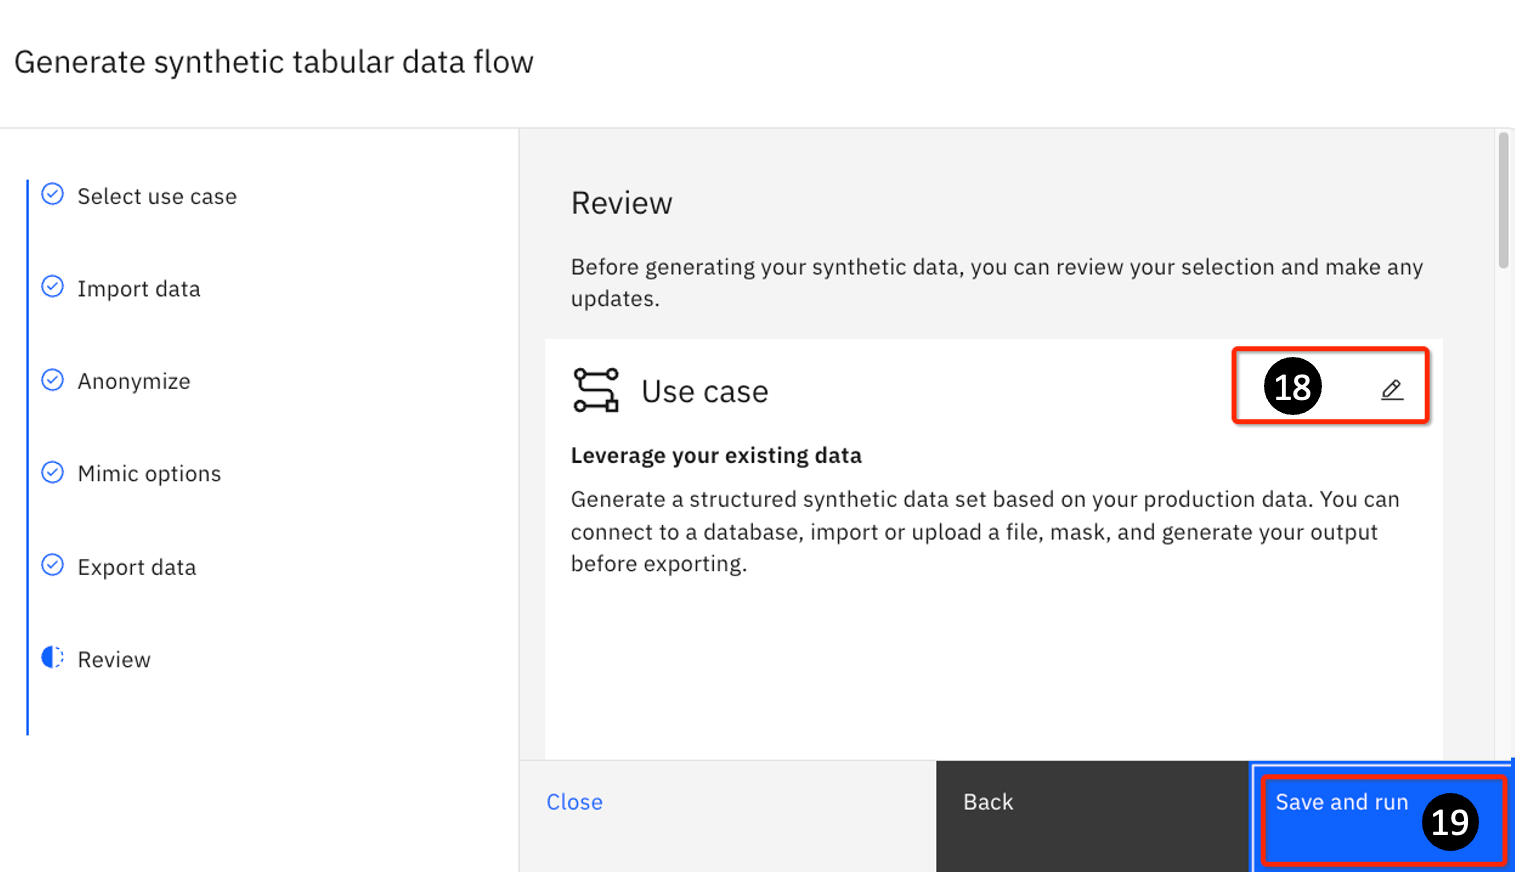
- Focus is now on the Review task. Click the Edit icon repeatedly to step through Steps 5 through 17. Review the information.
Use case: Leverage your existing data Import data: titanic.csv Number of columns:12 Anonymize: 0 Mimic options: Number of rows: 1000 Goodness of fit: Kolmogorov-Smirnov Export data: Export as: mimic-output.csvtxt
- After verification click on Save and run.
-
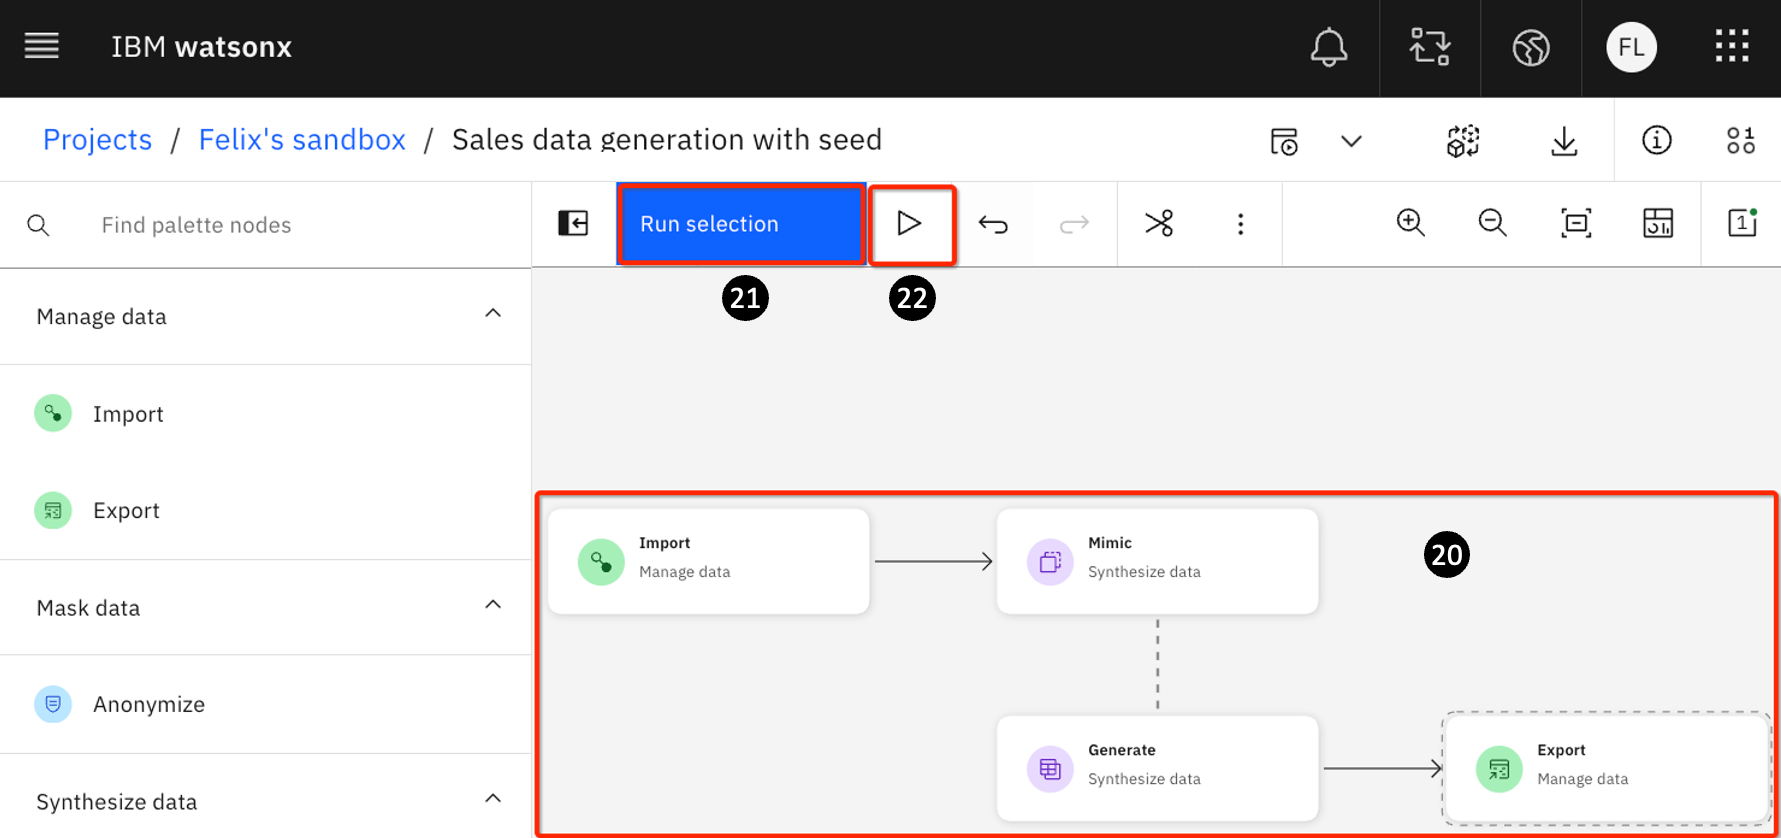
The next page shows a graphical representation of the tasks. There are 4 main areas:
- Import – this is where you define how you want to generate your data.
- Mimic – this is where the data is mimicked.
- Generate – this generates data.
- Export – this is where you define how you want to export your output – in this example, this would be in a CSV file named output.csv.
-
Run selection – you can choose to run Generate on its own (to do so, click the Generate tile before clicking Run selection) before running the Export pipeline; or you can choose to run both steps in one pass.
-
Click the Play icon to run all nodes in the pipeline.
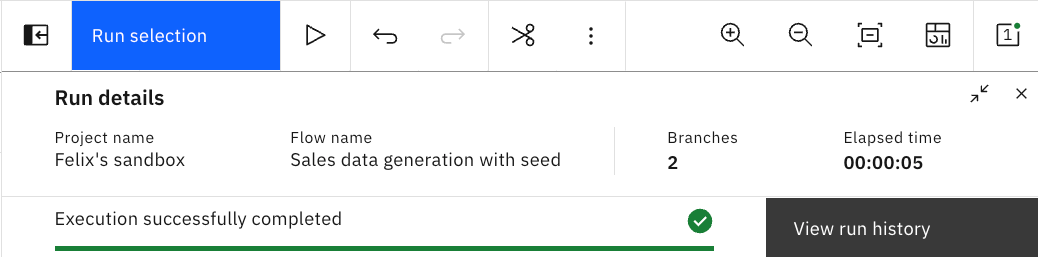
- The pipeline will take some seconds to run (it can vary depending on the availability of resources – anywhere from several seconds to tens of seconds, so be patient if it takes a little longer). You will see a quick summary as follows:
- Go to the breadcrumb and click your project.

-
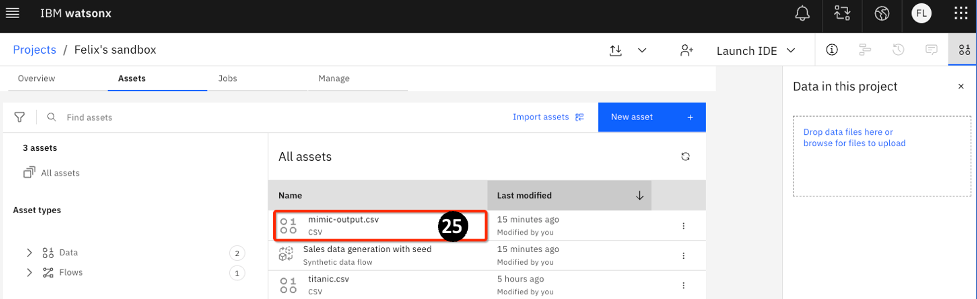
You will see the following (you may have other assets):
- CSV: is the output file mimic-output.csv
- Synthetic data flow is the name you used: Sales data generation with seed
- The original file – titanic.csv
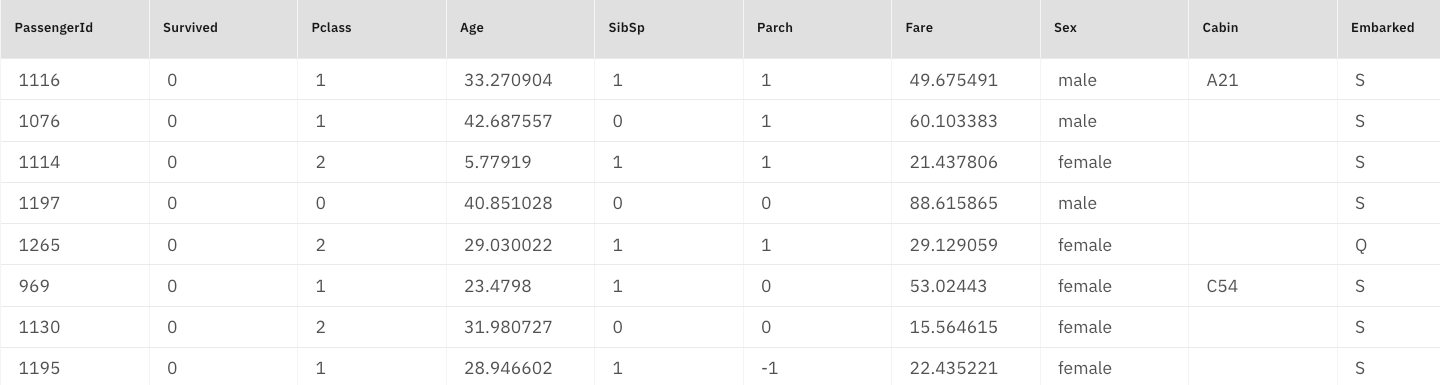
Click on mimic-output.csv to look at the newly generated dataset. This contains 1000 rows of synthetically generated data.
- The output should look something like this:
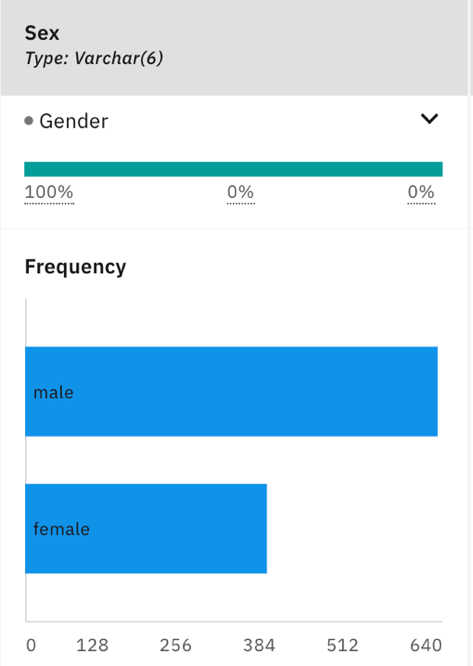
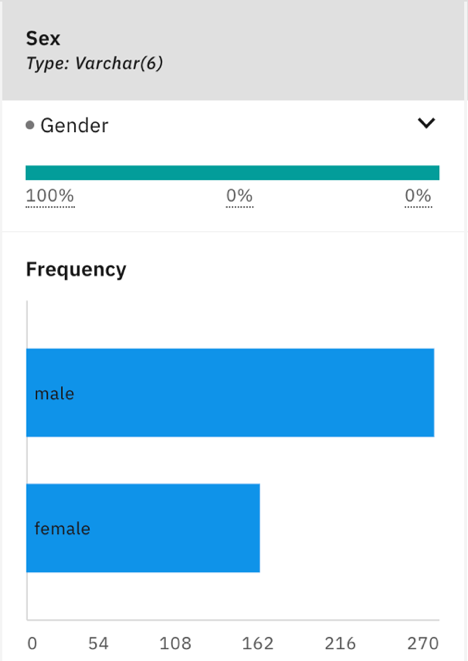
- Now let's compare the distribution of the original data set and the generated dataset. As you can see, the distributions for gender/sex are similar for both the generated dataset and the original dataset.
Generated dataset
Original dataset
Section summary
In this section, you generated synthetic data using an existing dataset. IBM watsonx.ai provides
a wide range of capabilities – allowing you to control how the data can be mimicked, including:
- The number of data points that you want to generate.
- Different methods to generate data - Kolmogorov-Smirnov and Anderson-Darling
- You can also choose to anonymize some columns.
- You can profile the datasets and build correlations between different columns to reflect real-world data.
The advantage of generating data using a seed file is that there is no need to manually define the
data schema. Its distribution will also closely resemble that of the input data. If the input data is a good representation of the overall dataset, the generated data will also resemble the client's business reality.