Visualization of watsonx.data from watsonx.ai
In this lab, we will offload some of the data from the DB2 Data Warehouse to the low-cost watsonx.data lakehouse. Then the data science team can use the data in the watsonx.ai platform to visualize and refine the data.
Explore watsonx.data configurations(Instructor-led)
As you have seen in previous section, I have already connected to DB2 data warehouse which has been offloaded to watsonx.data lakehouse. This warehouse contains a classic cars dataset, I will show you how a data scientist can bring the cars dataset to watsonx.ai and look at the data and do some visualization with it.
-
I have installed and configured a standalone watsonx.data on a IBM Cloud Virtual Server Instance.
-
Login to the watsonx.data instance https://wxddev.buildlab.cloud:9443/ using the following credentials
- userid: ibmlhadmin
- password: from slack
-
Click on the Infrastructure manager icon to see the DB2 data warehouse component.
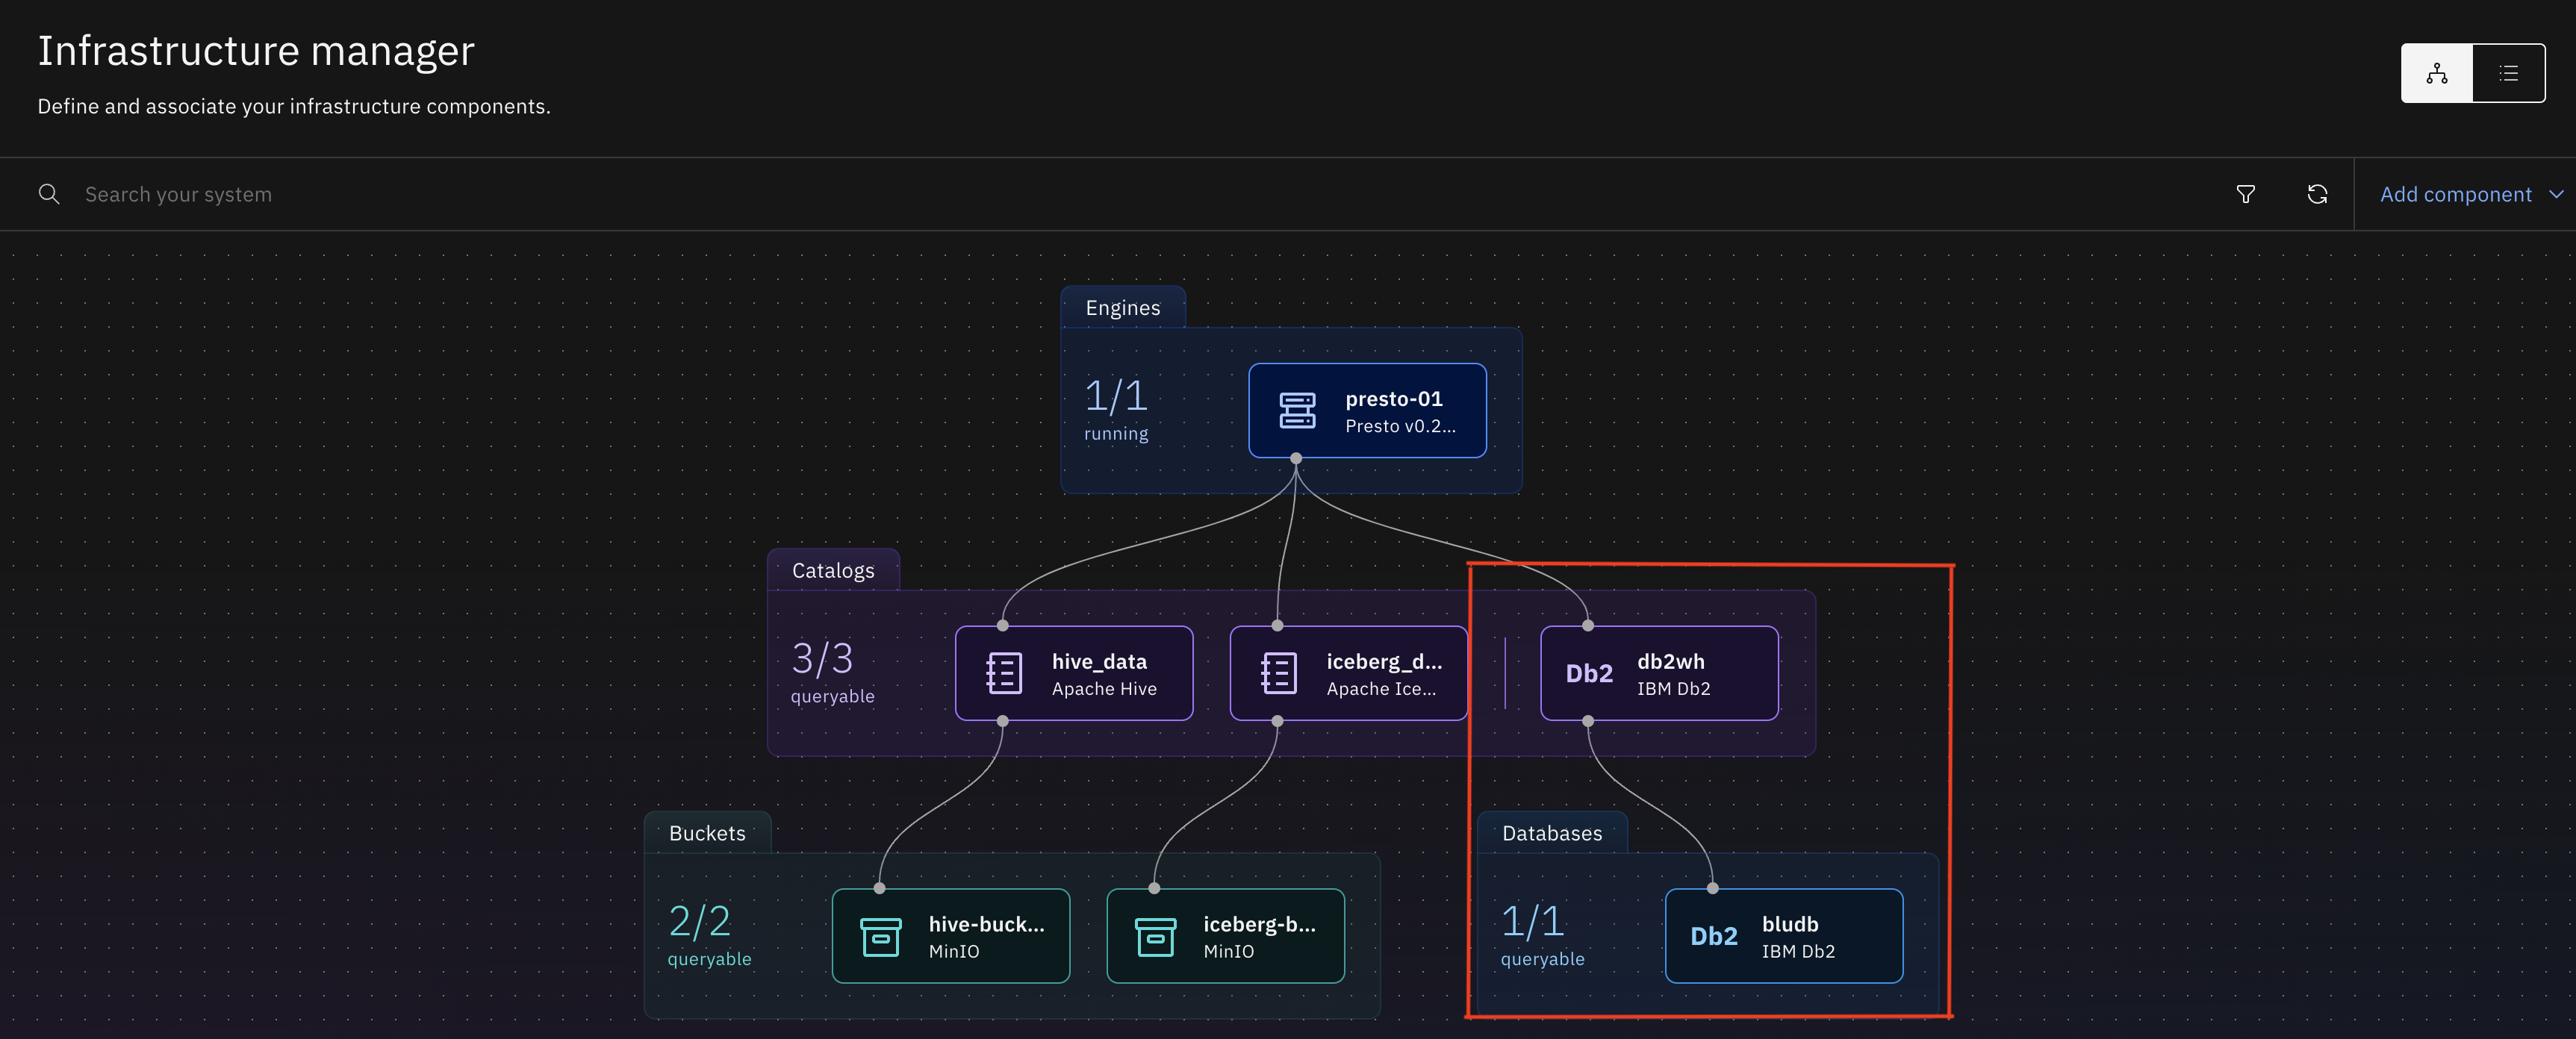
- Click on the Data manager icon and expand the db2wh catalog to see all the schemas. You can expand the qnf97304 schema to navigate to the classic_cars table.
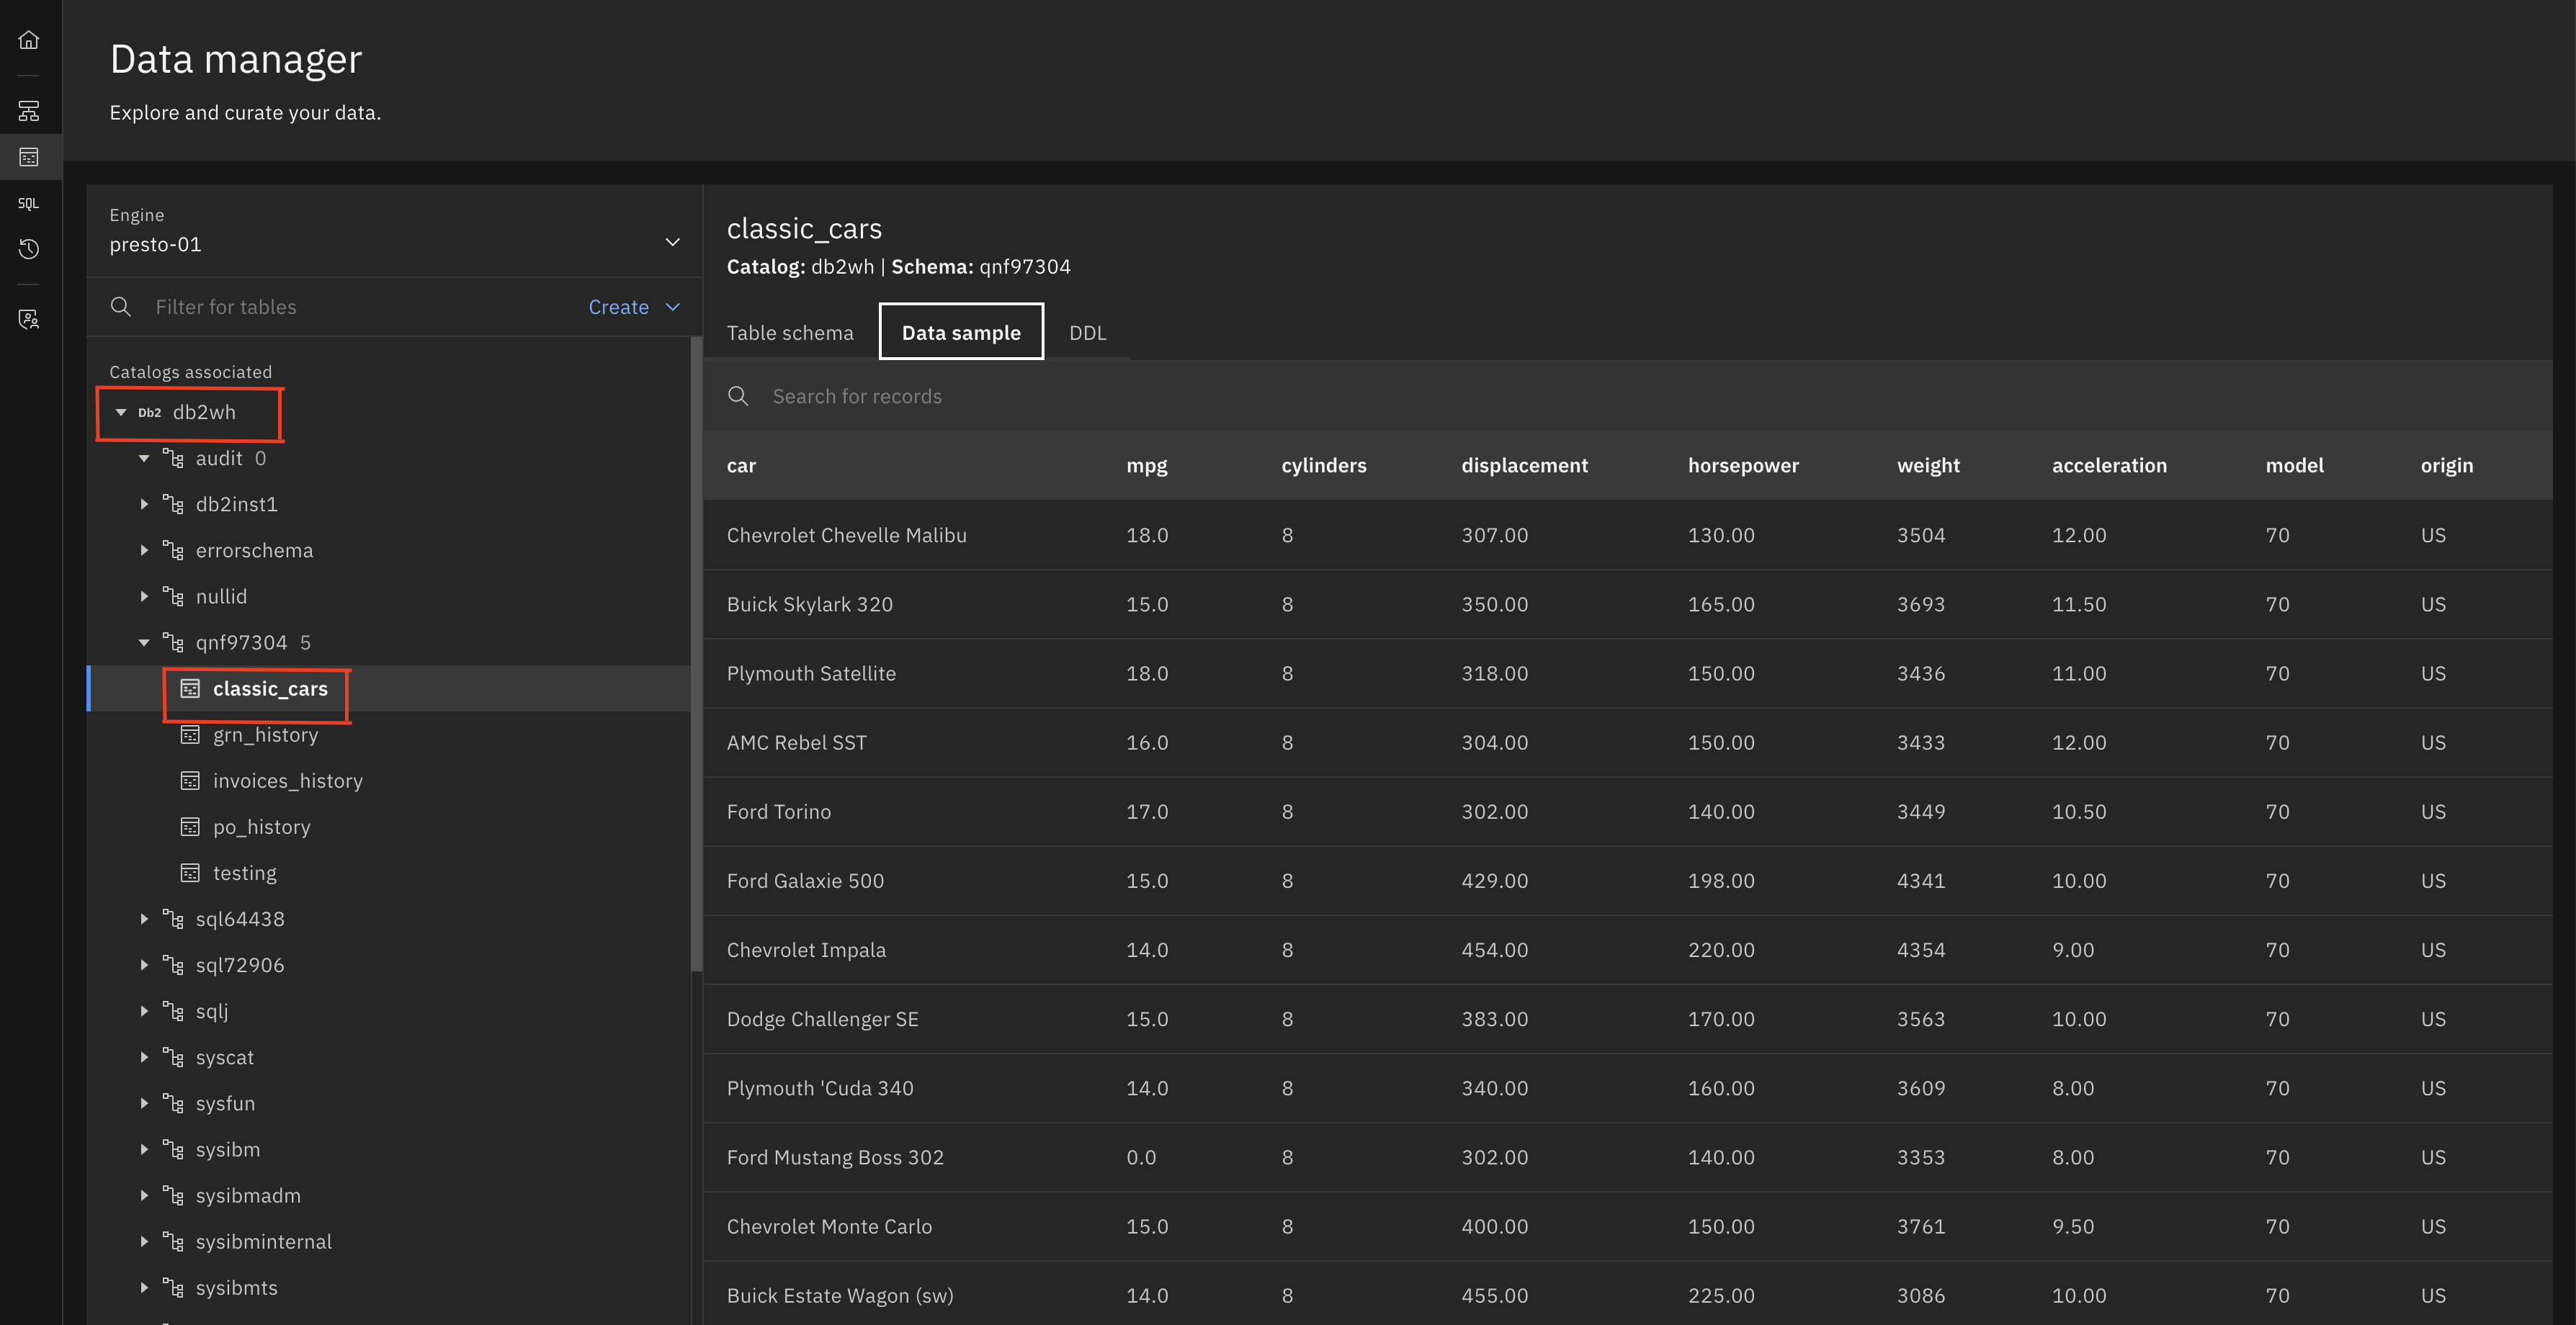
- The classic_cars table has been offloaded to watsonx.data. Expand iceberg_data -> dsteam -> classic_cars

-
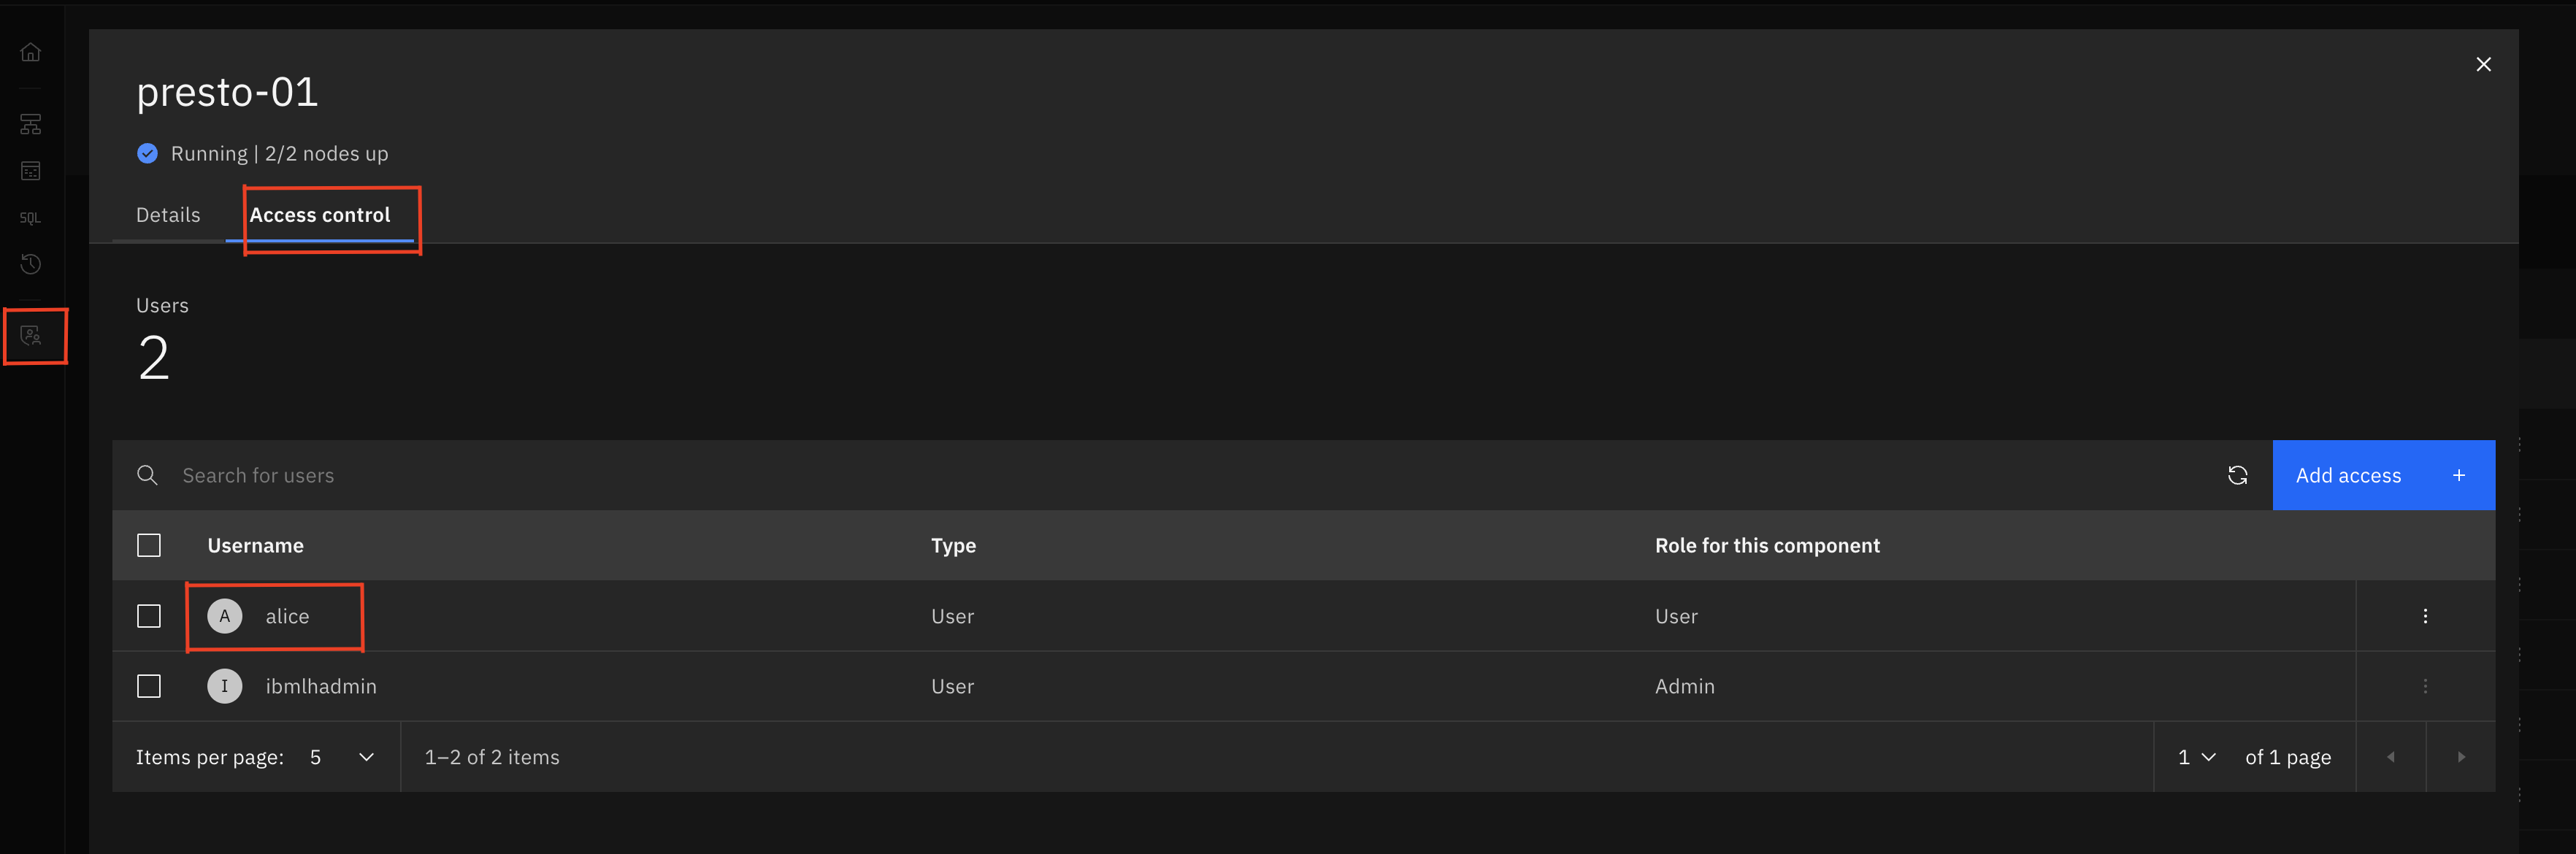
In term of controlling access, I have created a user called alice, and provided user role to presto-01 engine. An access policy has been also added to provide alice access to only dsteam schema.
-
Click on Access control icon from left navigation, and click on presto-01 and then click on Access control tab.
- Click on the X to close the window and click on the Policies tab to check the policy dsteam. Click on dsteam.

- I have given user role access to alice and restricted using policies to provide access to only dsteam schema in iceberg_data catalog. I have also provided access to some other components.
Connect watsonx.data from watsonx.ai
Now you will connect the dataset in this watsonx.data instance to the watsonx.ai project which you have used to complete the watsonx.ai labs. Navigate to your watsonx.ai project which you have used during the watsonx.ai labs.
NOTE: If you are completing this lab in an IBM workshop/classroom setting, the watsonx.ai instance will be shared among all students. You should have been invited to an IBM cloud account and added to a watsonx.ai project with name format:
VEST-Labs-{Location}-{MMDD}where Location is the location and MMDD indicates the month and day of your workshop.
-
Follow watsonx.ai 100: Prerequisites and FAQs to login to your watsonx.ai project.
-
Click on the hamburger icon in the upper left to expand the left-side menu and click View all projects

- Select the project you used to complete your watsonx.ai labs and click on Assets tab.
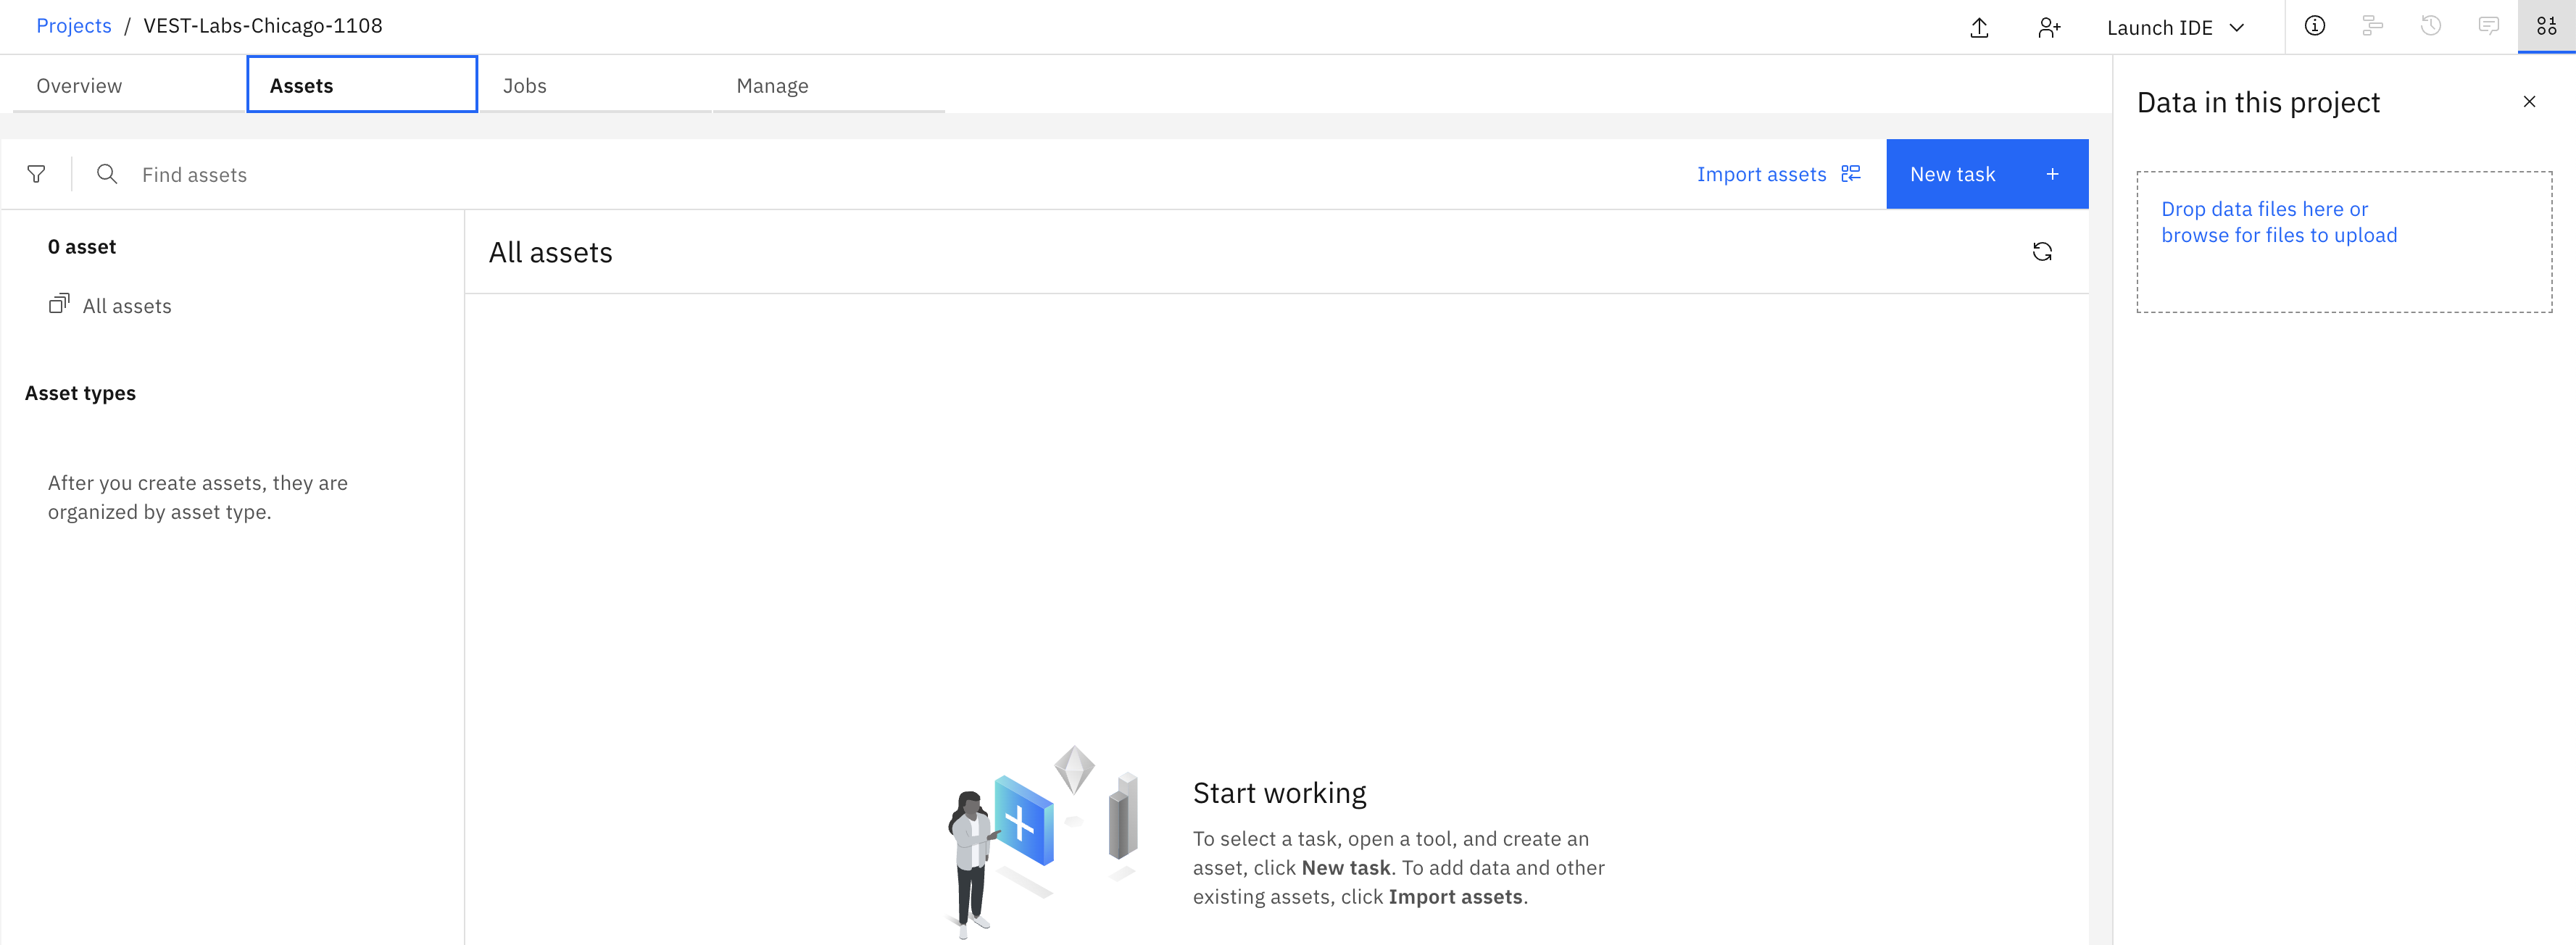
- You will connect to the watsonx.data instance from the watsonx.ai project. Click on the New task button from the upper right and select Connect to a data source
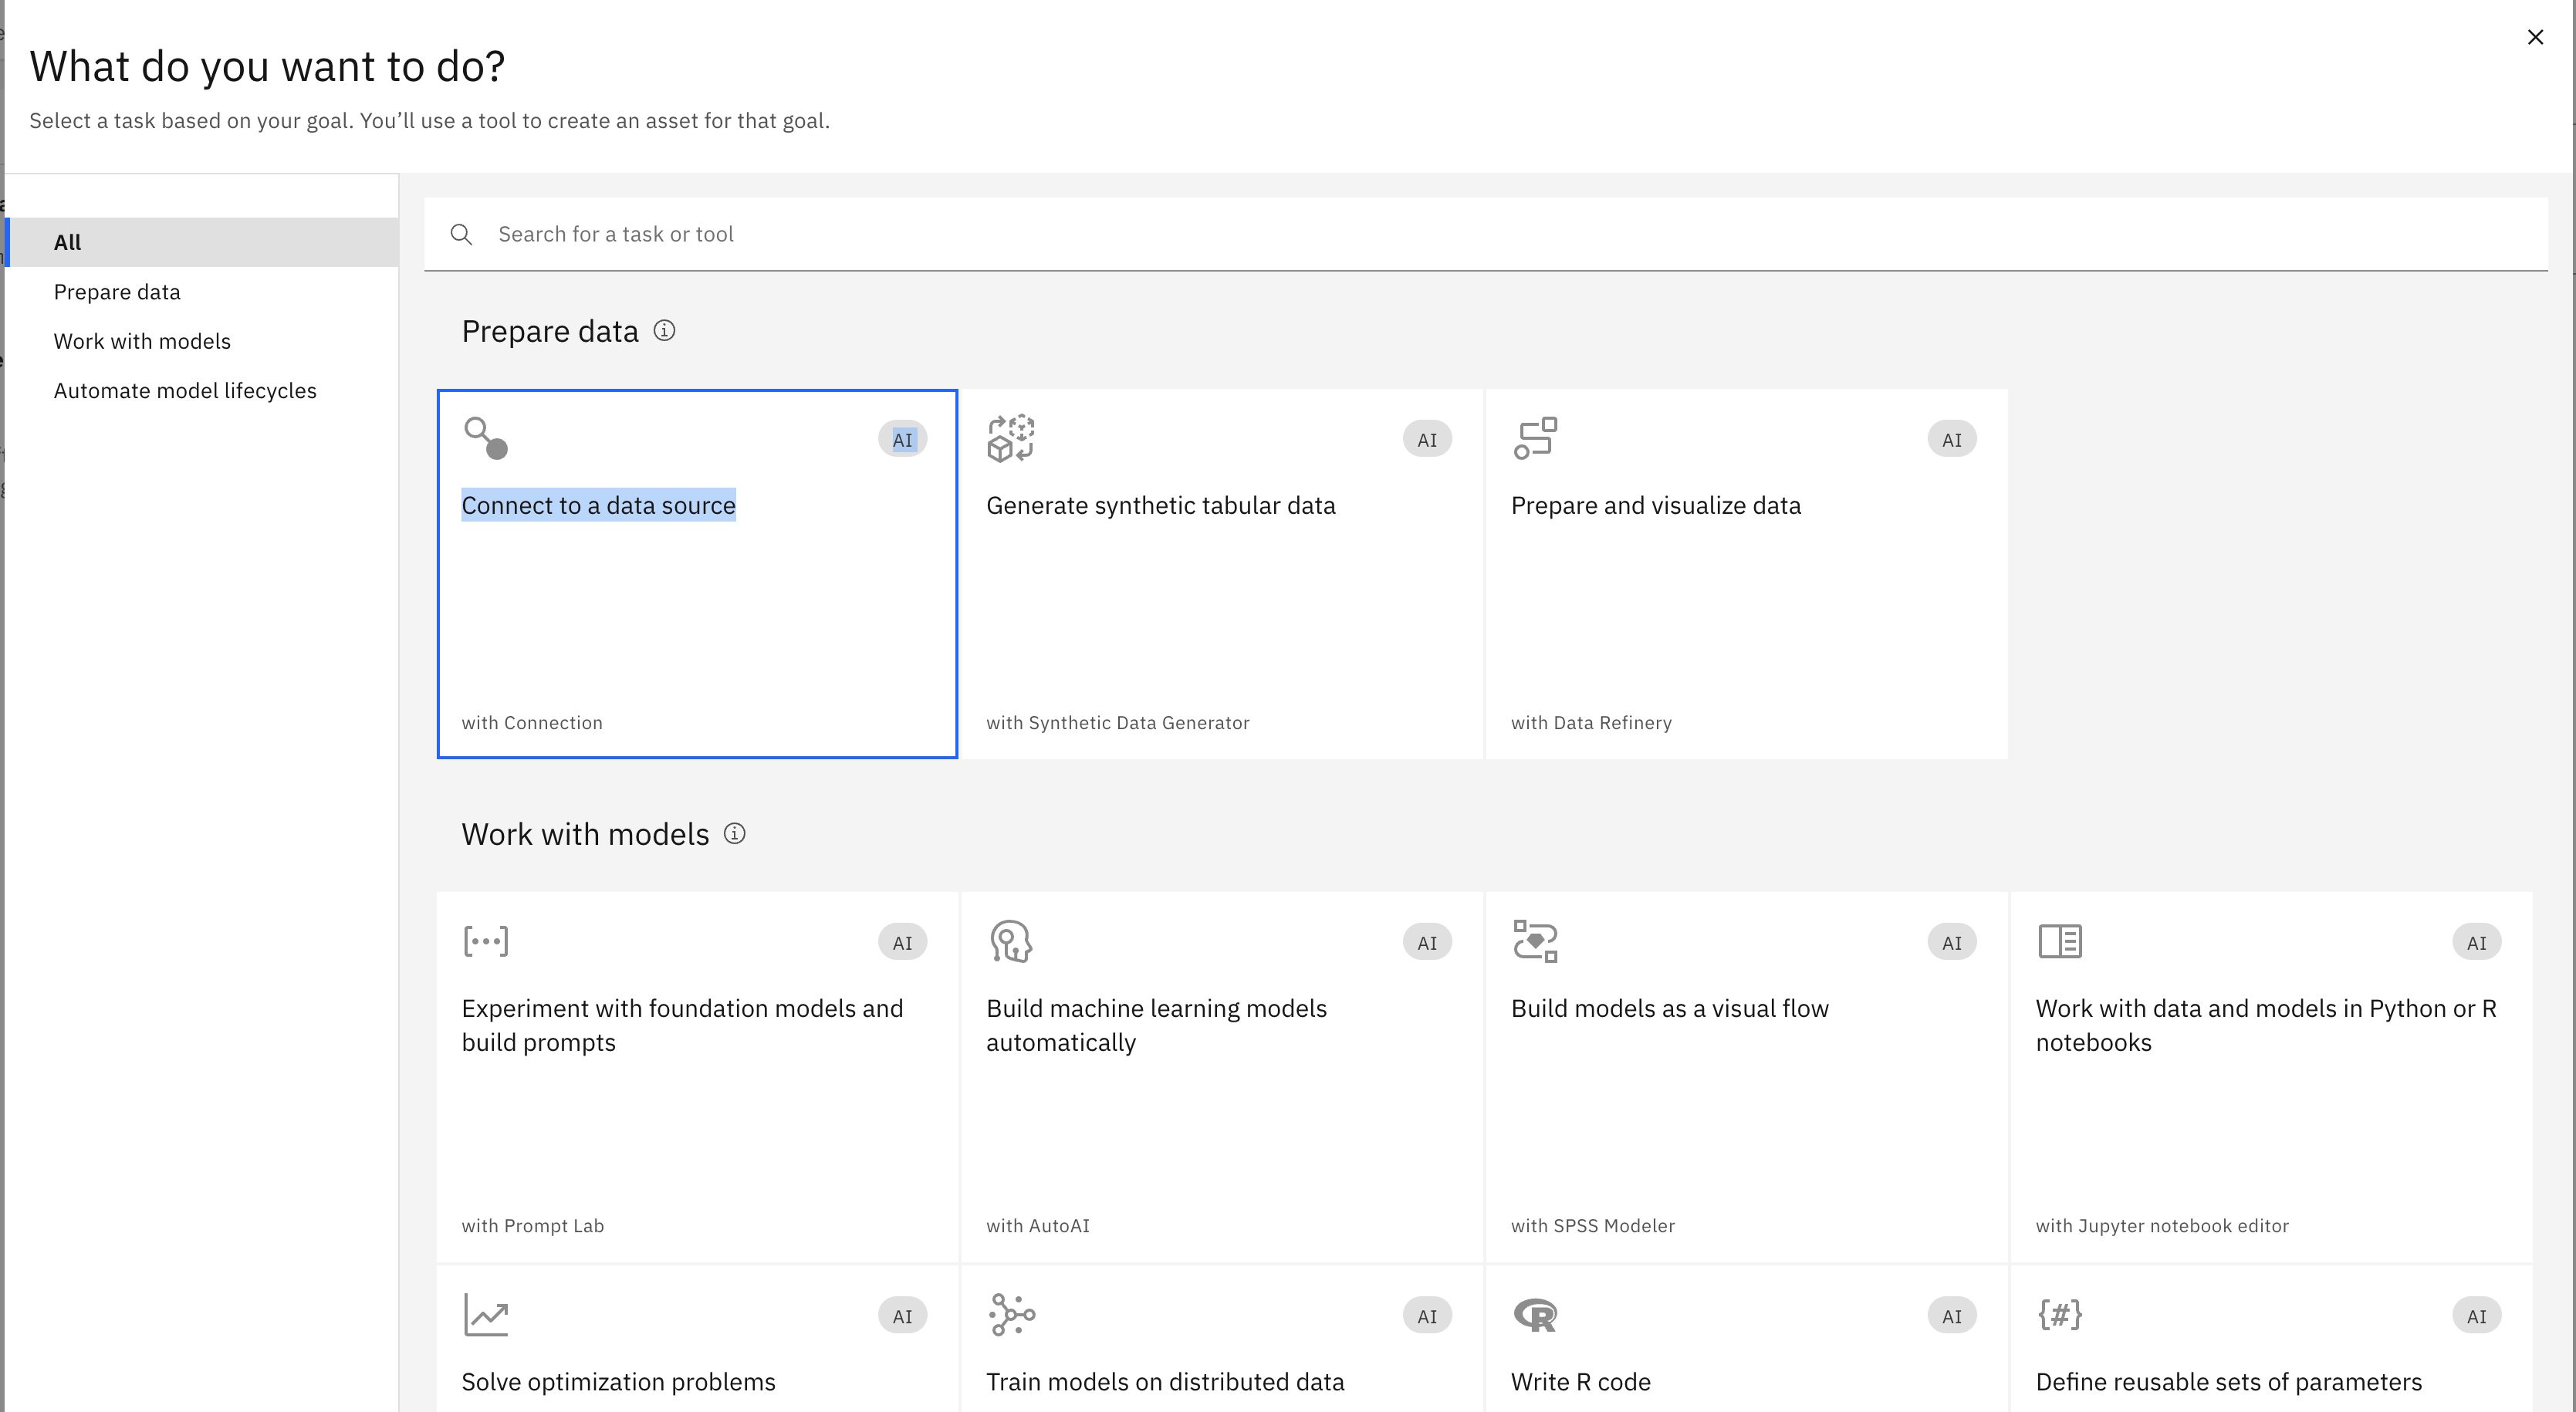
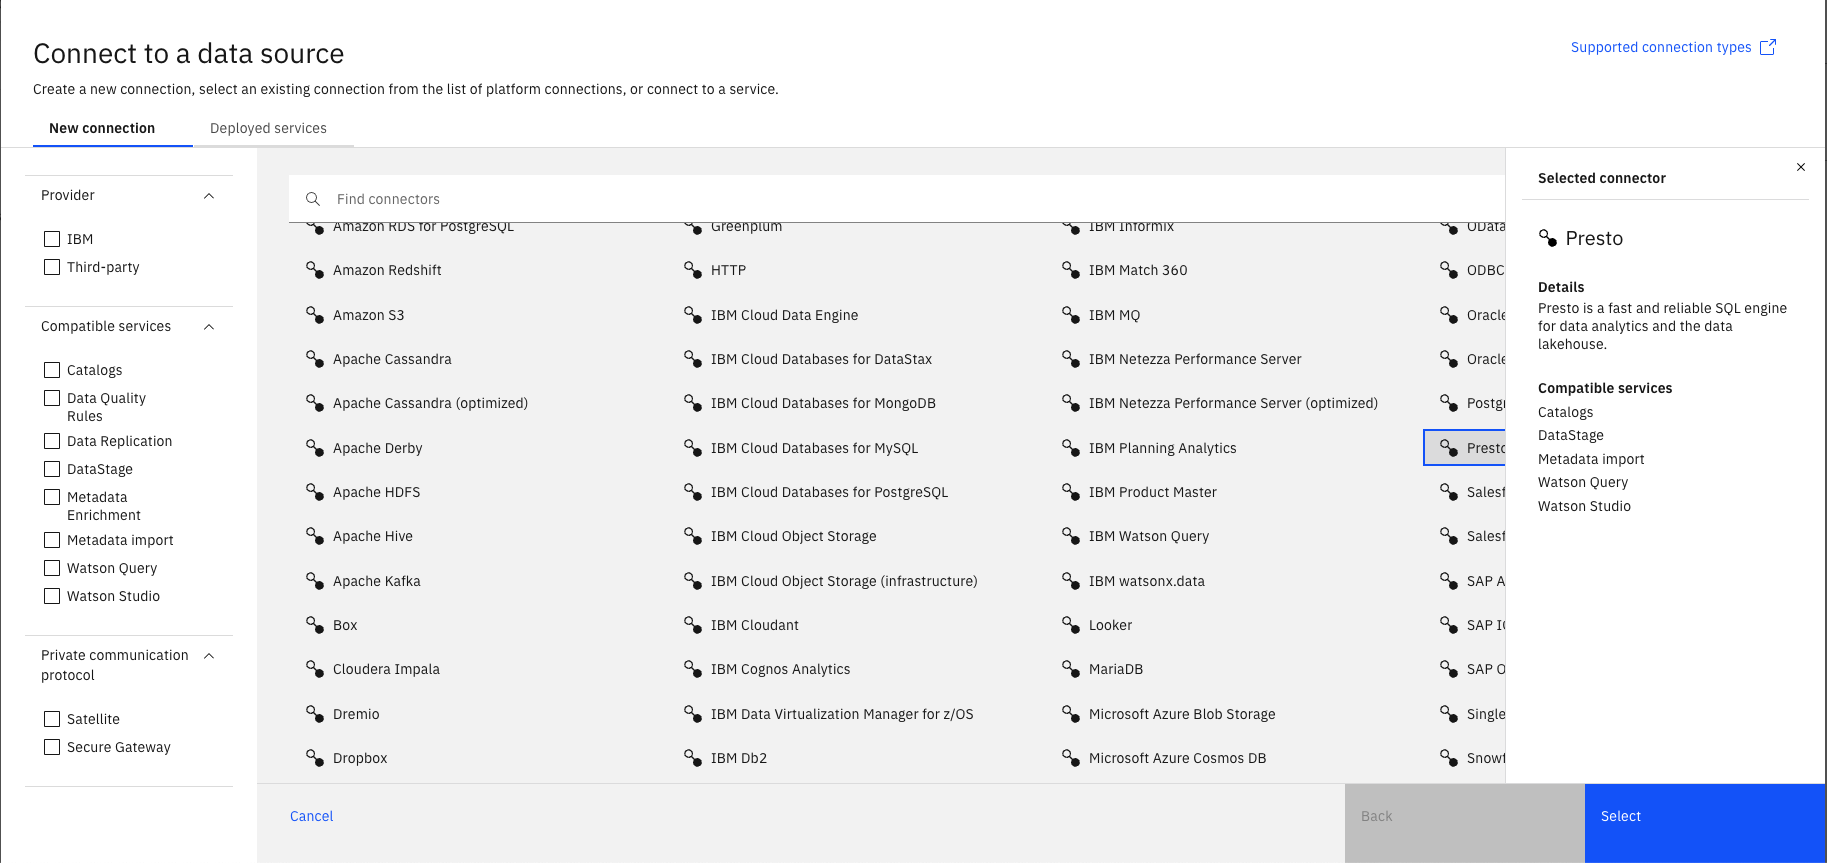
- With current release of watsonx, you will use Presto connector to connect to data in watsonx.data. Select Presto and then click on Select button.
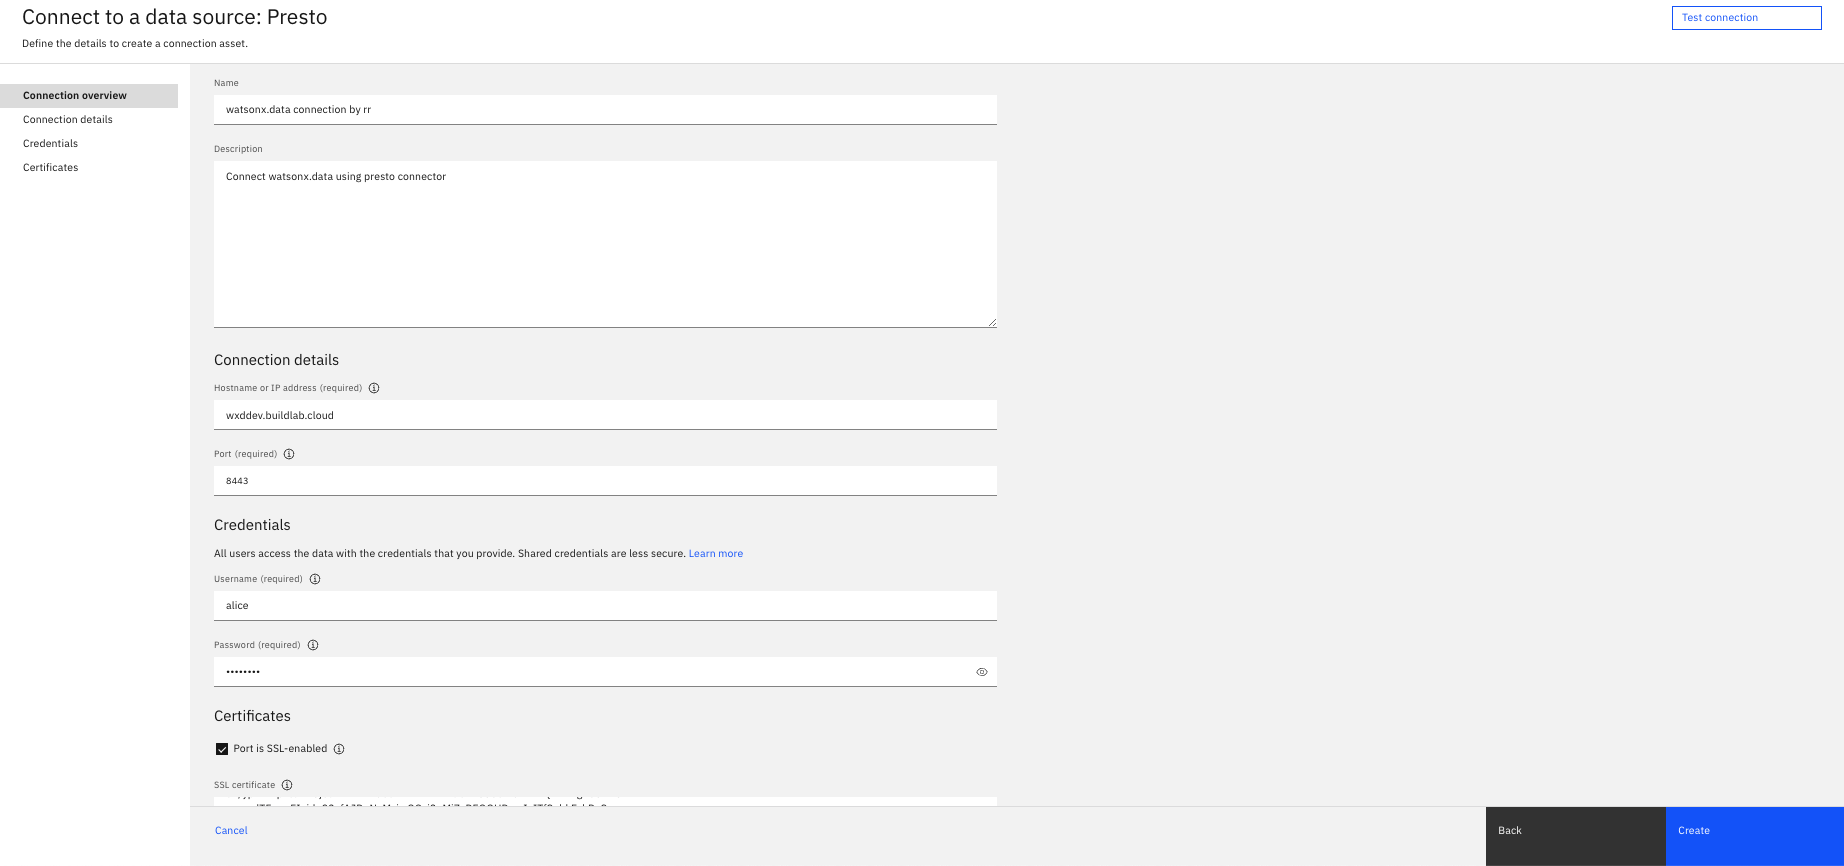
- Fill the connection details:
NOTE: Since it is shared environment, use a unique for connection, utilize your uniqueid as part of the name field
- Name:
{uniqueid} watsonx.data connection - Description: Connect watsonx.data using presto connector
- Hostname or IP address: wxddev.buildlab.cloud
- Port: 8443
- Username: alice
- Password: from slack
- Port is SSL-enabled: Checked
- SSL certificate: from slack
- After filling all details correctly, you can test the connection before saving the connection. Click on Test connection. If you see The test was successful. Click Create to save the connection information.
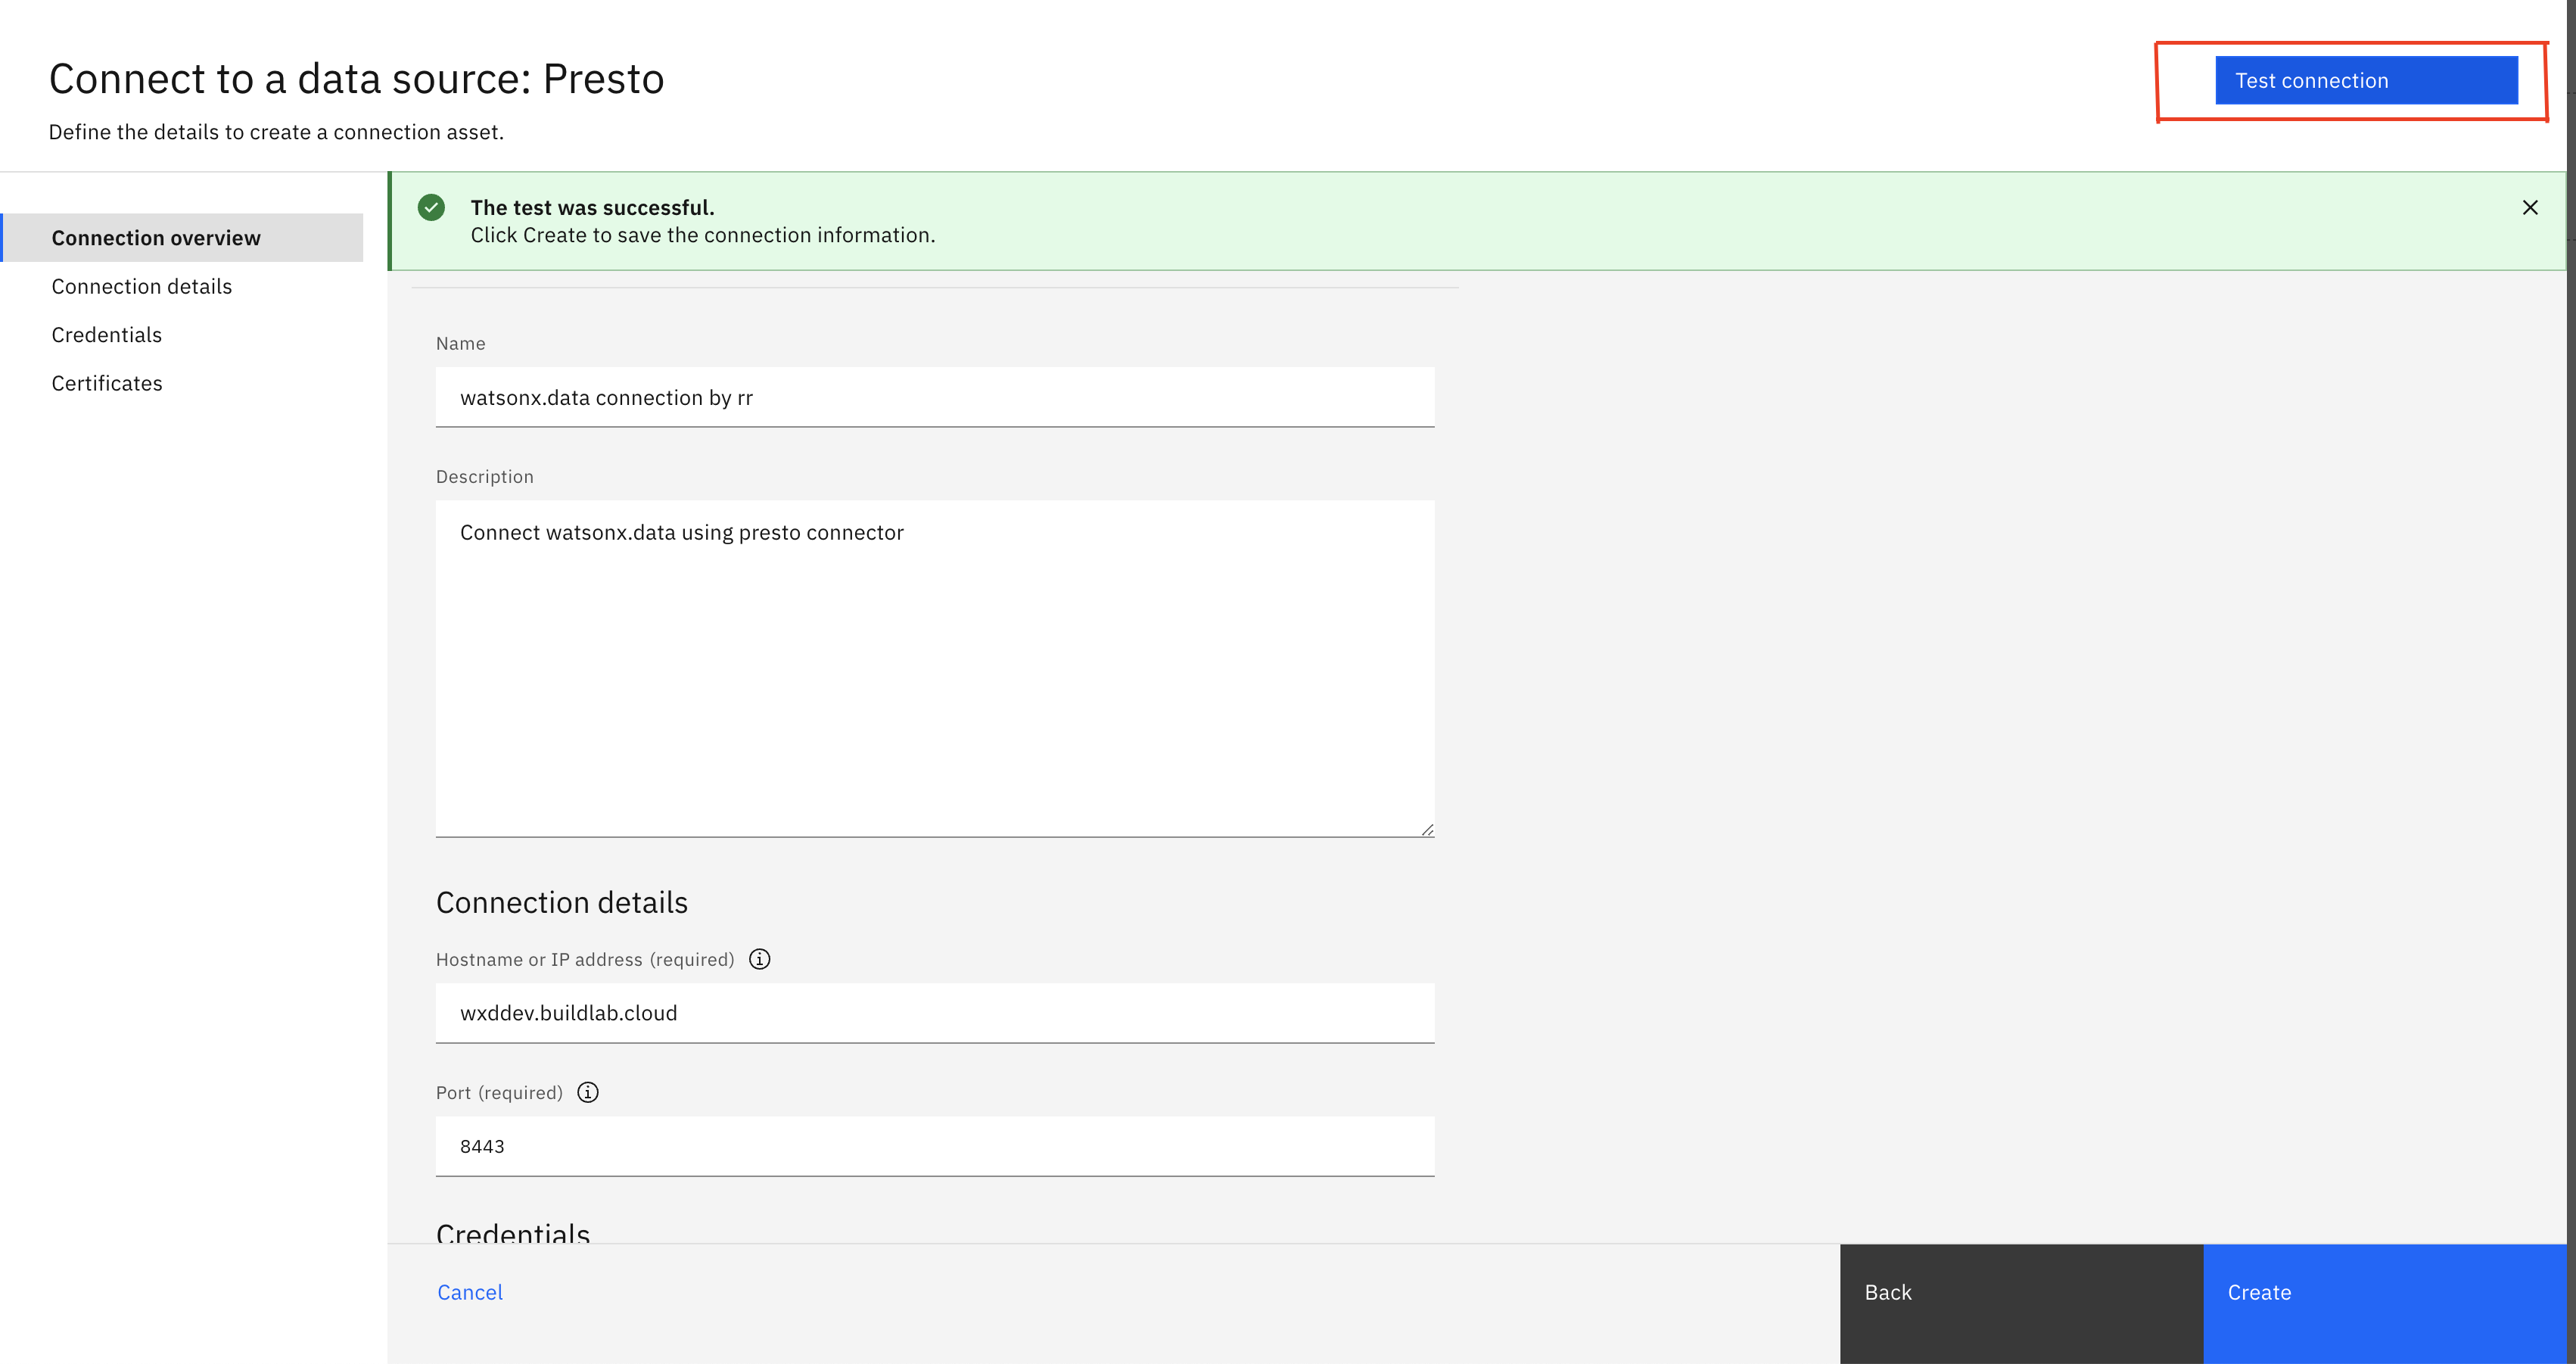
- You will see saved connection with name watsonx.data connection in Assets tab
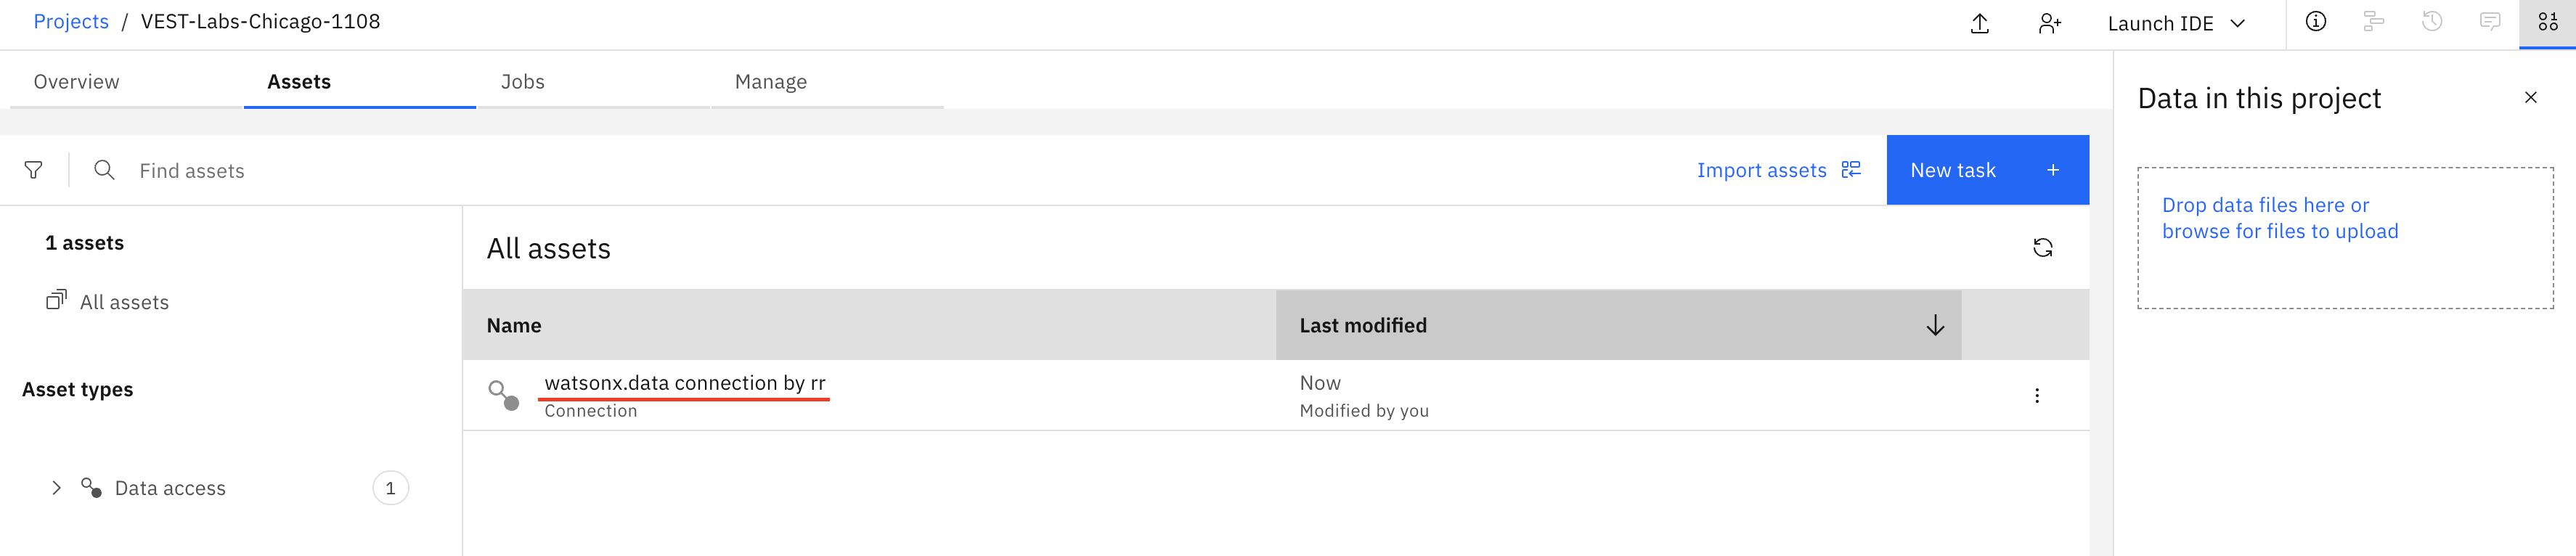
Data Visualization
We have set up a connection from watsonx.ai over watsonx.data. Now the next step is to bring the table from watsonx.data to watsonx.ai.
- From Assets tab of selected watsonx.ai project, click on Import assets. Select the connection you have created watsonx.data connection. You can follow the selection to select table in final stage. watsonx.data connection -> iceberg_data -> dsteam -> classic_cars. Select Import button. You will notice new asset created with table name classic_cars
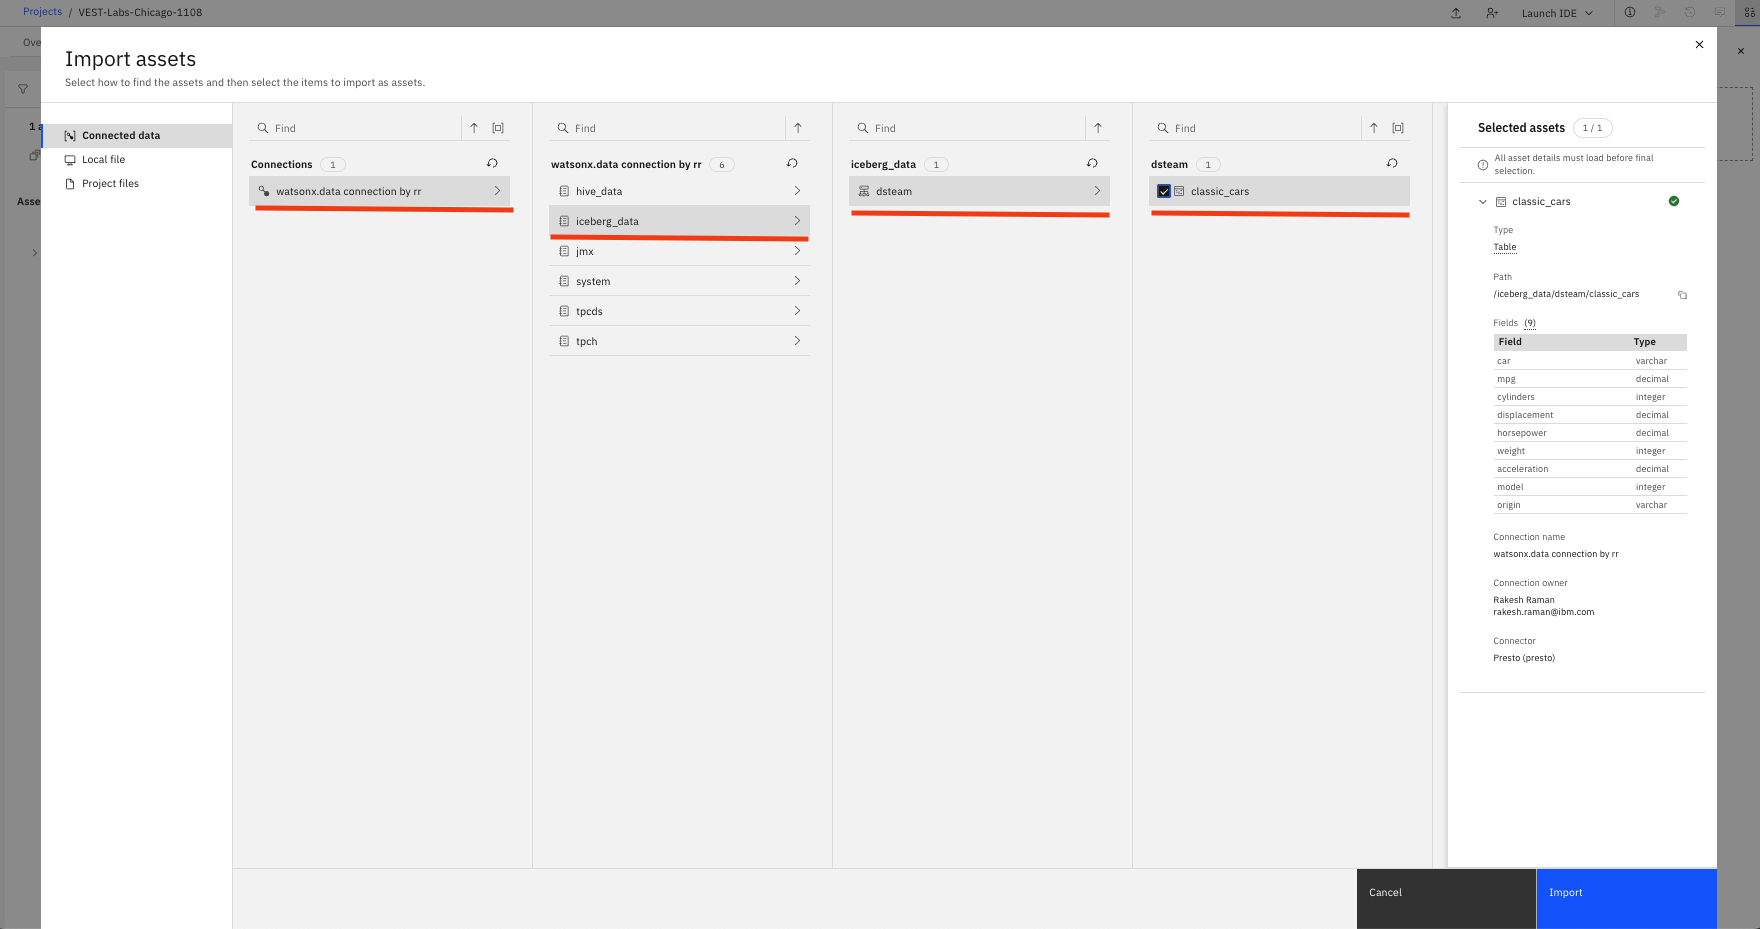
-
You will notice db2wh catalogs are not visible on the screen because alice has not been given access to db2wh catalog.
-
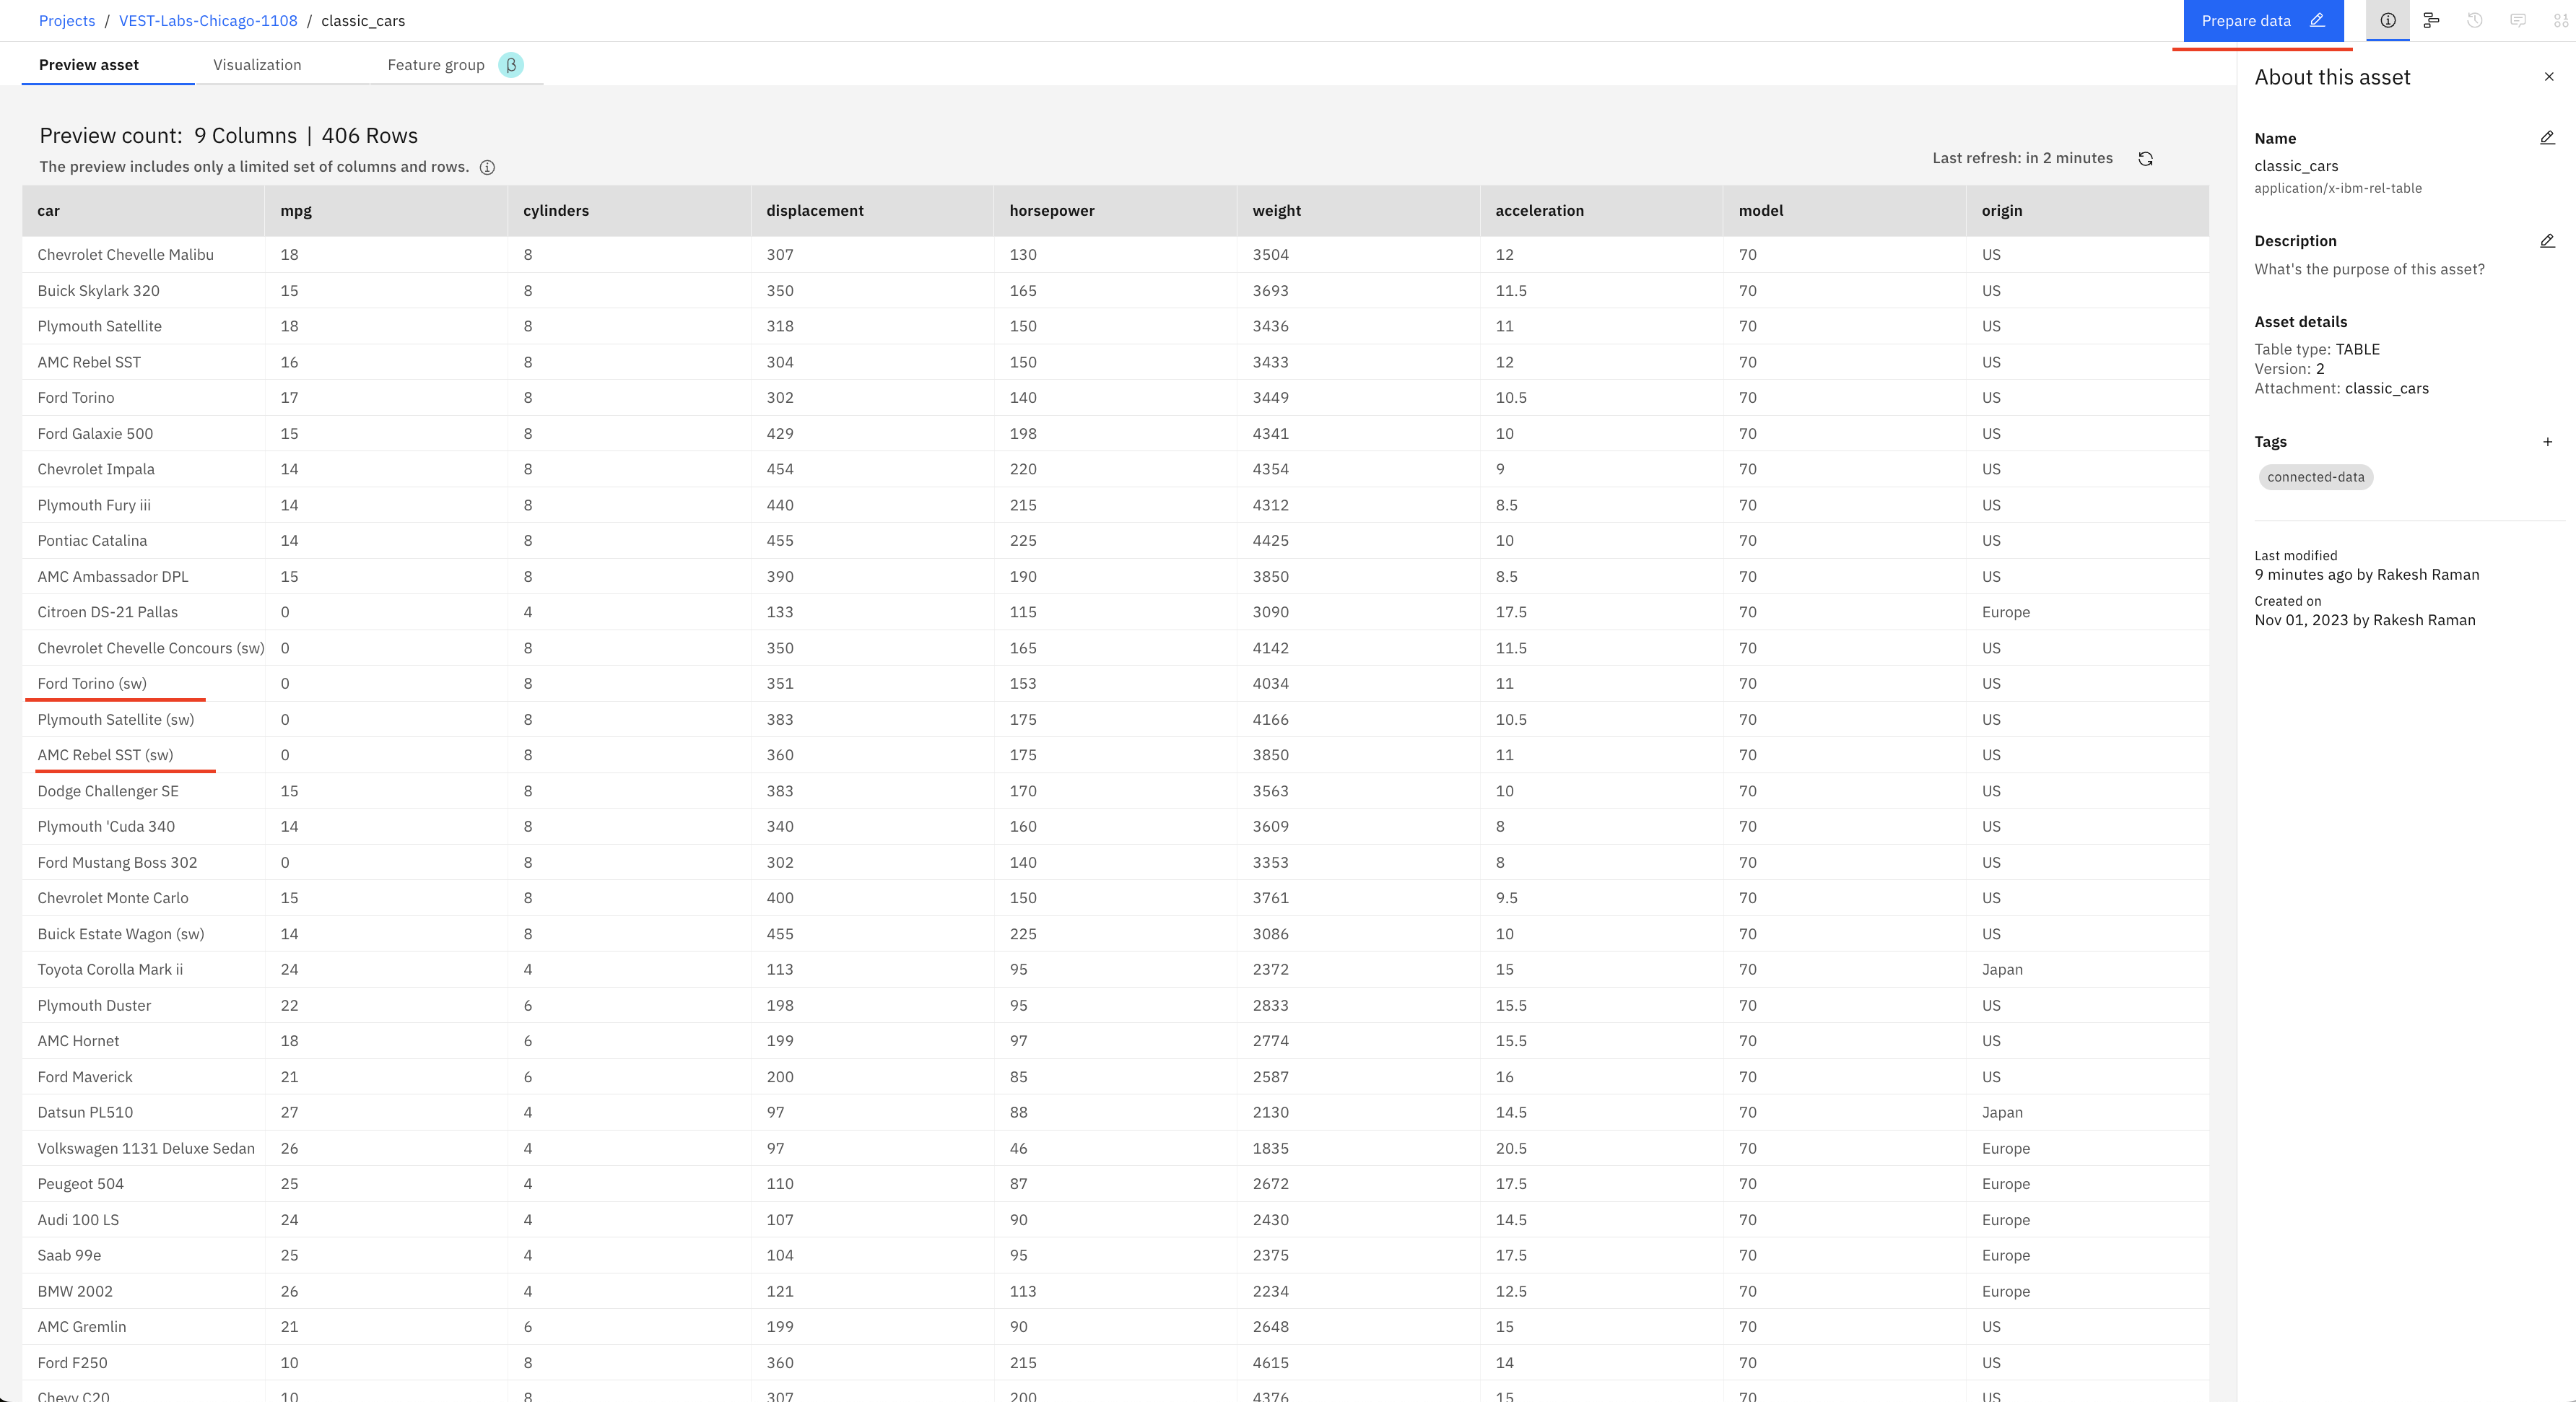
Click on classic_cars to preview the data. You will notice a 0 mpg value for some of the rows in the table. My objective is to prepare the data by removing cars with 0 mpg so that refined data can be shared with business users. Let us go to the data refinery by clicking on the Prepare data button from the upper right.
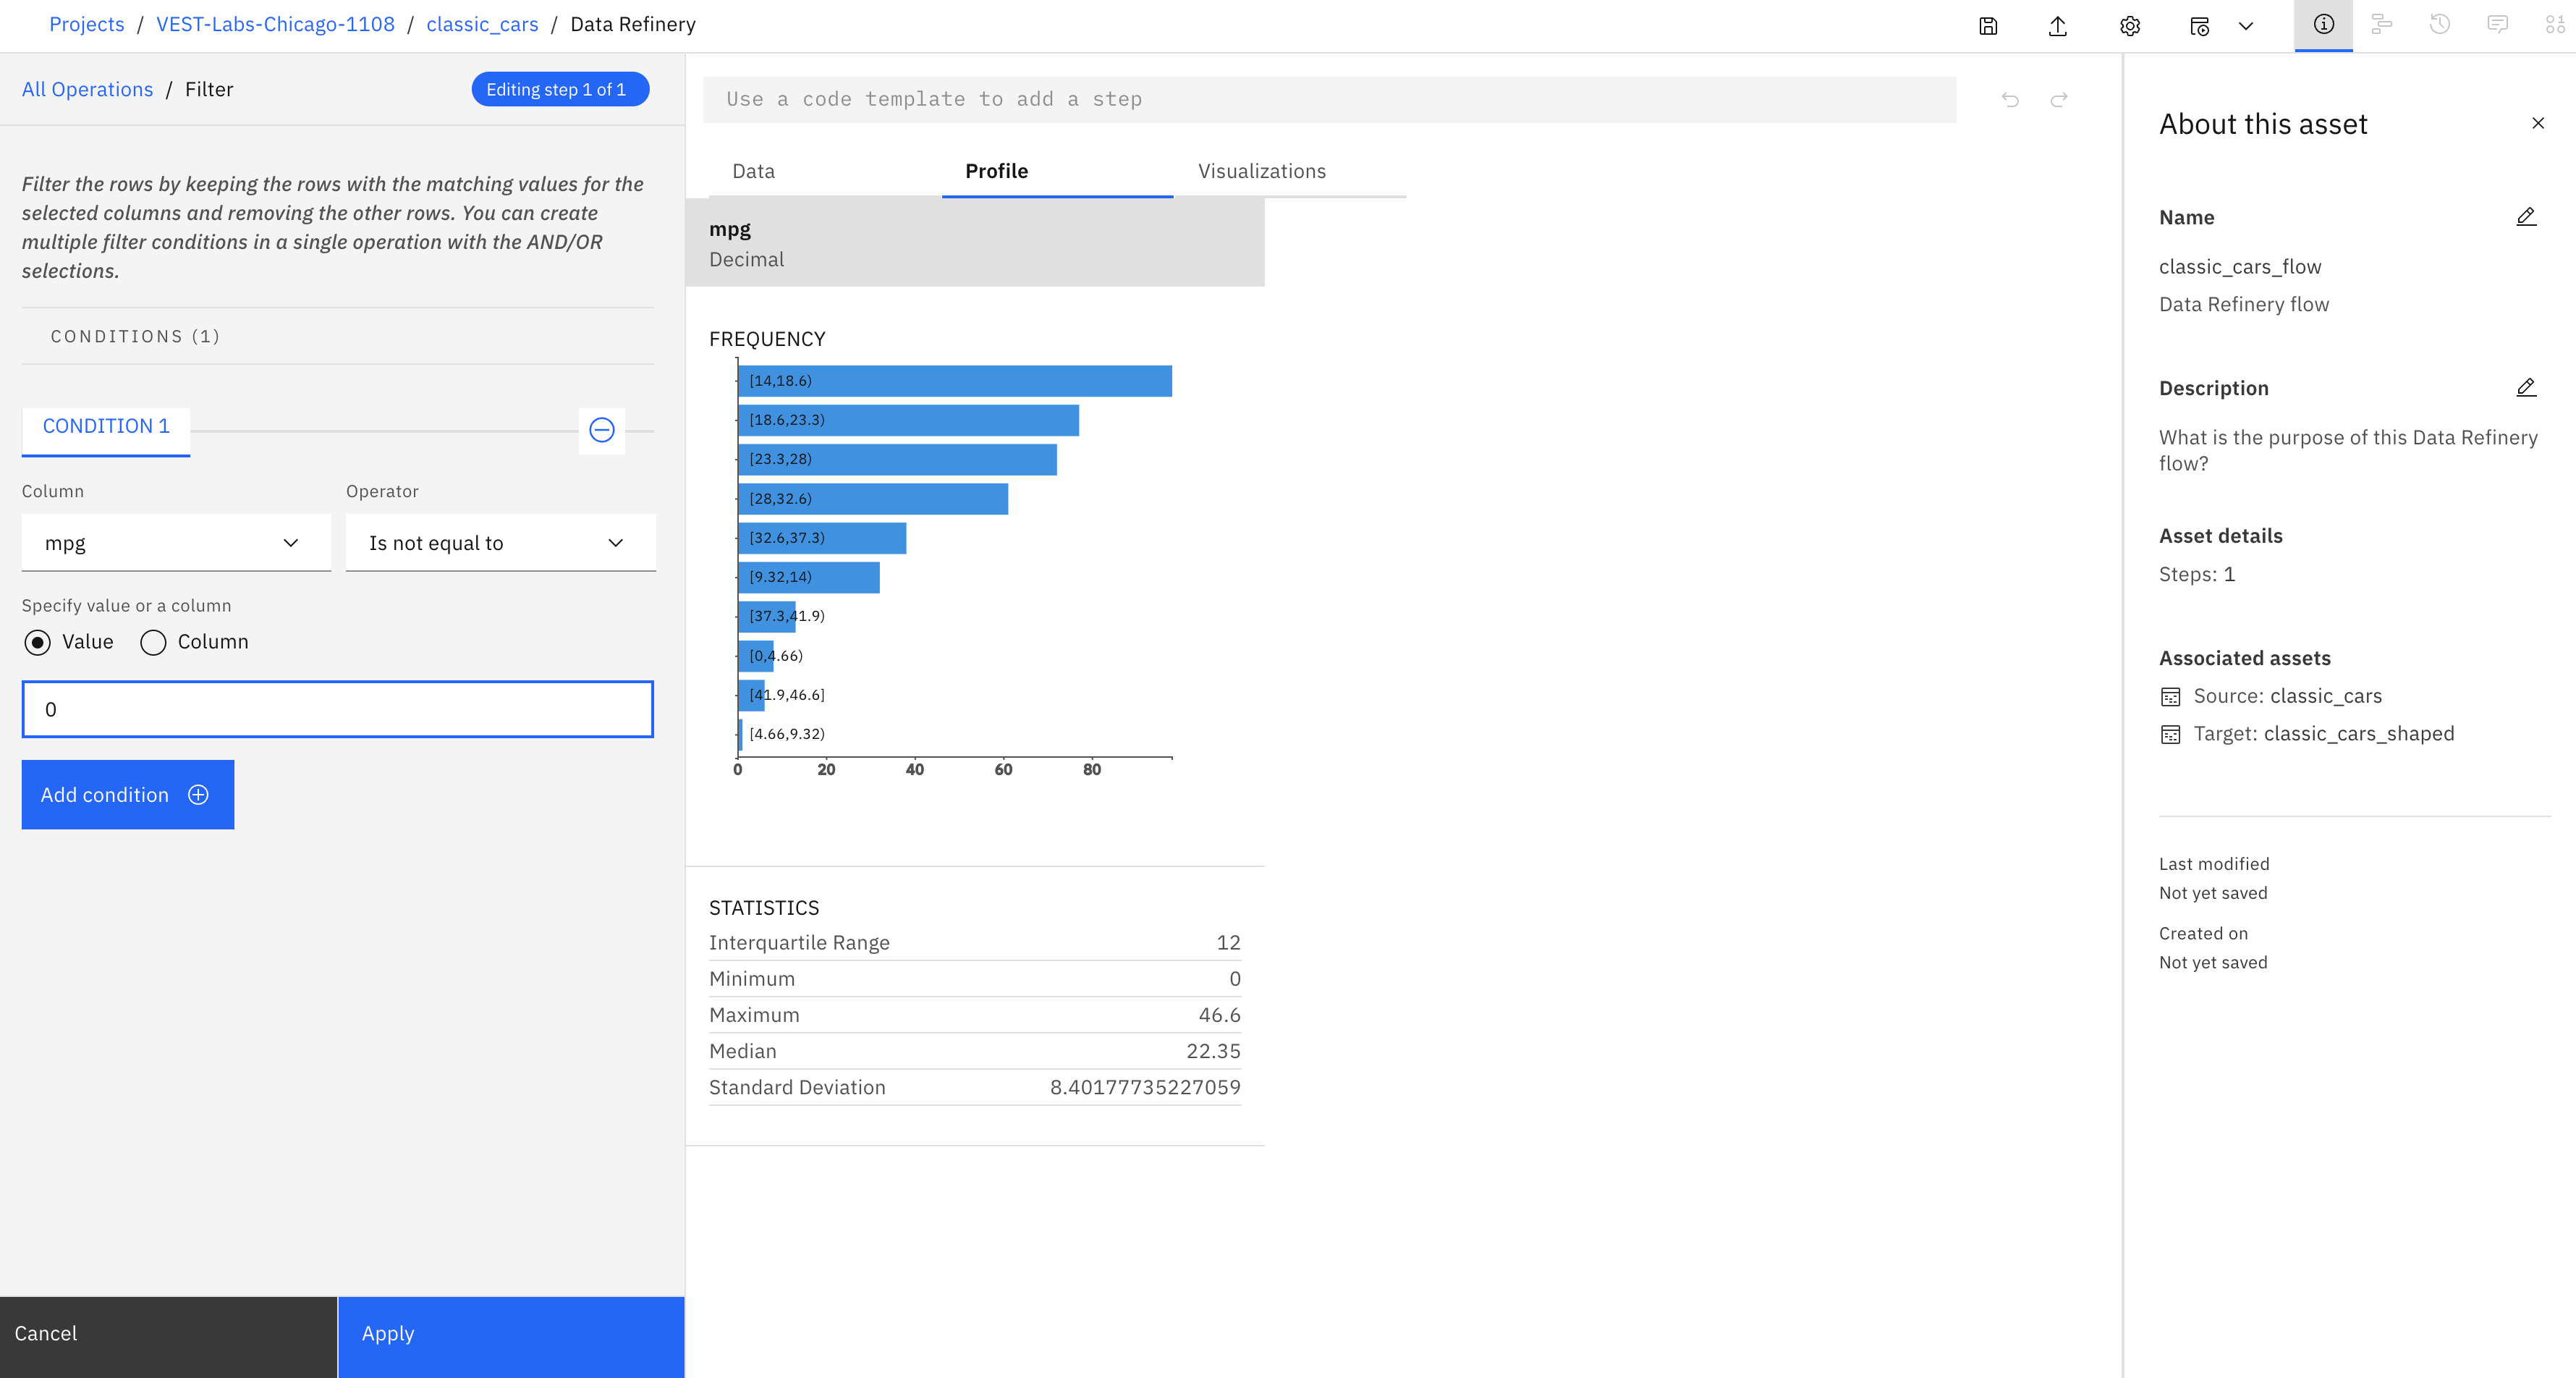
- In Data Refinery page, click on Profile tab. You will see statistics of all the columns here, you will notice the minimum value for the mpg column is 0. Select the column mpg and add the refining step by clicking New step from the lower left.
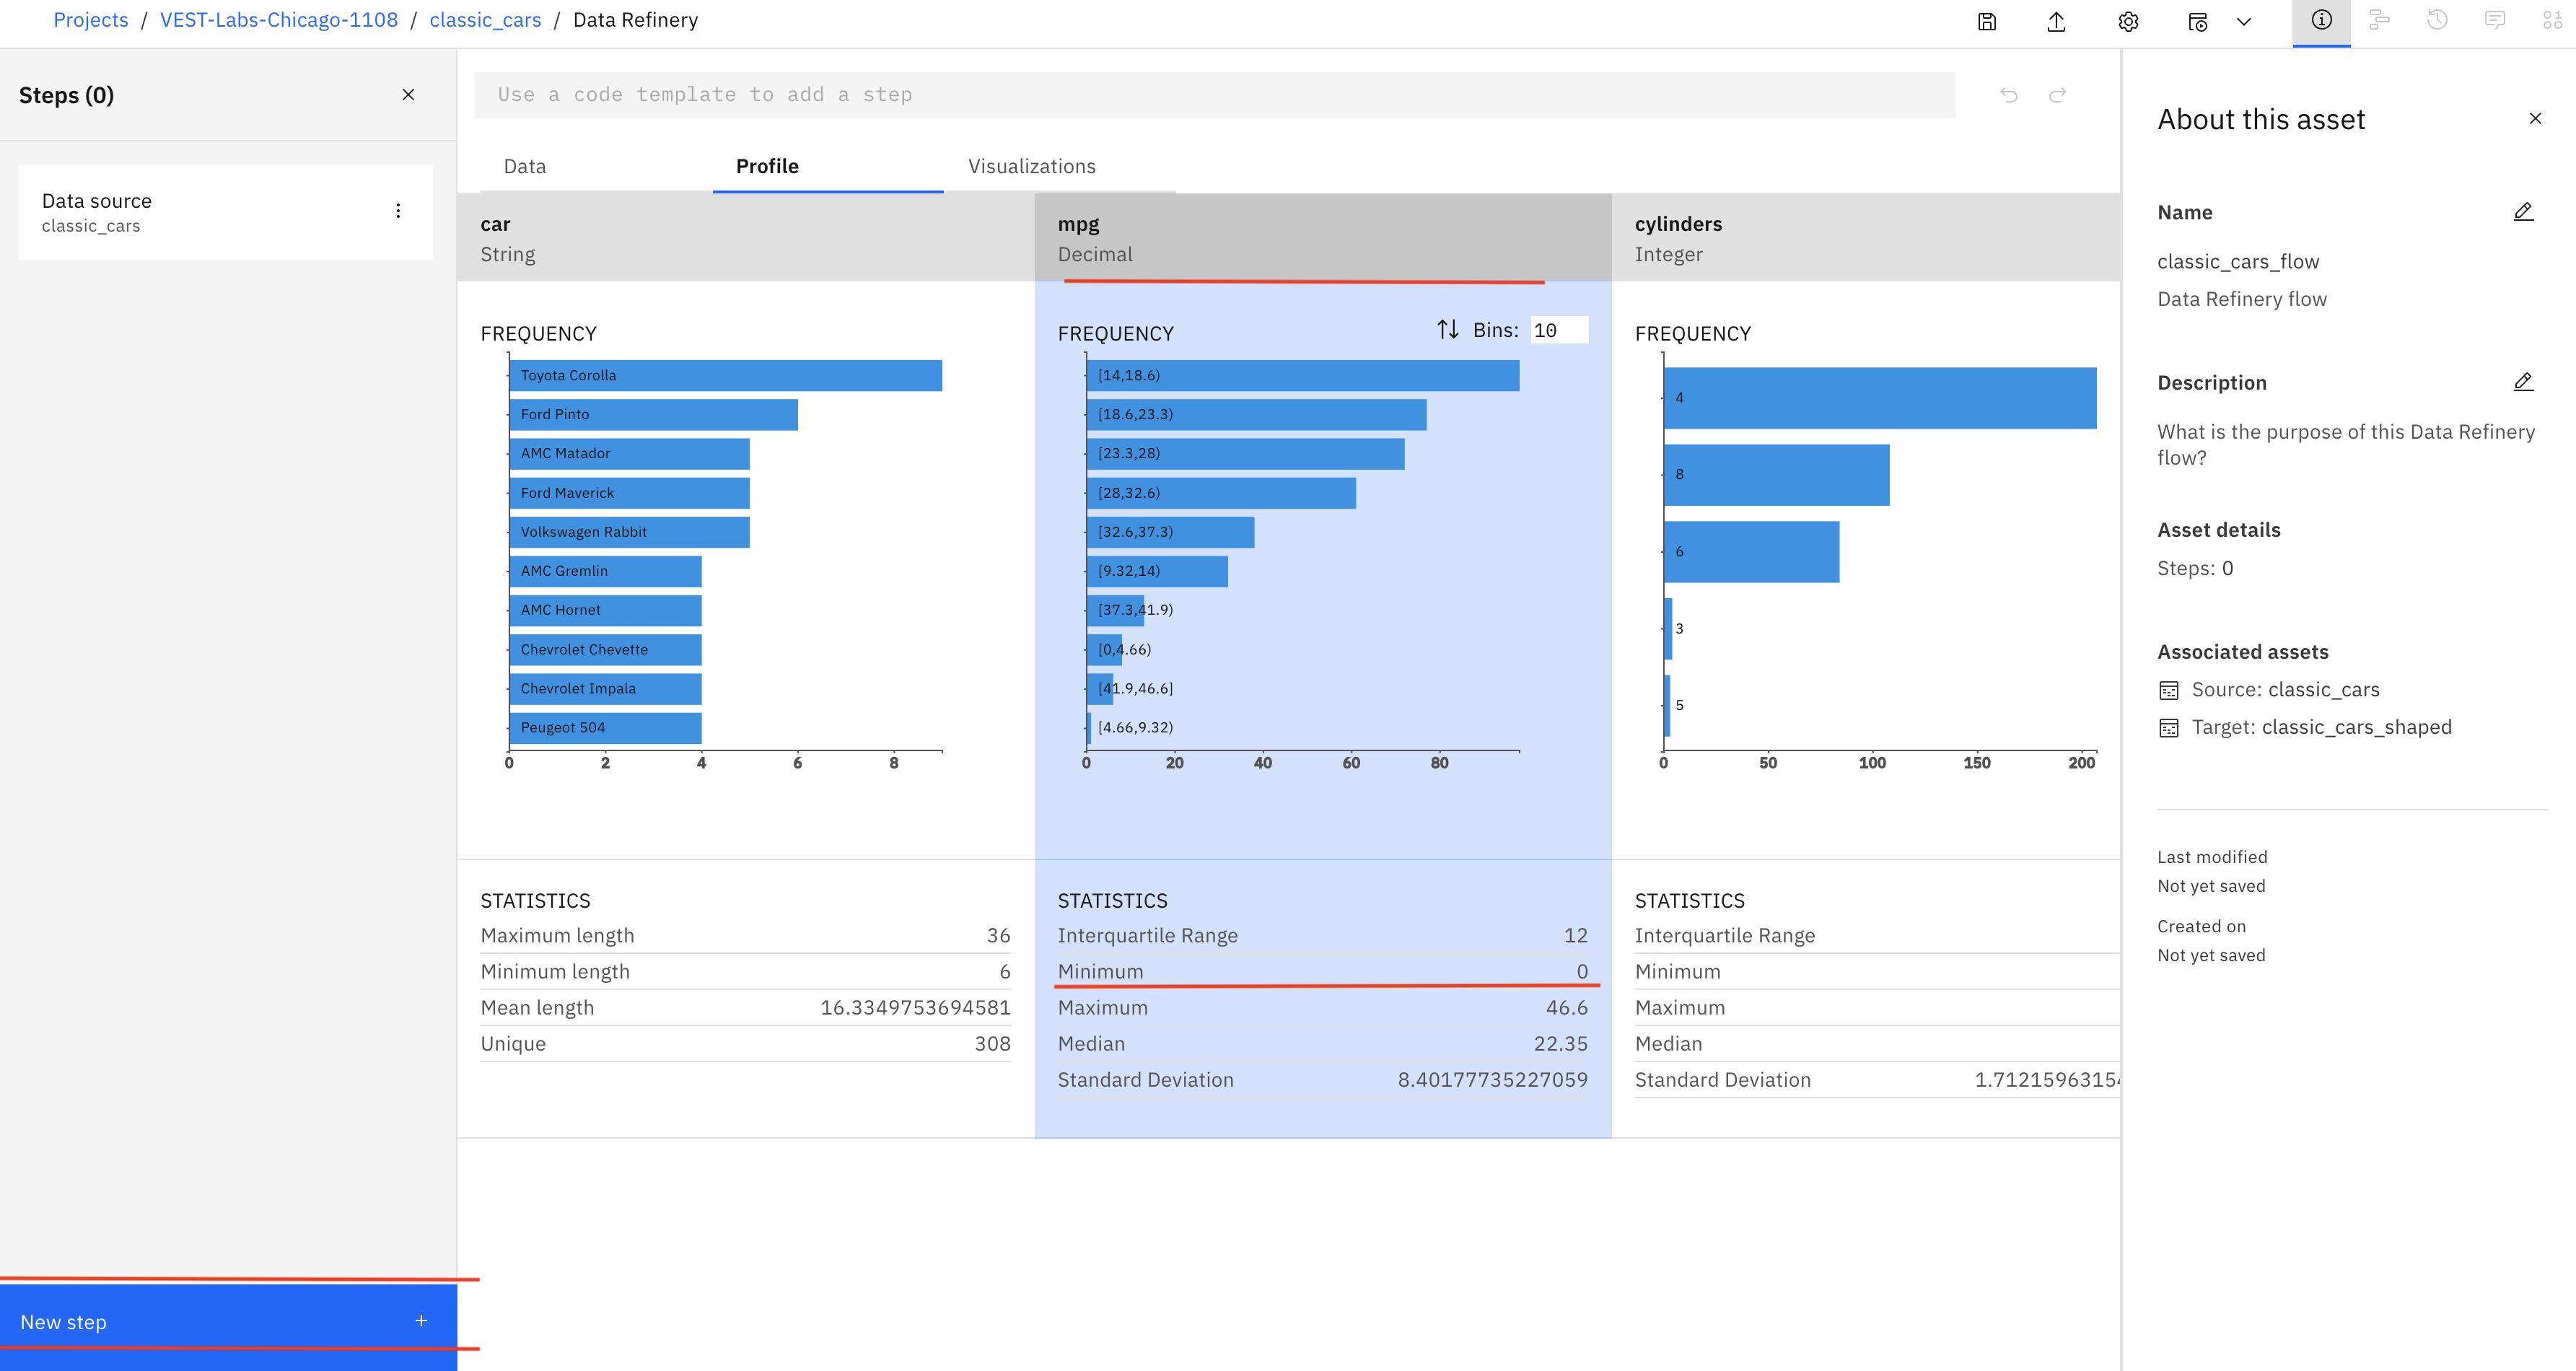
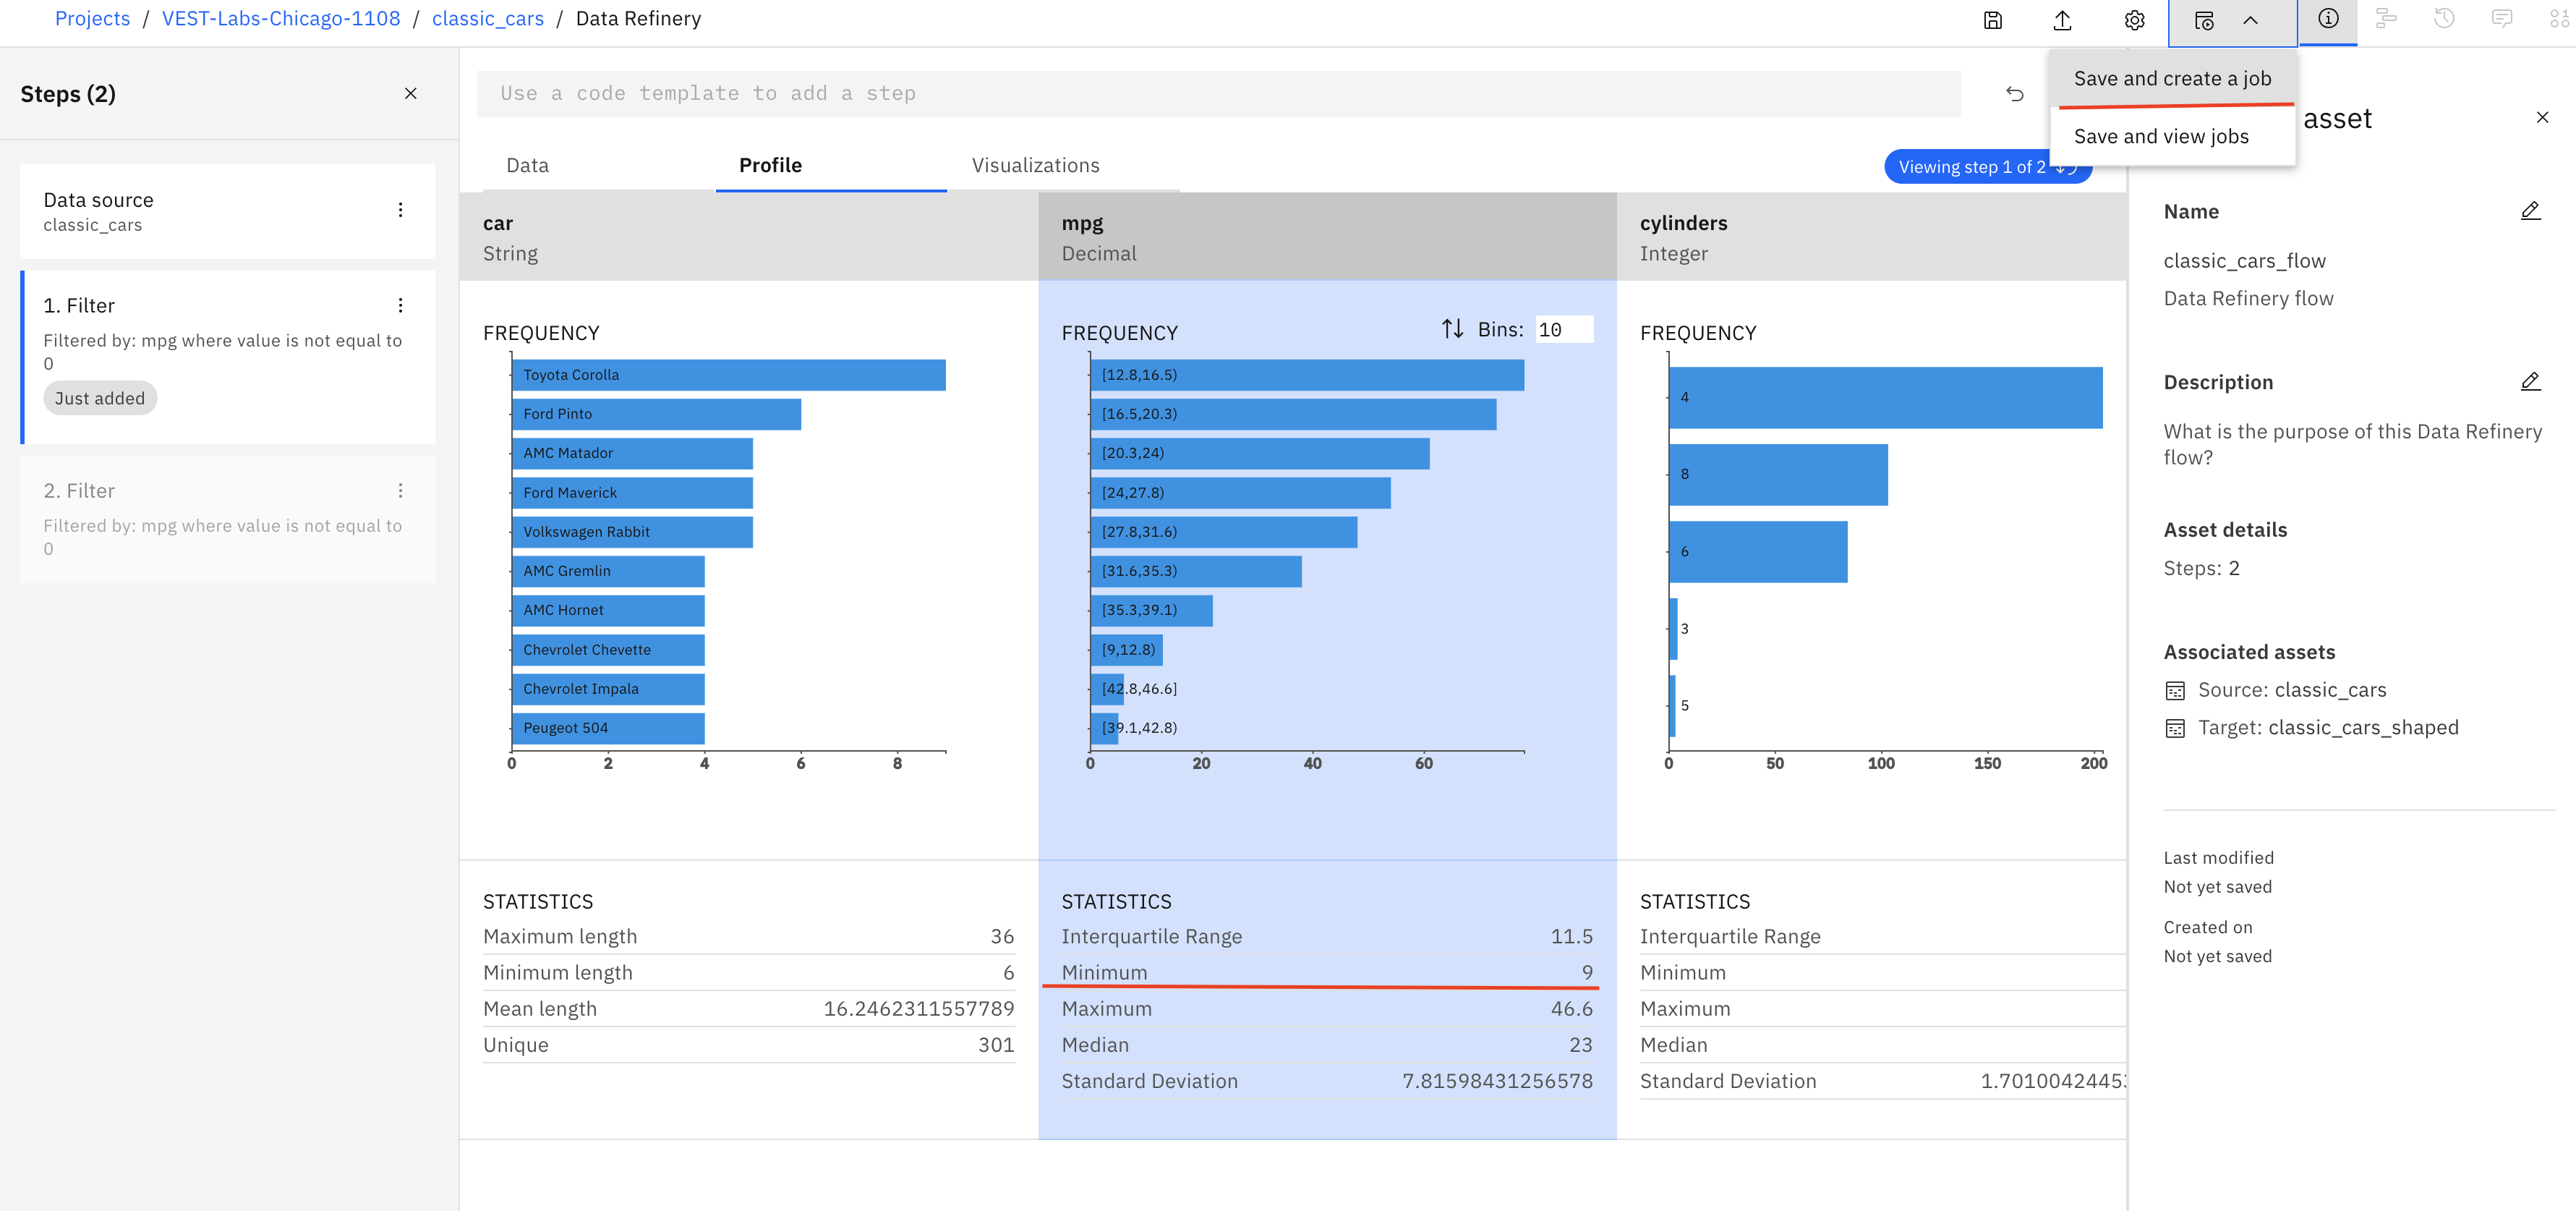
- Select Filter from CLEANSE option in the left side panel. Select mpg from Column, Is not equal to from Operator and Value 0. Click Apply, and you will notice, the mpg minimum value is changed to 9.
- Let us create a job to cleanse this column. Select Save and create a job from the upper left.
- Enter the job detail as follows and click on Create and run
- Name: cleanse mpg columns with value 0
- Description: cleanse mpg columns with value 0
- Configure: dont change
- Schedule Off
- Notify On
- You will get a notification on the upper right for the successful creation of a job. You can click on the notification detail link to go to the job page. Once the job is completed in a couple of minutes, you will receive another notification.
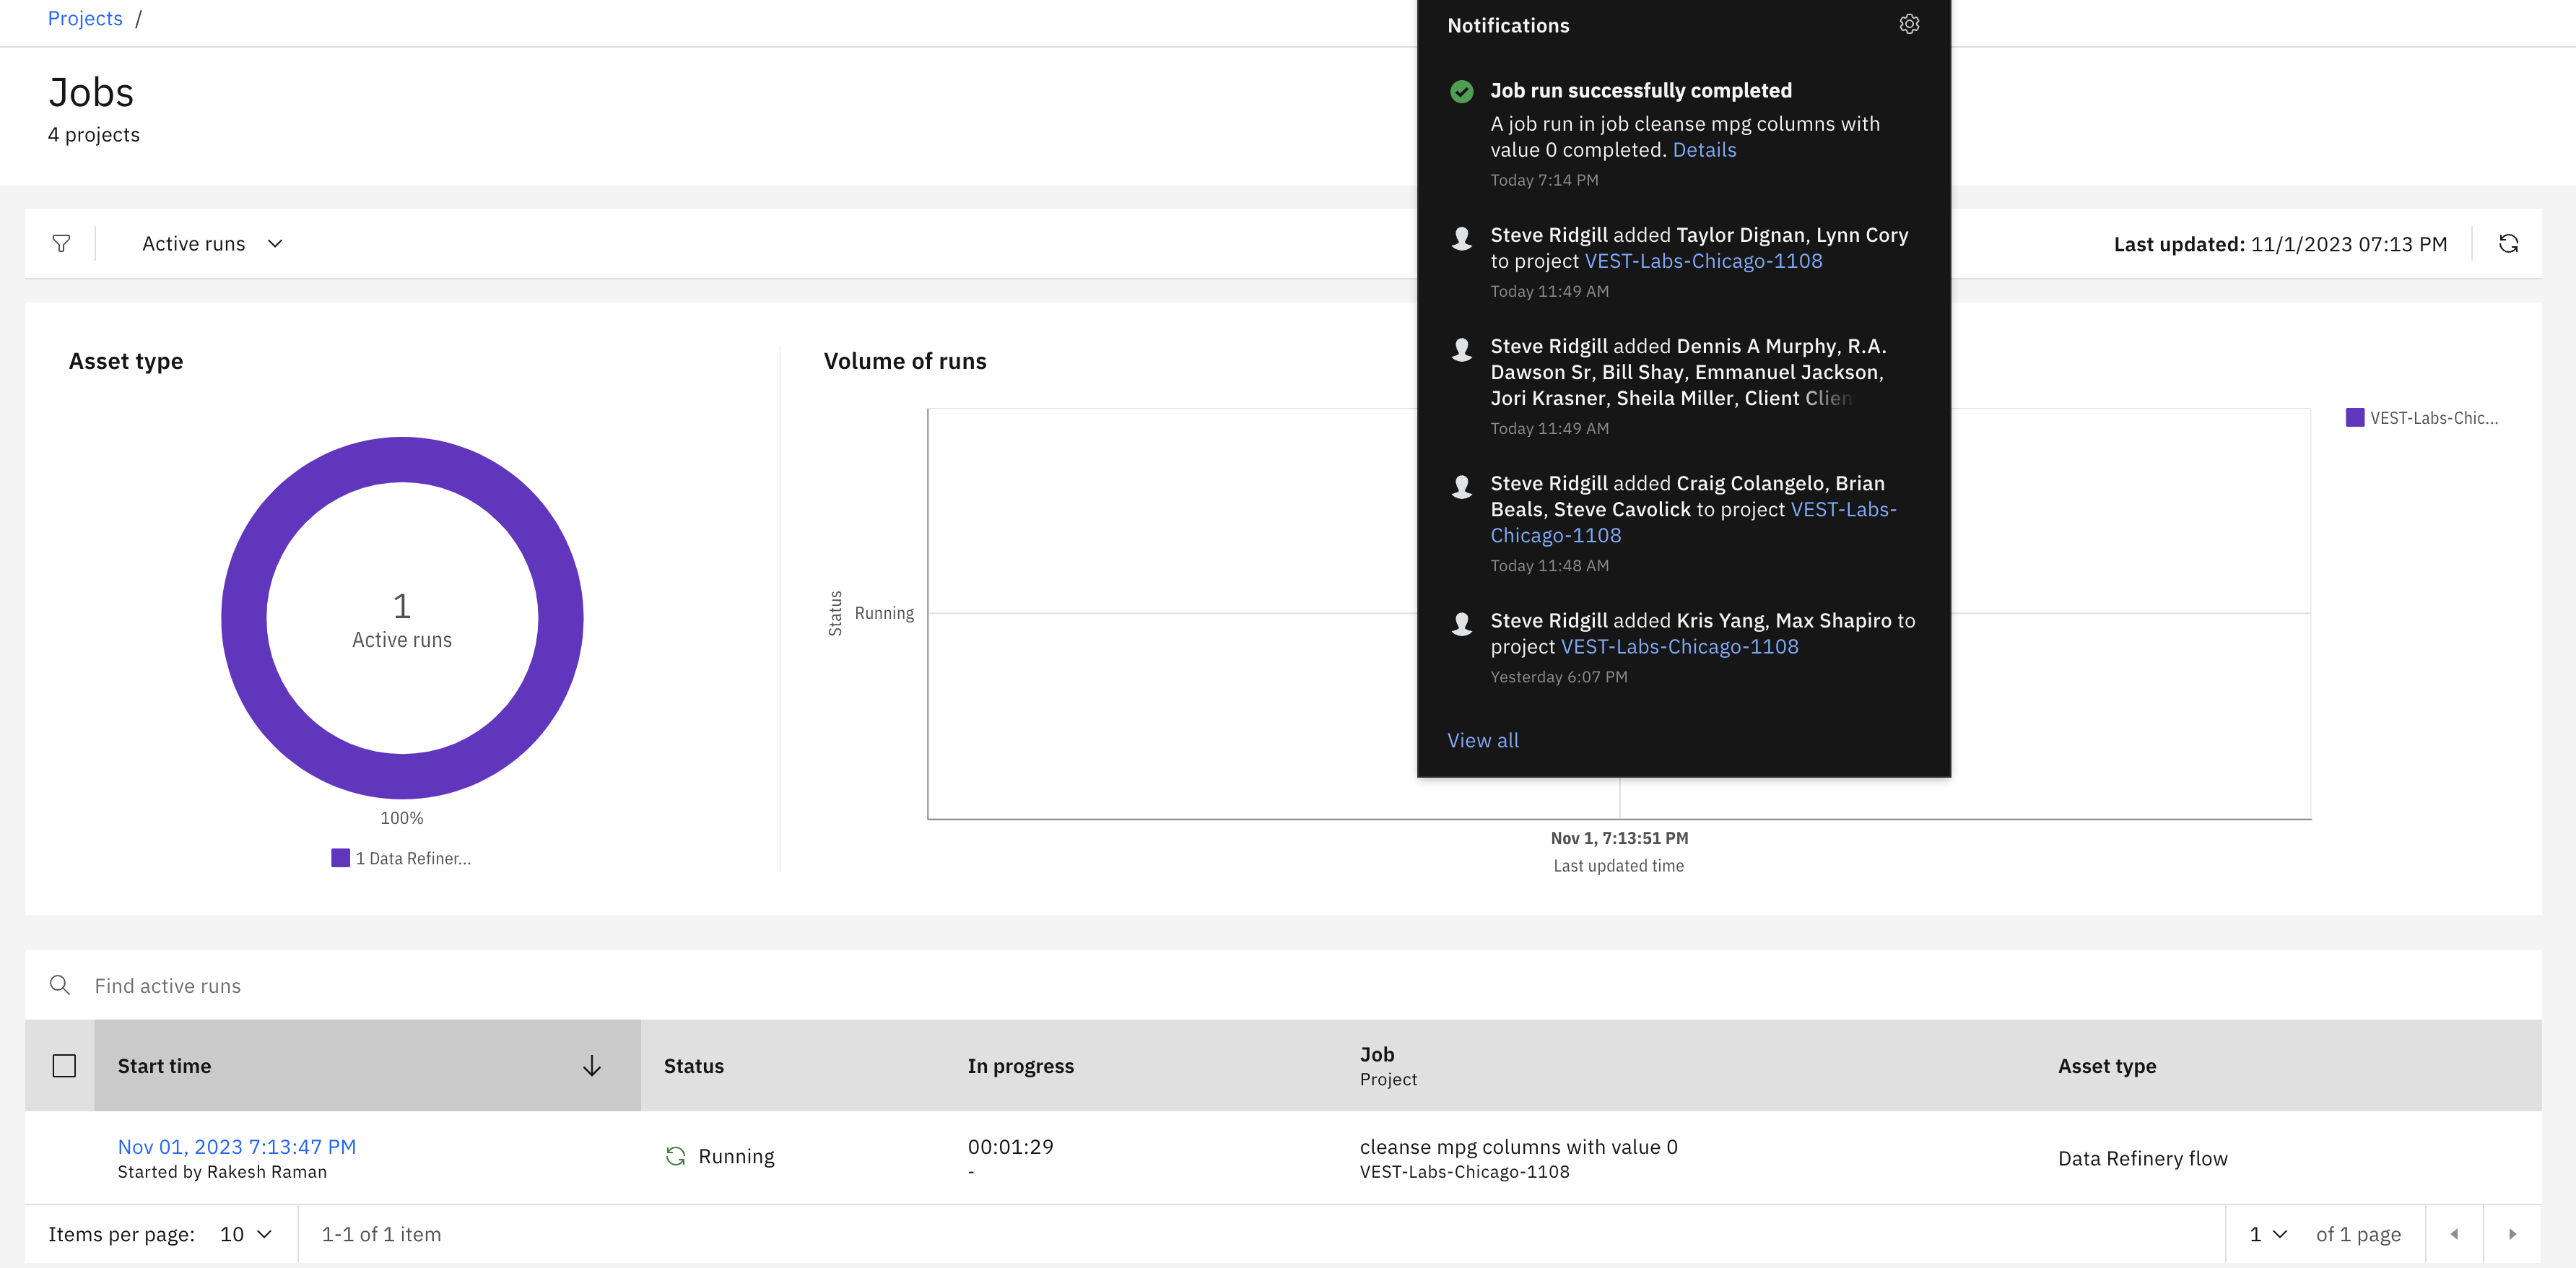
- You can navigate to your watsonx.ai project and you will observe new asset called classic_cars_shaped is created if you go to the Jobs tab, you will see the newly created job and its status.

-
Click on the classic_cars_shaped asset from the list of assets. You will notice all the rows with mpg value 0 are removed.
-
Now let's explore data graphically. Click on the Visualization tab. Select the following columns for visualization: mpg, cylinder, weight, and origin. Then click on the Visualize data button.

-
You have option to visualize the data in different charts listed on top of the page. You can slect Scatter plot chart for this lab. You can also change the value of the graph attiributes.

You have learned, how to bring data from IBM watsonx.data to IBM watsonx.ai and refine and visualize those data.
Congratulations, you've completed L3+ lab 110.
Click, watsonx.data to go to watsonx.data home page.