QRadar Demonstration with a Compliance Use Case and User Behavior Analytics
Introduction
This lab will help you learn important features of QRadar SIEM and how to consistently and reliably deliver a customer demo using the compliance use case and the UBA app. The lab and demo outline is as follows:
-
Begin with the IBM Security® QRadar® New UI (also known as the Analyst Workflow app) and Pulse Dashboard.
-
Provide a short review of the dashboards using the Compliance overview dashboard and GDPR dashboard.
-
Continue with the offense dashboard and provide deep offense analysis using a GDPR example. Cover major offense attributes, such as index, magnitude, event categories, insights (rules, building blocks and reference sets), and events.
-
Switch to the Use Case Manager (UCM) app. Show the app's value to analyze rules and visualize relations and dependencies with building blocks and reference sets. Finish on a short overview of the Reference Data Management app.
-
Using UCM, understand the relations between the MITRE ATT&CK framework and QRadar rules. Learn and explain the Content Packs, IBM Security App Exchange, and the QRadar Assistant App.
-
Explain the value of the User Behavior Analytics (UBA) app and provide an overview of the UBA console.
How to use this lab document
This lab is structured to both introduce you to QRadar SIEM and to be a starting point for you to create demonstations to customers. Text that appears like this will include actions to perform and important information to understand when going over the lab. It will be helpful to read all of this text.
There will also be blue "note" boxes like this that contain additional narration talking points that you would use in the customer conversation while performing a demo based on this lab content. For the lab, you can quickly skim over these notes for additional context.
You must have completed all steps in the setup lab. This includes running the noiseOn.sh and runUC.sh scripts to prepare the QRadar SIEM instance with data used in the examples.
Demo use case introduction
Regulation has become crucial to cybersecurity in the wake of numerous high-profile data breaches. Many industry and geographic regulations put significant pressure on organizations to comply with requirements to protect customer data. Each set of regulations -- HIPAA, PCI, GDPR, SOX, and so on contain different definitions and requirements, all of which impact the way an organization works. IBM Security QRadar provides enriched configurations that can automate regulatory compliance data collection, correlation, and reporting.
The objective of this use case is to demonstrate how the QRadar SIEM portfolio enables security analysts to identify, detect, and respond to suspicious network behavior relating to compliance shielded assets.
Protecting critical and regulated data is at the core of our security portfolio. It's a multifaceted endeavour and takes a multi-layered approach.
QRadar itself has obtained vital compliance certifications that validate product security so that you can have confidence in its solutions,
including DHS CDM Approved Product List, FIPS 140-2 Level 1 and Level 2: Cert #2737 and #2554, and enabling [NIST 800-53 Security Controls].QRadar is equipped with the analytics to alert on a multitude of use cases that enables organizations to remain compliant in an ever-growing world of regulations and requirements of today and into the future:
These are just some of the many use cases that can also be configured to
extend the quantity of compliance coverage:
- Suspicious activity performed on confidential data
- Deleted or modified sensitive data
- Emails containing sensitive files sent to a potentially hostile or
external host- Sensitive files shared with a guest user or group
- Sensitive files uploaded to a publicly accessible folder or allow
permissions- Files deleted or modified from sensitive file directories
- GDPR: personal data processed for objected users or transferred to
third countries or regions
This demo analyzes a few compliance use cases and offenses.
Compliance overview in the Pulse dashboard
-
Use a web browser to access the QRadar Console.
-
In the QRadar Console, select Menu > Try the New UI.
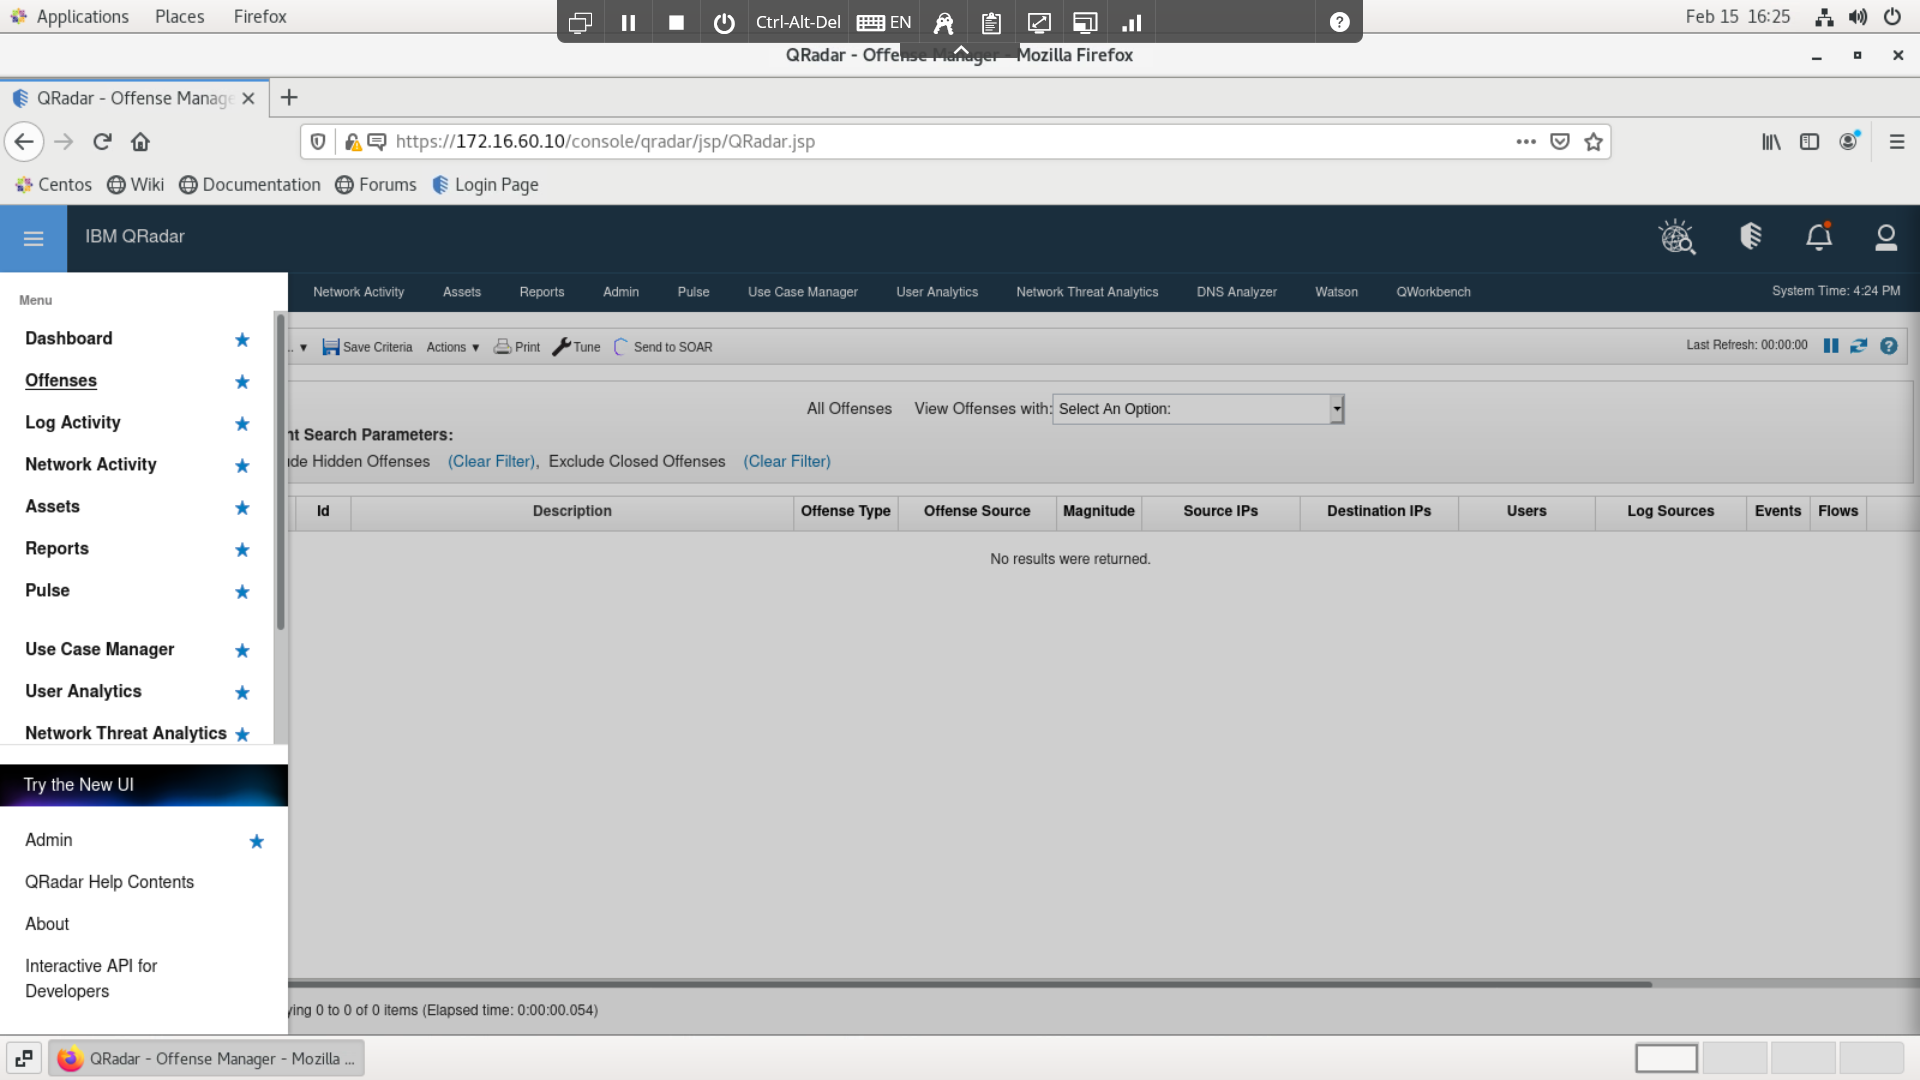
This opens the QRadar new dark interface, which can load
multiple dashboards. The dashboards are configurable and can be
customized and developed separately. The dashboards are loaded in the
PULSE app. -
From the main menu, open the PULSE app.
The PULSE app is one of many apps decoupled from the QRadar SIEM core
product, making the overall solution more modular. The app can be
downloaded and installed from the IBM Security App Exchange, but it
comes preinstalled with the latest QRadar SIEM version. -
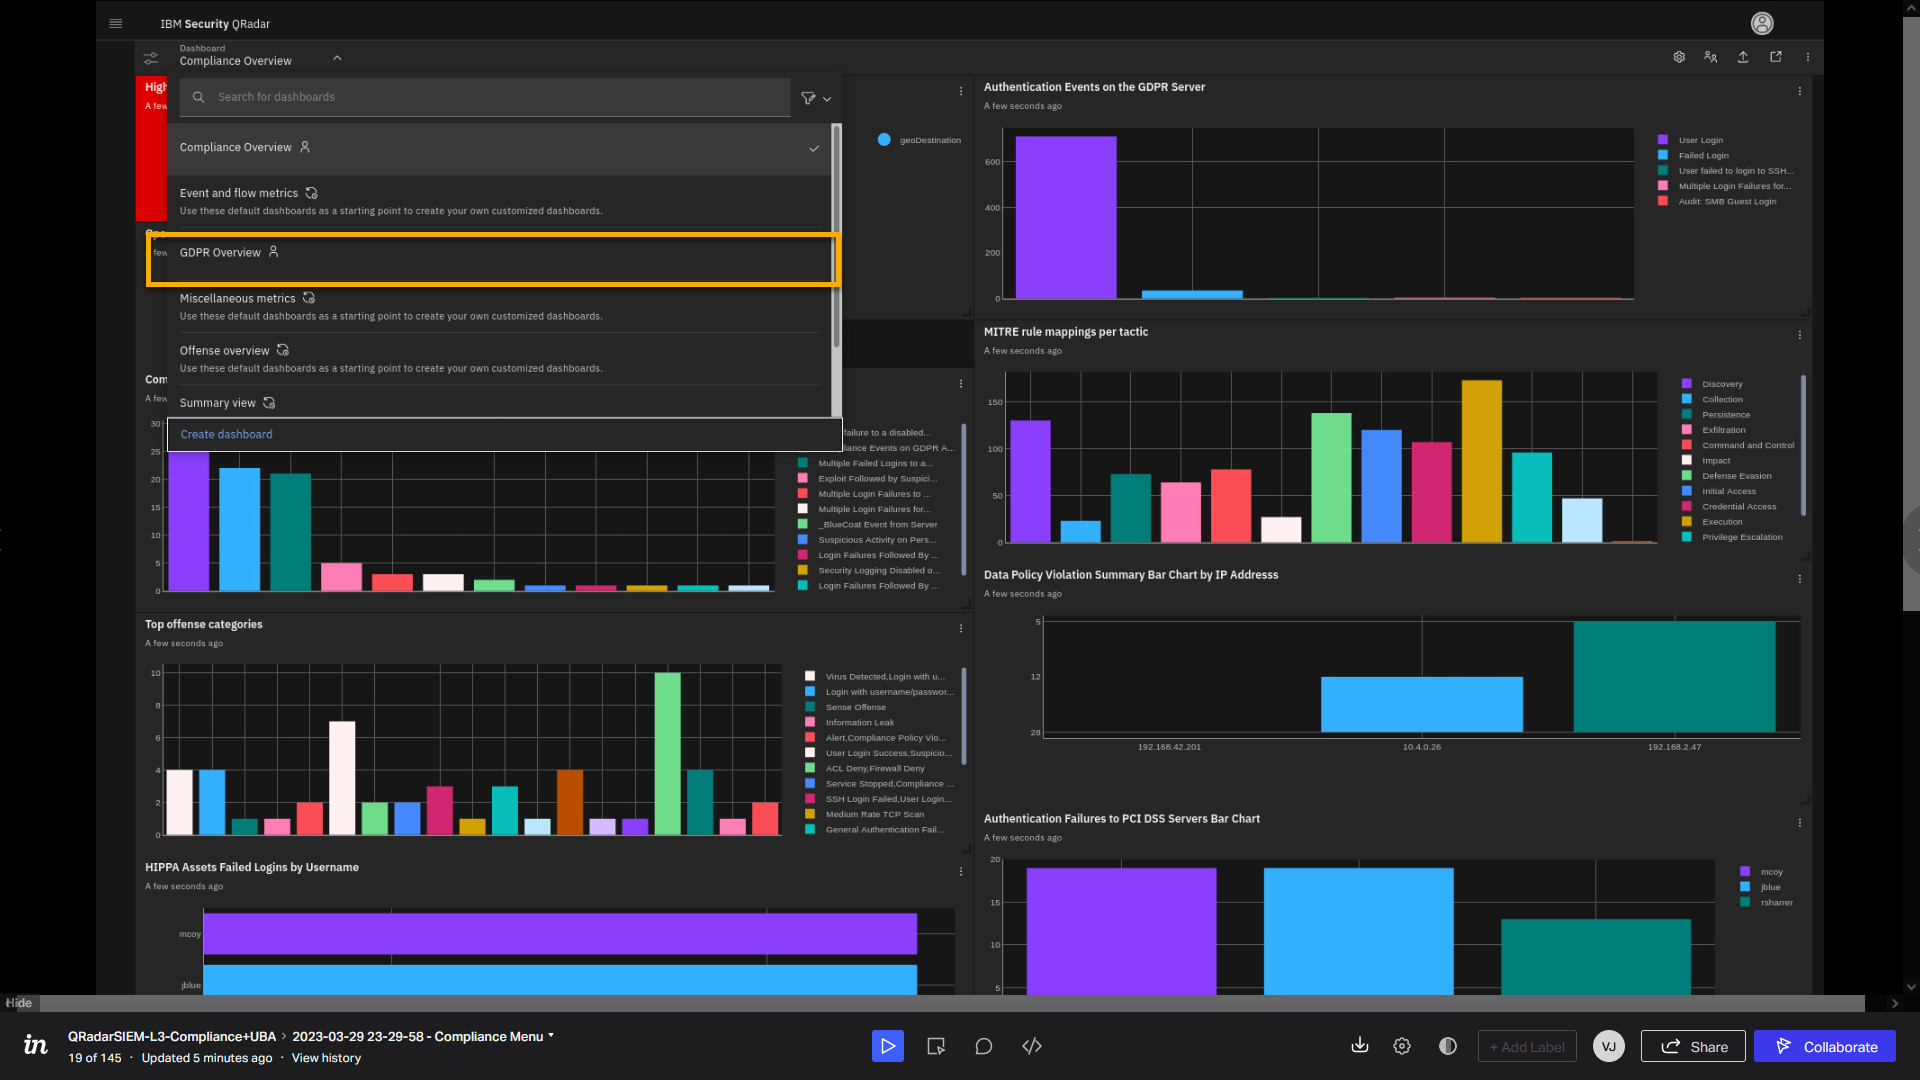
Click the Dashboard menu.
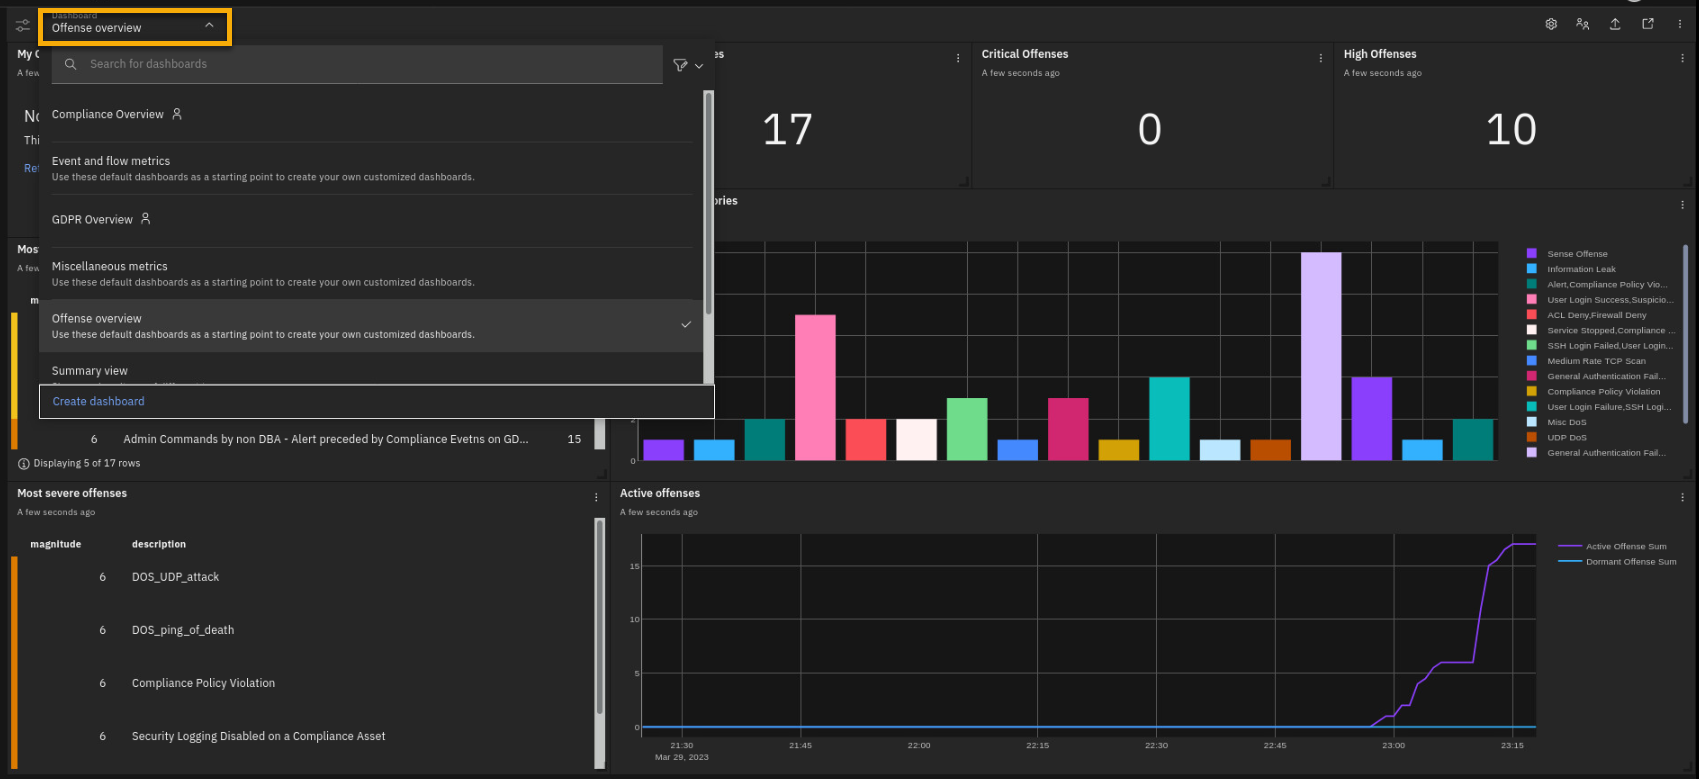
There are multiple dashboards that you can add or remove and customize. Dynamic real-time dashboards help analysts in a SOC (Security Operations Center) and other QRadar teams to present different critical security information on the home page. You can also organize dashboards according to different needs and requirements. For example, there is a dashboard focused on the compliance insights into the security posture of your organization.
-
Select the Compliance Overview dashboard.
Hint: Due to random generated events, the live system data can be
slightly different than the screen captures in the demo guide.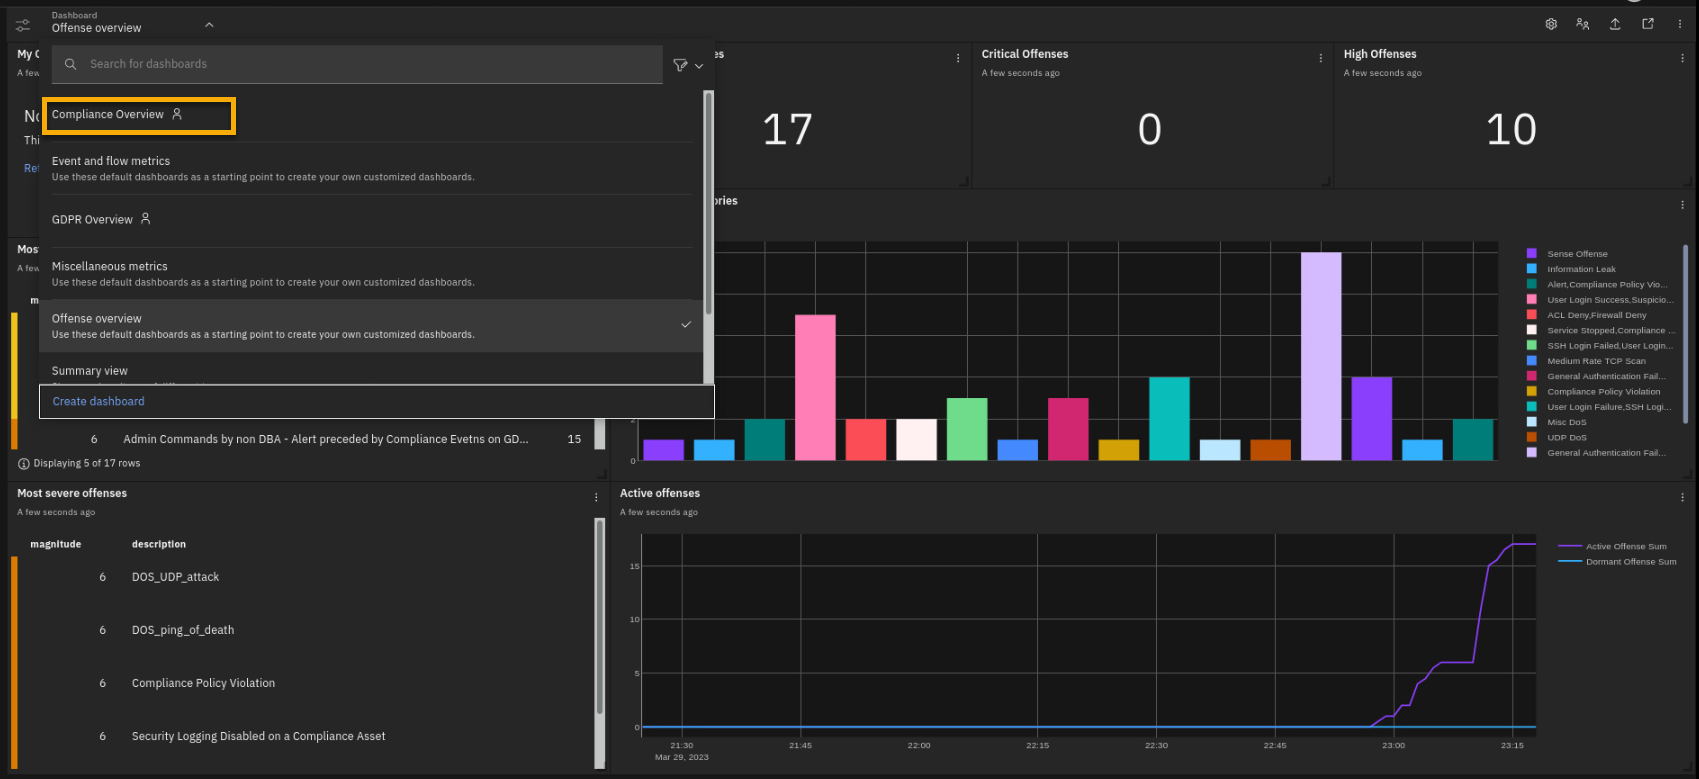
This compliance-centred dashboard captures all the use cases, also known as QRadar rules, that have triggered based on the events, network traffic, vulnerabilities, and user activity on your network and assets related to different compliance regulations. The dashboard is delivered by the content pack from the IBM Security App Exchange site.
The App Exchange is a portal where IBM and the whole IBM Security community can develop add-on features to QRadar SIEM core and other IBM Security products. You can also build your own dashboards and portlets.
This will be on the quiz
The Compliance dashboard has multiple portlets or widgets. Many of these graphs are interactive, and you can customize each of these widgets using QRadar Ariel Query Language (AQL) statement searches.
-
Focus on the upper-right corner of the dashboard.
Review the Authentication Events on the GDPR Server bar chart on the upper right.
-
Demonstrate that graphs have some interactivity by clicking the
User Login and Failed Login labels to hide those events and shift
focus on the rest of the generated events.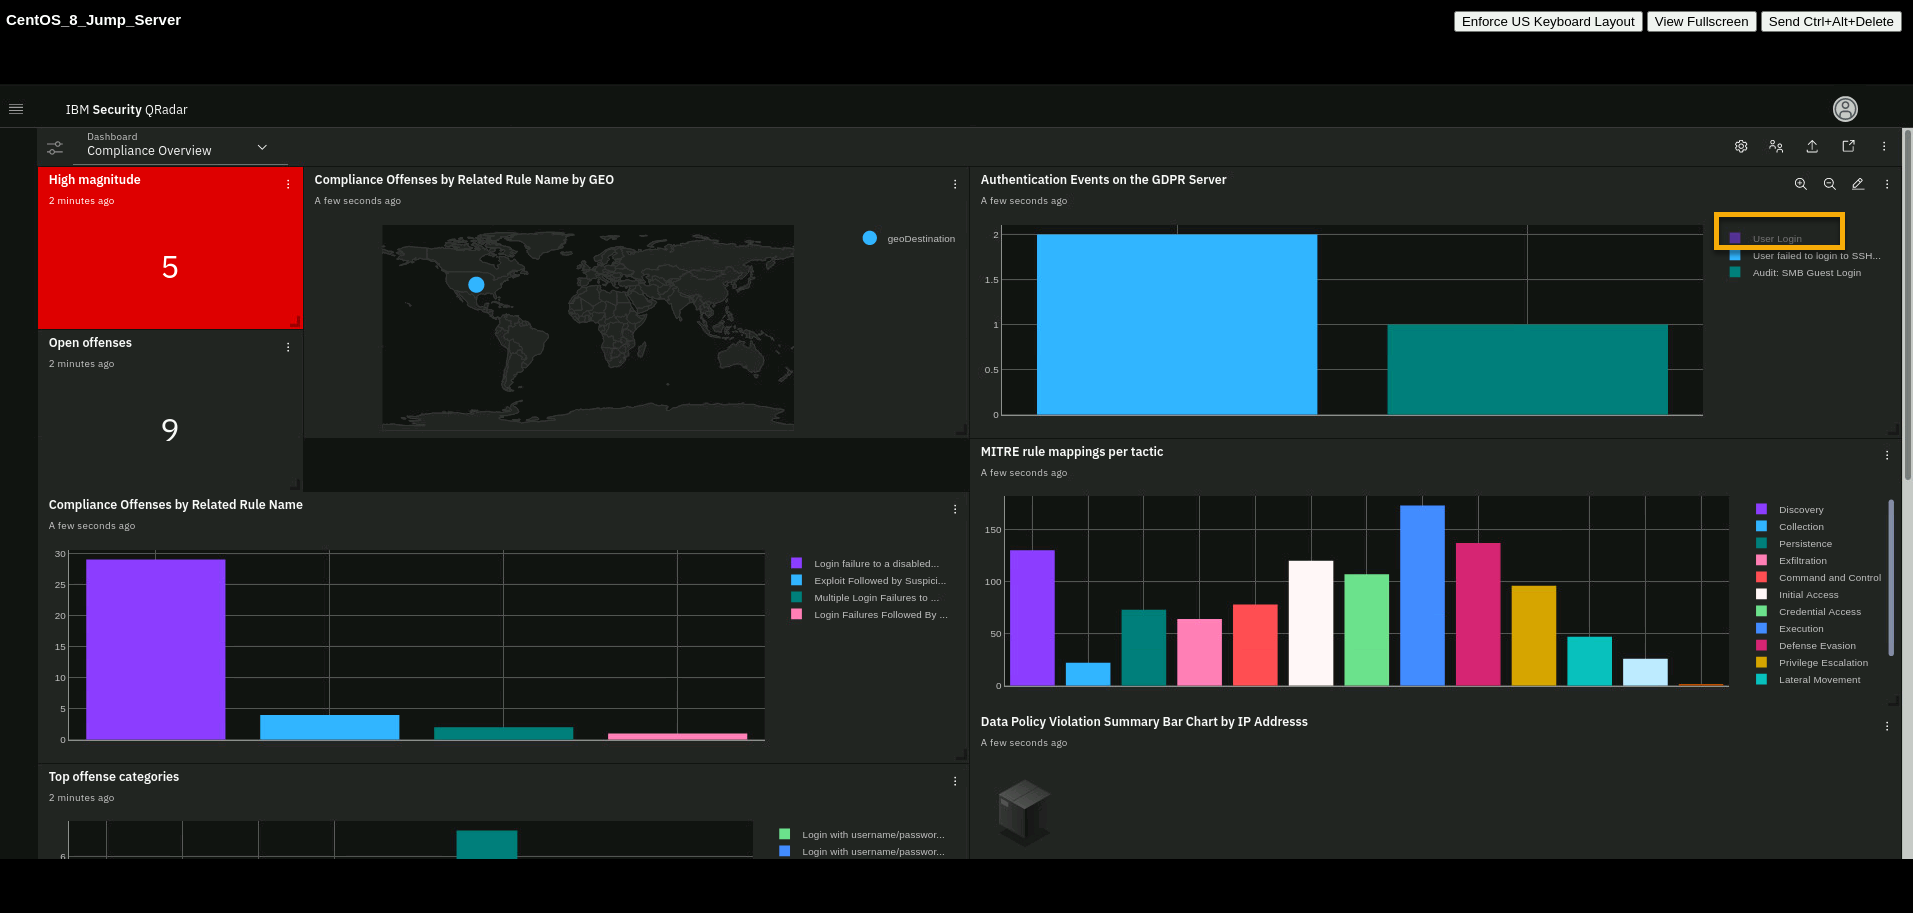
Note how the graph is interactive. By hiding outlier data, you can more
easily focus your investigation on the important data, such as different
types of login failures in this case.Optionally, you can spend some time reviewing each visualization because it provides great insight to an admin or executive about all their compliance-relevant servers and the login failures observed on each by username. You can pull any query results into a chart or table visualization; these are just a few examples.
Also note that QRadar can show dashboards and reports based on the MITRE ATT&CK Framework. We will discuss it later in more detail.
Another feature of the Compliance Overview dashboard to investigate is the Threats from X-Force Exchange found on Compliance Servers panel.
-
Scroll to the bottom of the dashboard to find this widget.
The IBM Security X-Force Threat Intelligence feed is included with the standard license as part of the Service & Support contract, but you must enable it.
By enabling X-Force Threat Intelligence feeds in QRadar, you can receive X-Force Threat Intelligence information., While QRadar scans your
incoming logs and flows, this Threat Intelligence Information is used to create offenses if a valid Indicator of Compromise
(IOC) is found within your environment.The AQL query for the Threats from X-Force Exchange found on Compliance Servers widget is a focused search on whether any event with an IOC from the X-Force threat feeds is found within the compliance assets.
In this case, the widget has an empty graph. This is good and indicates that QRadar does not see any IOC in this environment.
-
To review the AQL query that feeds the visualization graph, select
the pencil (edit icon) of the HIPAA Assets Failed Logins by
Username widget.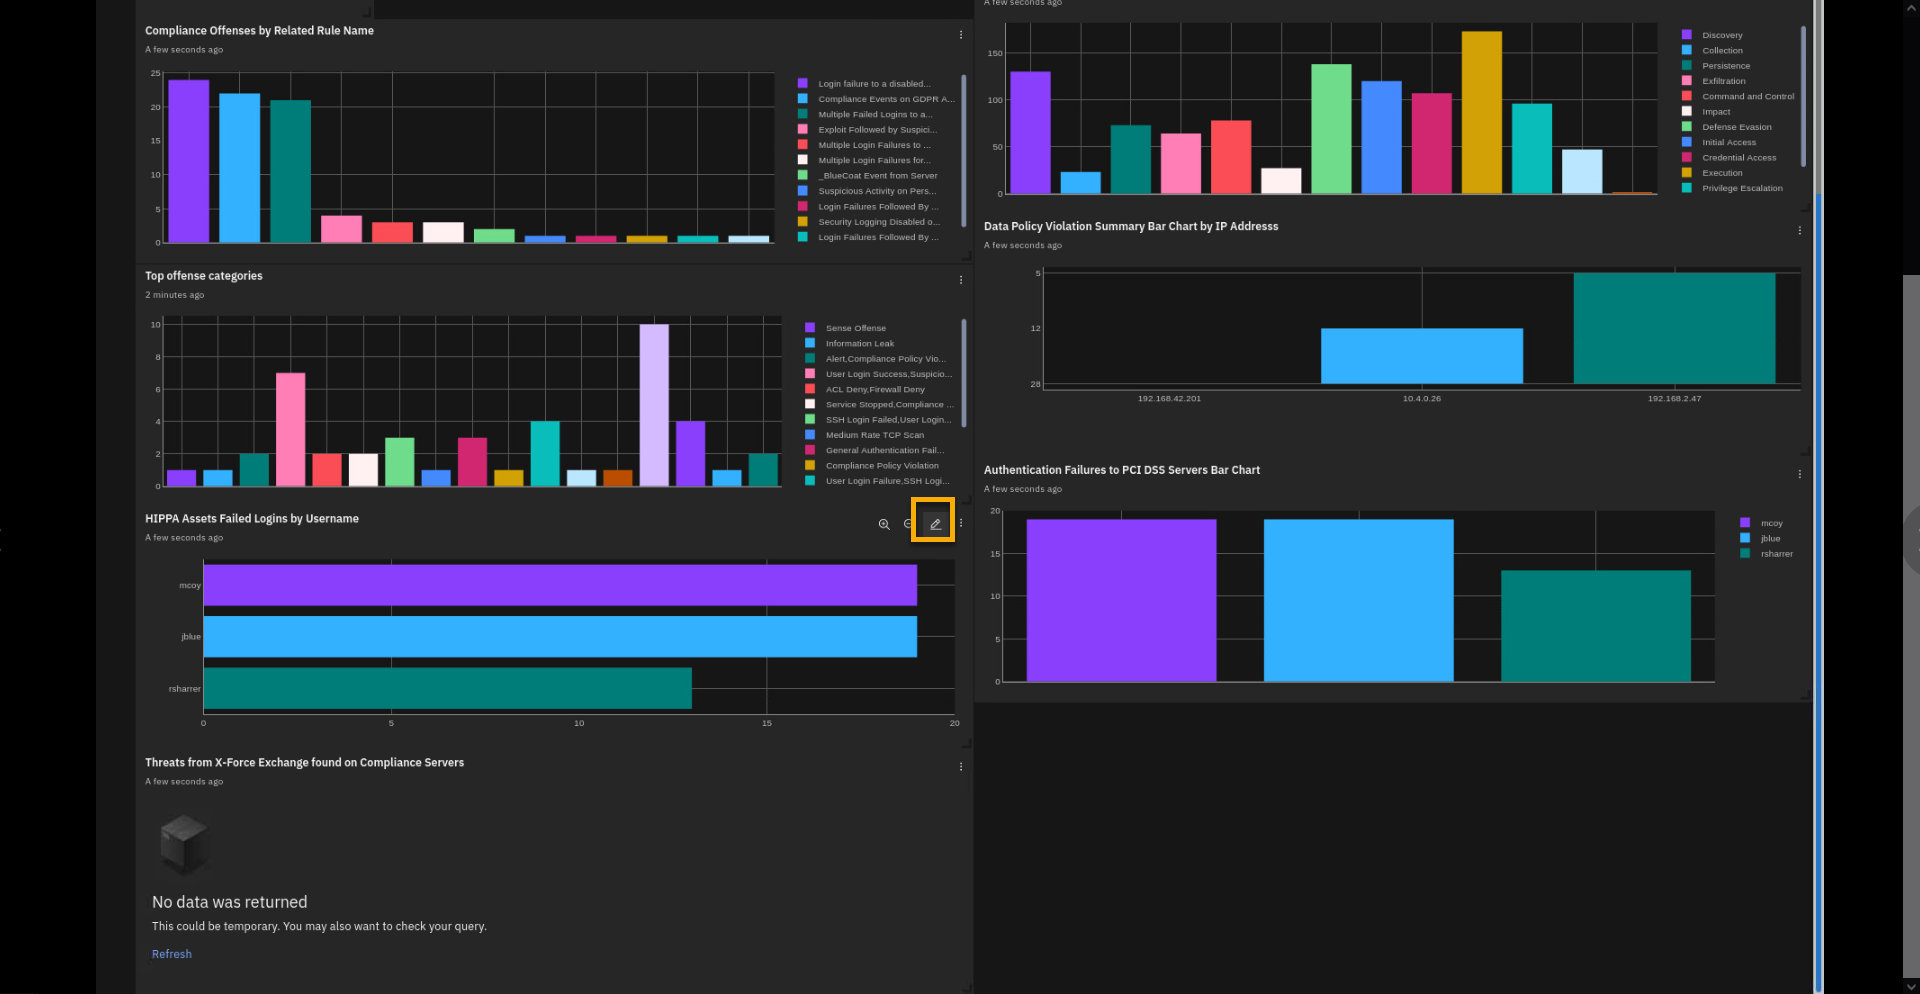
Let's look at the details of the HIPAA widget reporting on the failed
login by three users. -
In the Edit dashboard item screen, review the AQL.
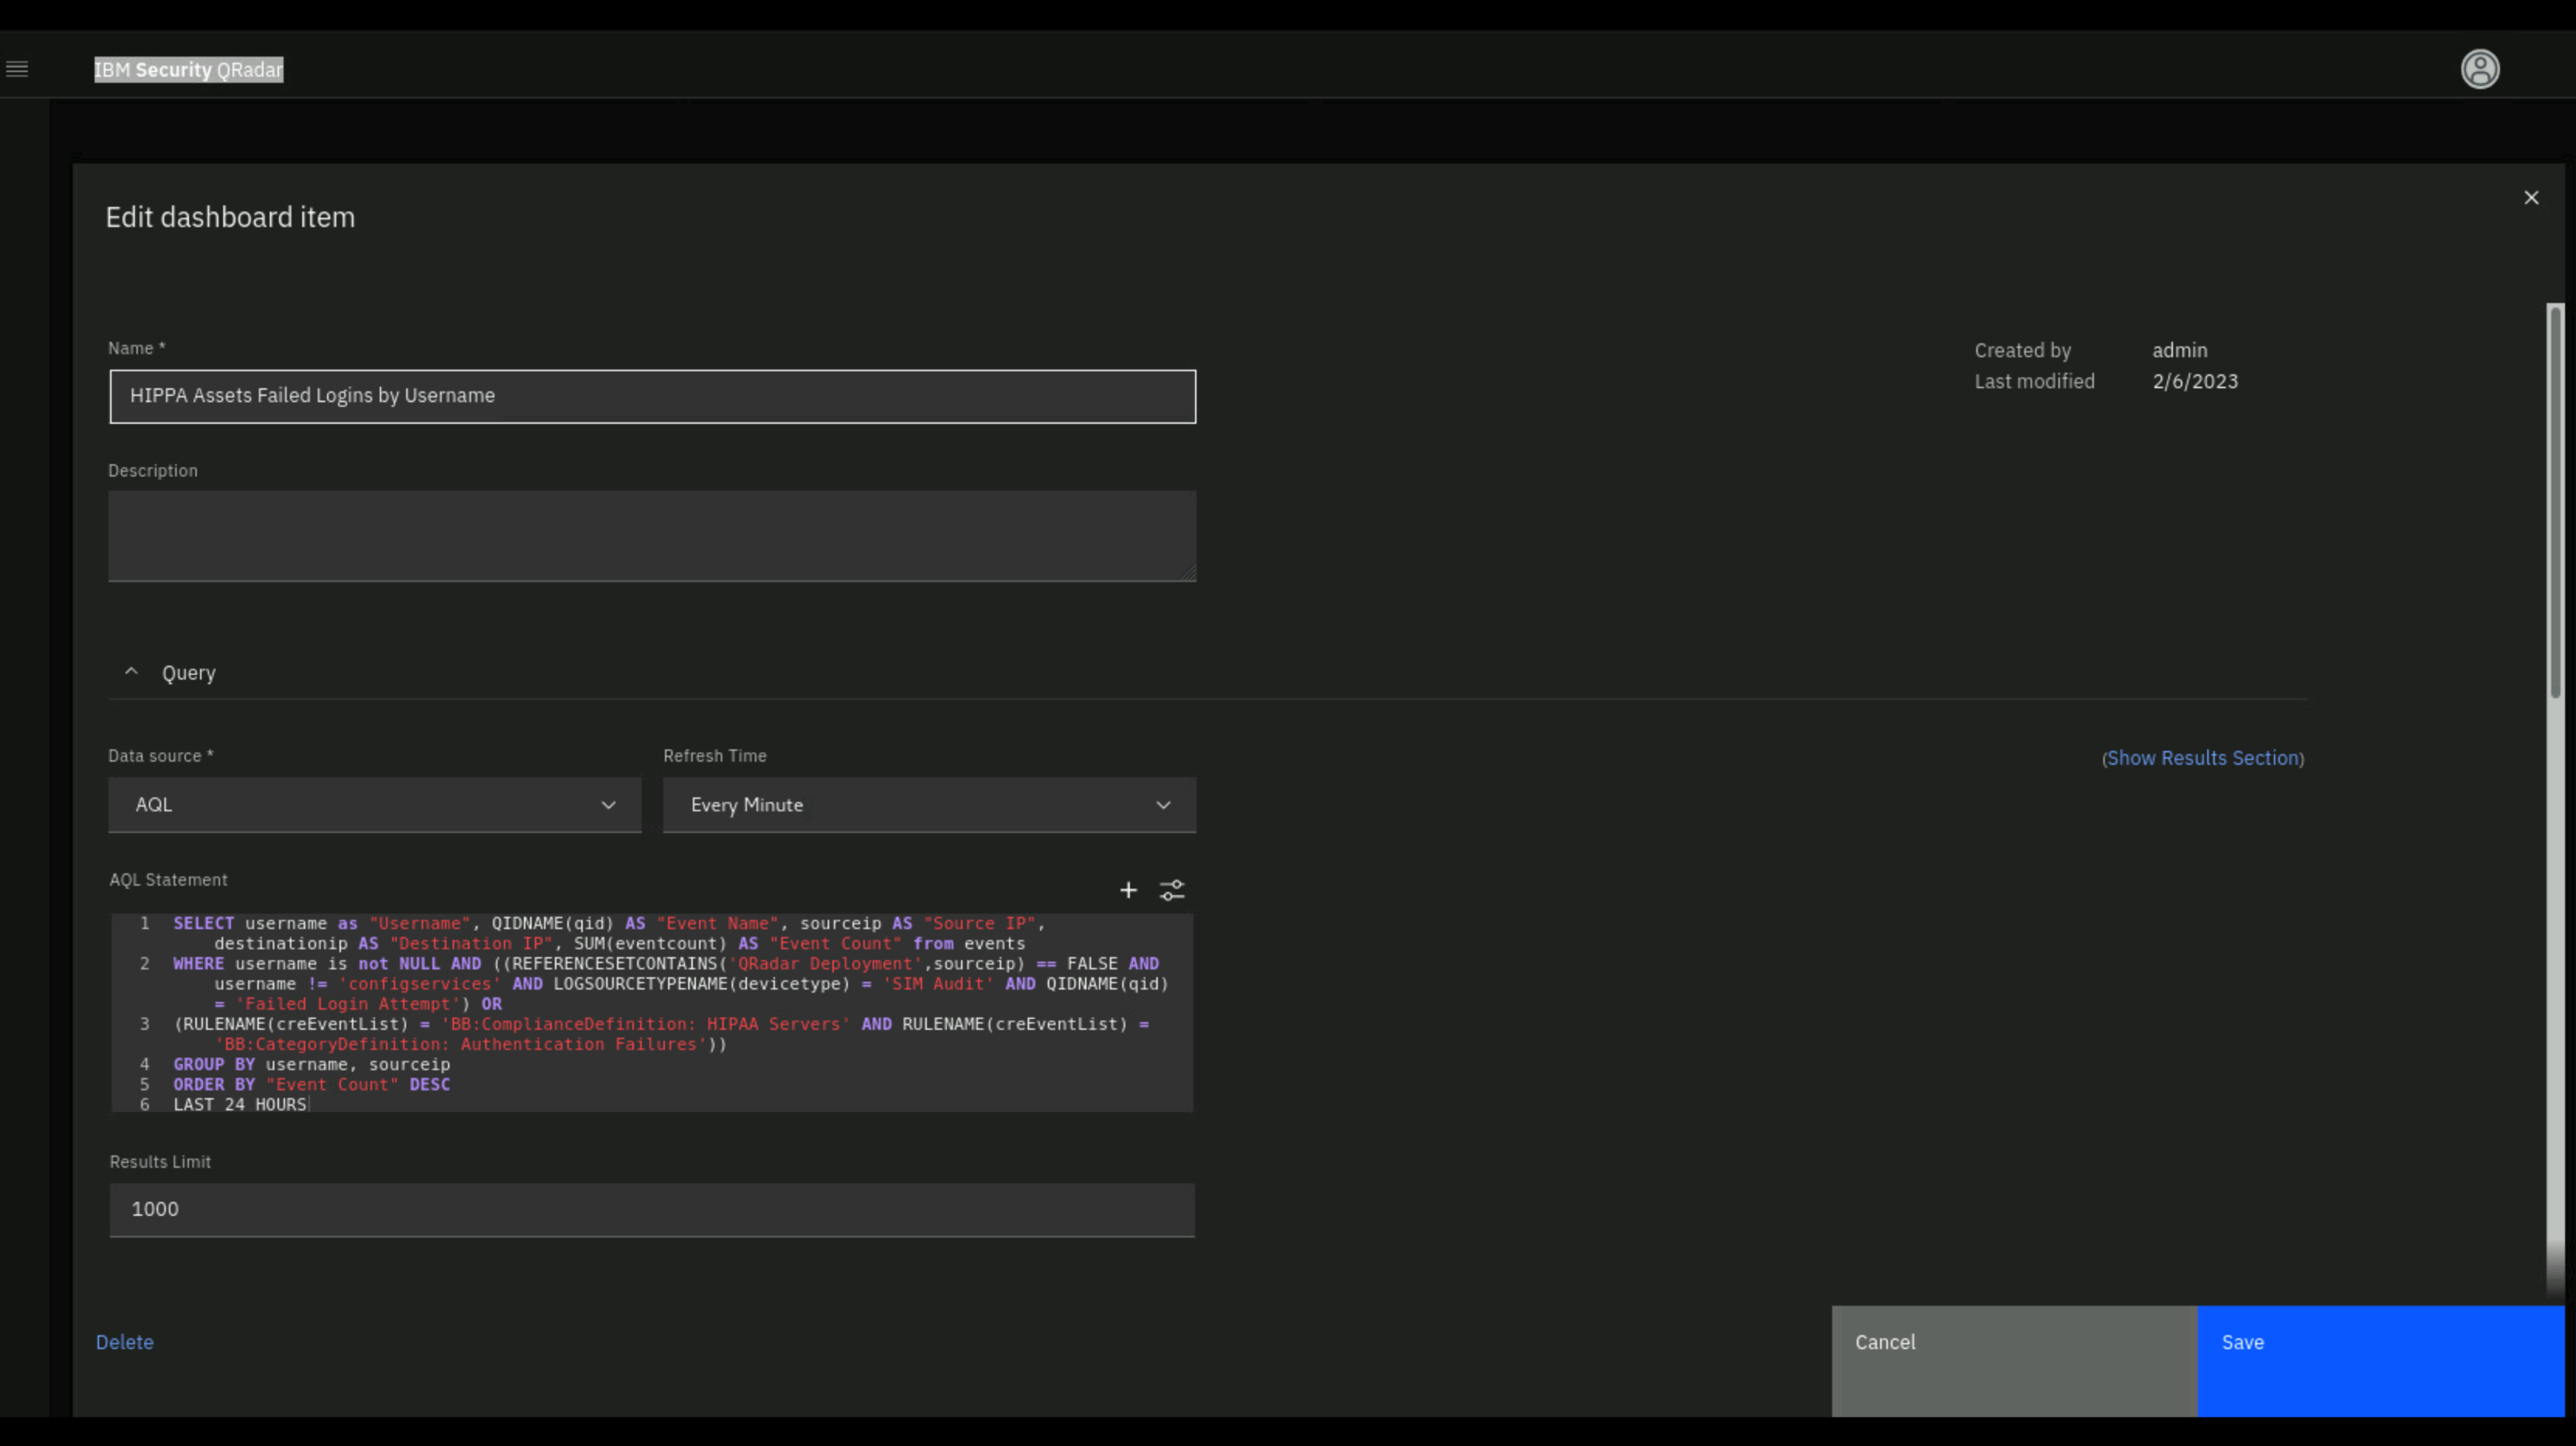
To build graphs you need knowledge of the Ariel Query Language (AQL).
AQL queries can look very complex, but, in general, they are SQL-like statements that you can create using the QRadar Query Builder wizard. The same AQL language can search QRadar events and network traffic. If you modify the AQL statement, you can run the query to get an updated preview.
-
Click Run Query.
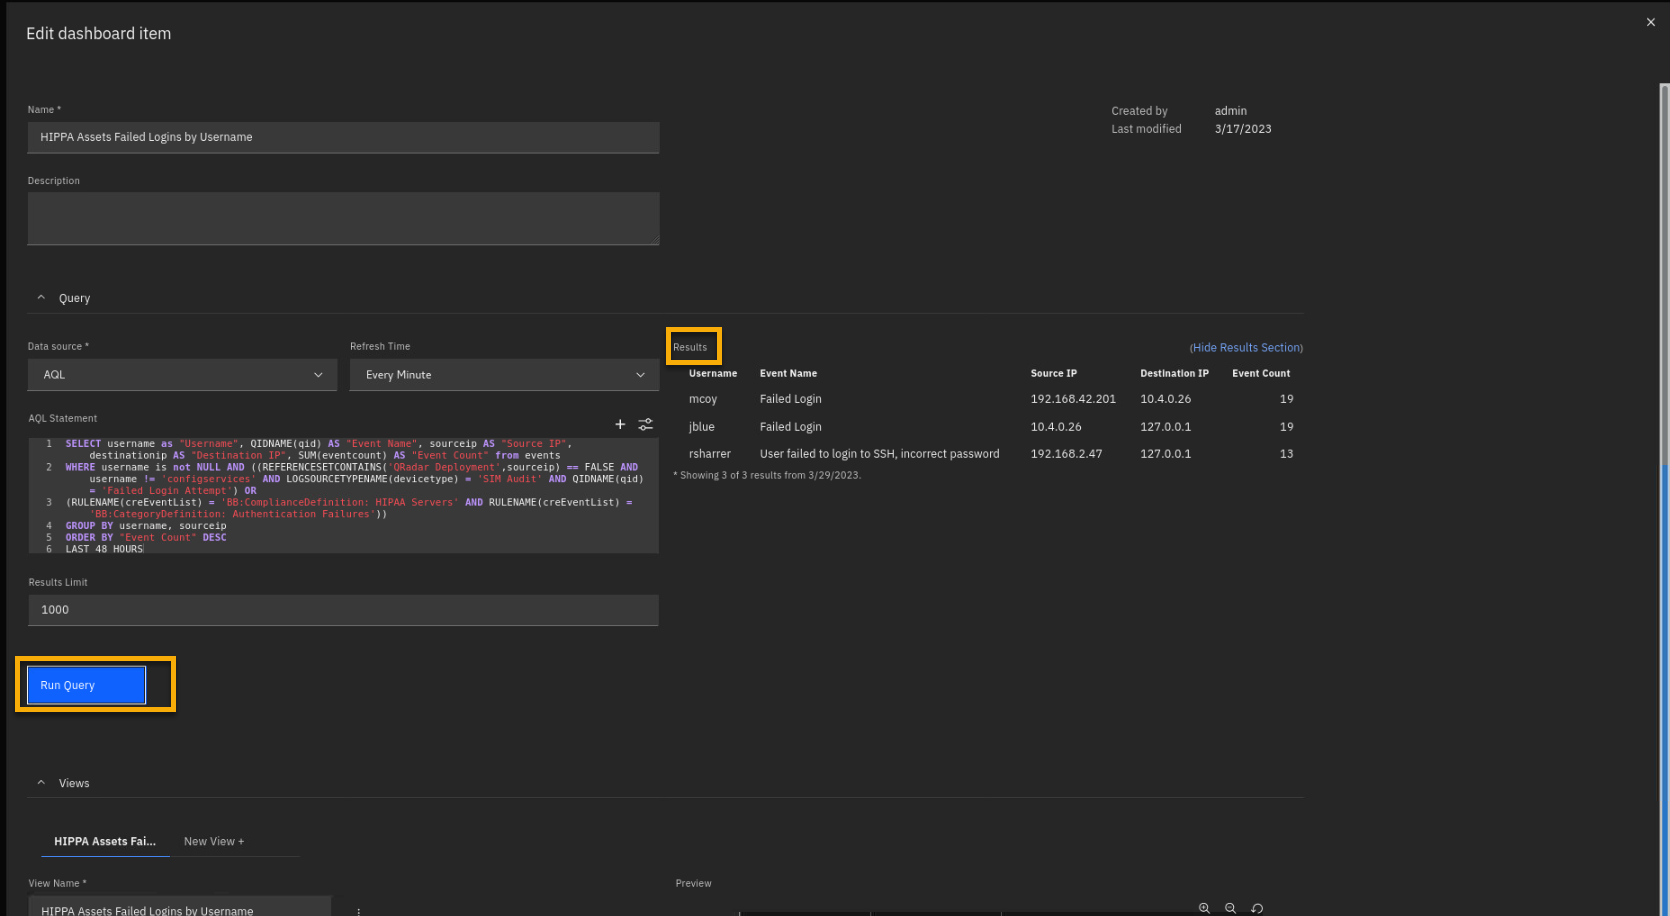
-
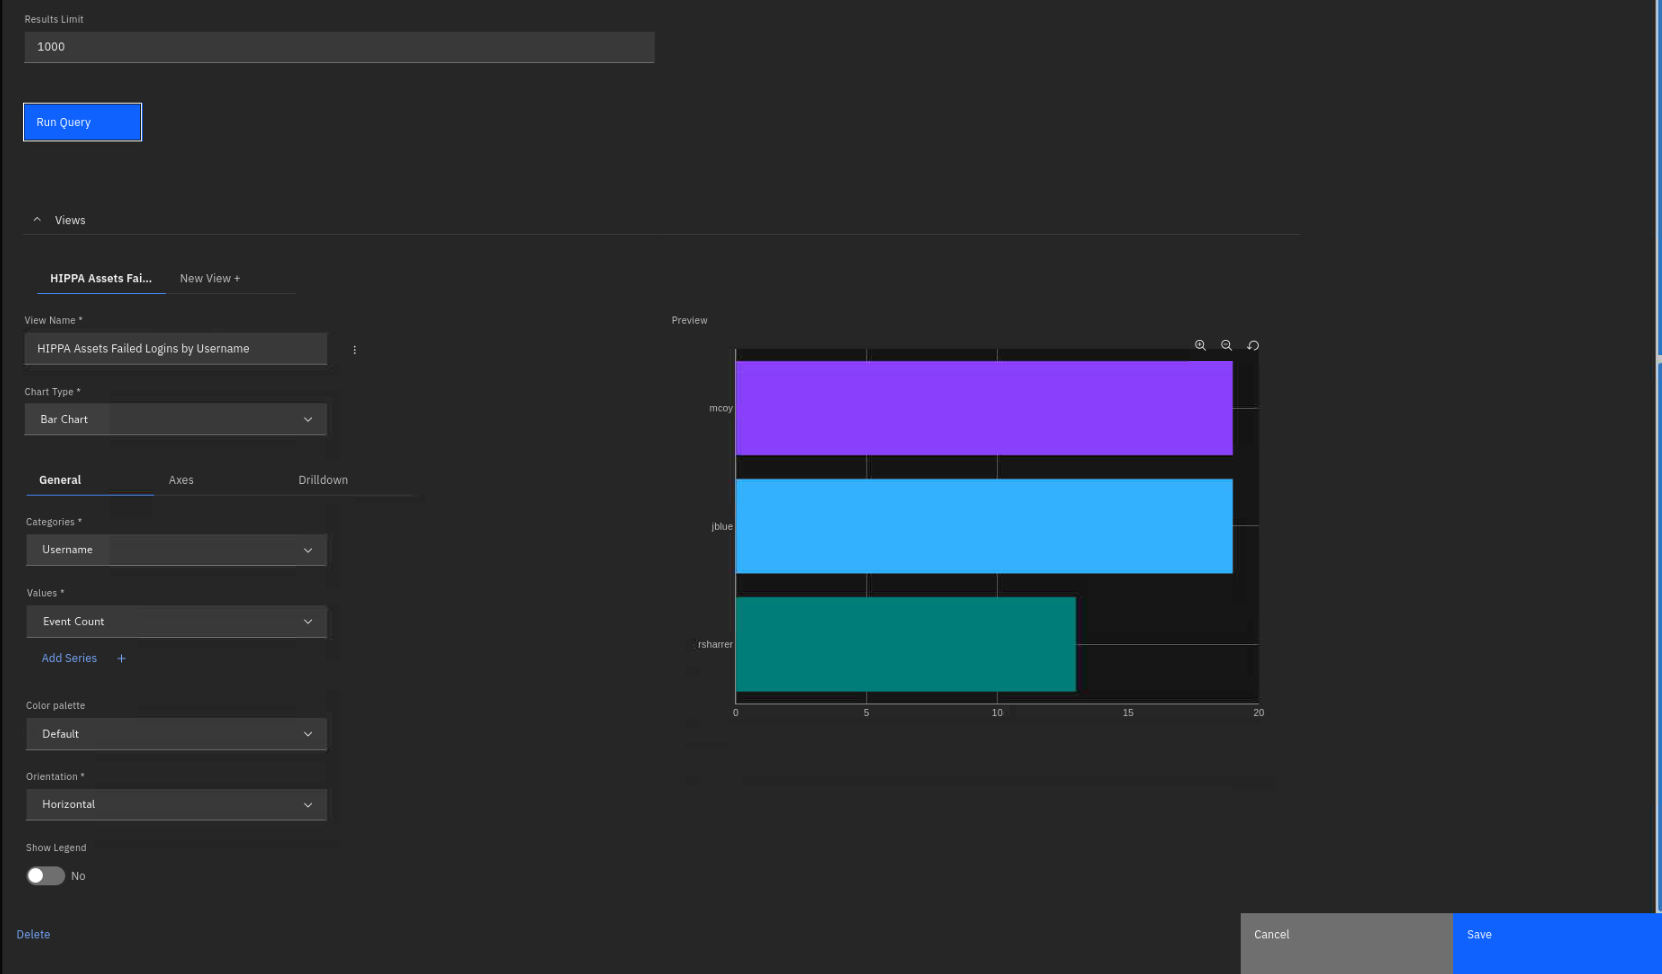
Scroll down and focus on the Views section.
-
As an experiment, make these changes to the graph view:
-
Chart Type: Pie Chart
-
Label: Username
-
Value: Event Count
You also can present data graphically in other chart types. Examples are
bar chart, time series chart, pie chart, and more.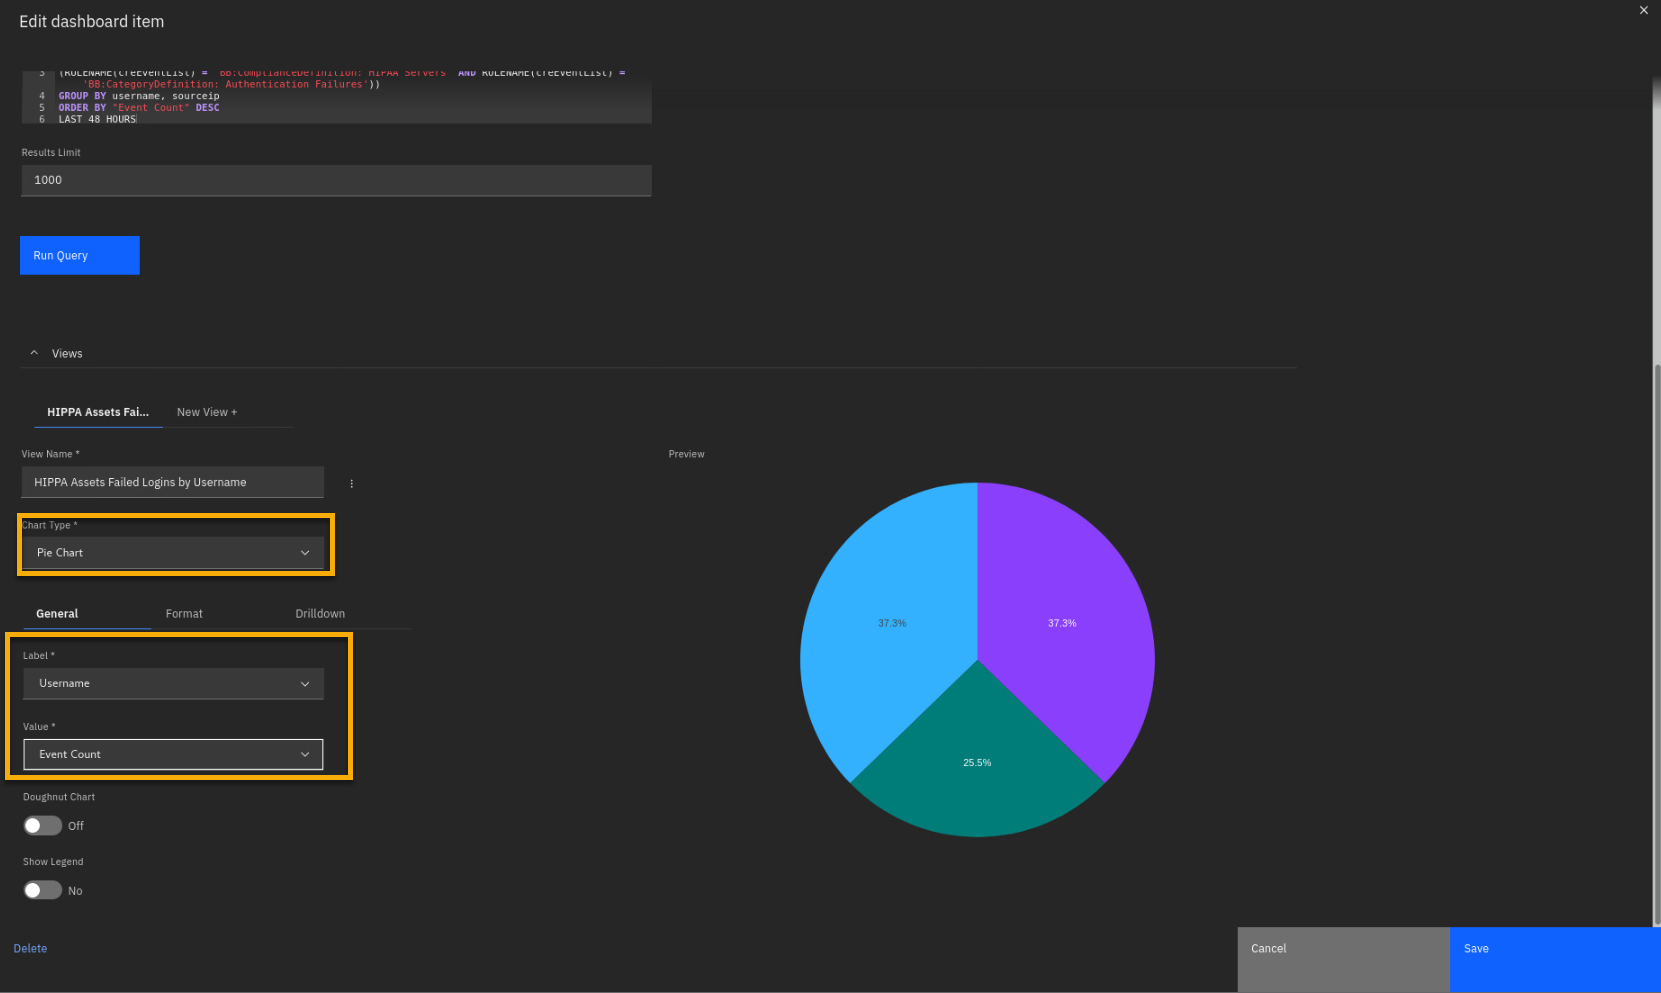
Note: you will not need to save these changes.
-
-
To close the Edit dashboard item page, click Cancel.
You can have an overview of all your compliance related data and mandates within one consolidated Dashboard, as we have just seen here with the Compliance Overview dashboard, or you can use a focused view of just one of the regulations that your organization must comply with, such as GDPR, in preparation for an upcoming audit.
-
Select the Dashboard menu > GDPR Overview Dashboard.
-
Spend time reviewing the focused visualizations for only the
GDPR-relevant critical assets.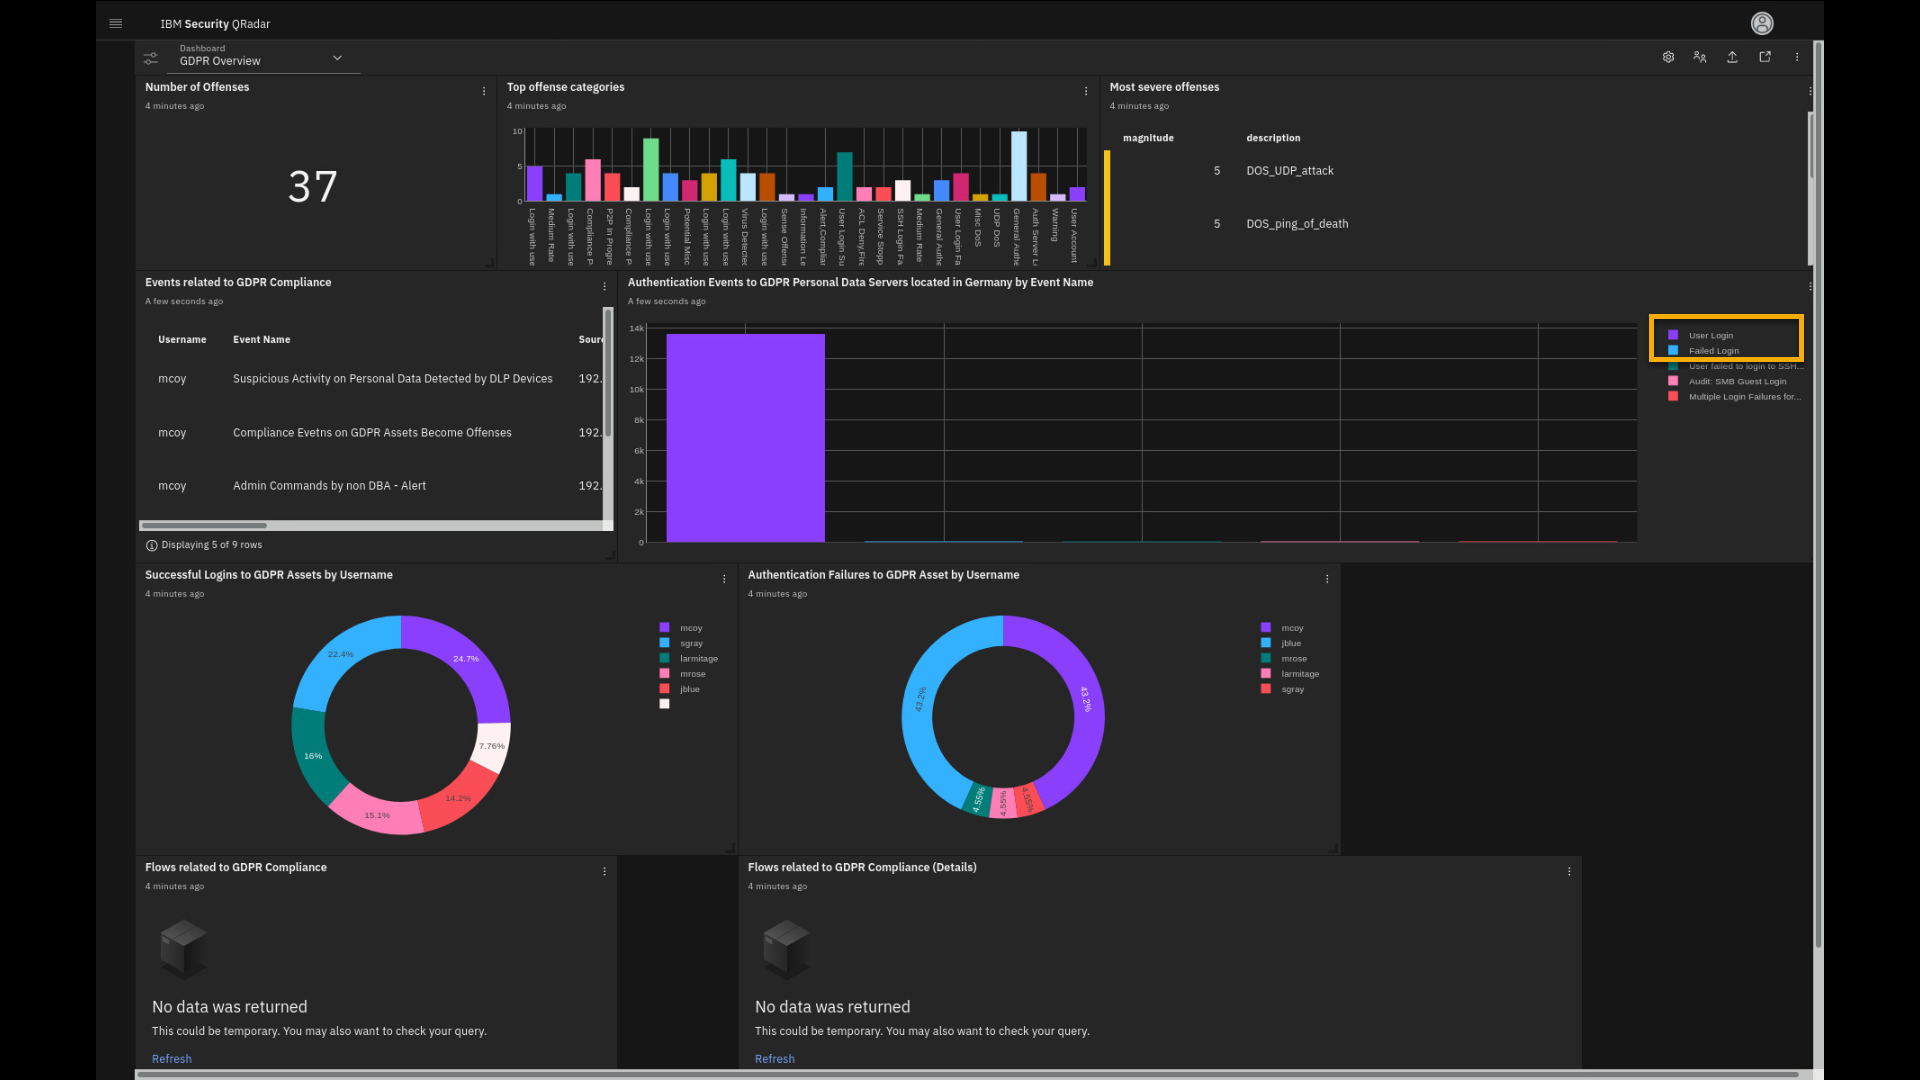
On the GDPR-focused dashboard, we see authentication events on the GDPR assets located in the Germany. The successful user login events are large in number, but there are also several failed logins, which might be an indicator of a malicious actor trying to access critical servers and data.
-
In the Authentication Events to GDPR Personal Data Servers located
in Germany by Event name graph, deselect User Login and
Failed Login events. Hover your mouse over each of the bars
in the chart. You see a more granular reason for the failed login
events along with the accumulated number of failed attempts.
Notice that there are a few other types of authentication events recorded on
those servers.The other two charts show successful and failed logins on GDPR assets
distributed by user. The AQL query can be created to pull the
report on the specific assets, like ones in Germany, or be more
generic to any asset with personally identifiable information (PII).In this first part of the demo, we showed how to utilize the power of
the vast QRadar SIEM information by visualizing the data in a variety of
dashboards using QRadar AQL. Now, let's focus on the investigation of
incidents detected by the QRadar custom rules engine.
Offense analysis
-
Click Main menu > Offenses.
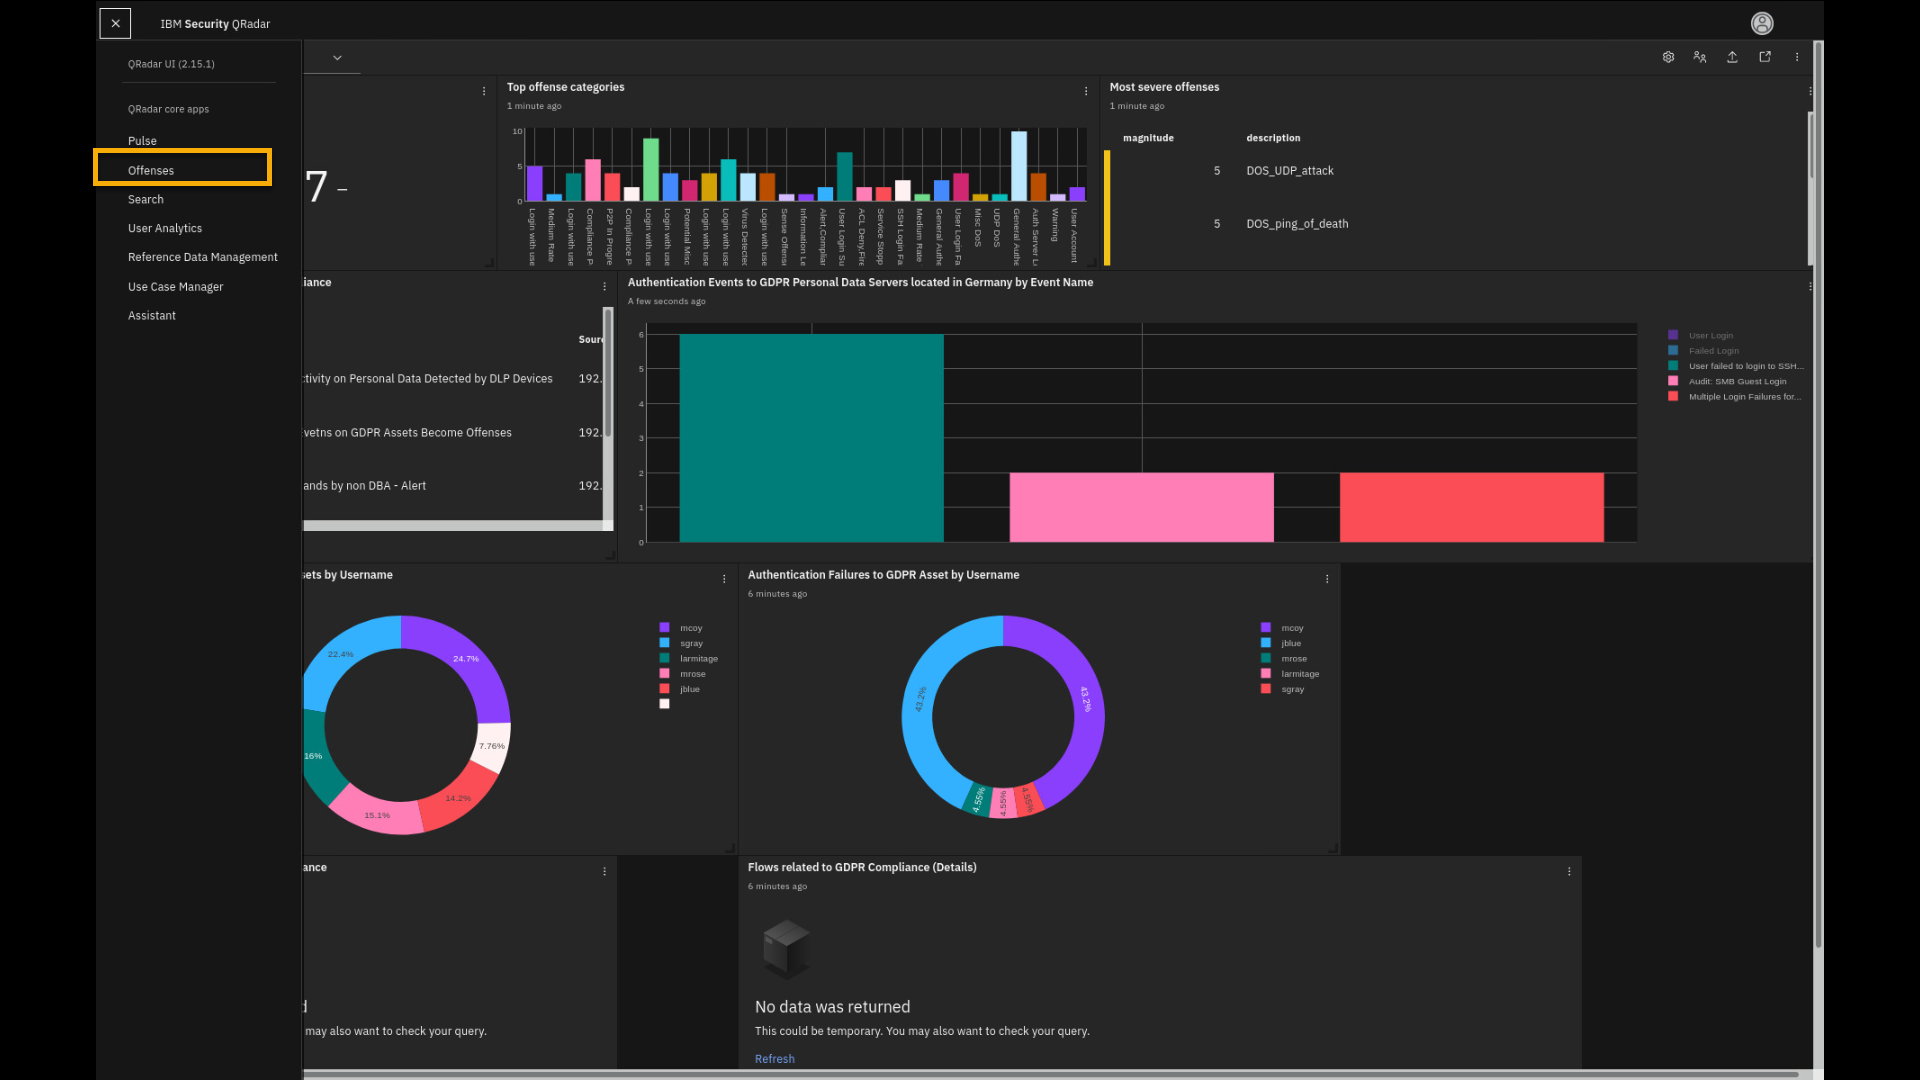
QRadar can receive millions of events combined with network traffic information during a day. So, how can a security analyst deal with such a massive amount of data, process it, and effectively find potential threats? Although a senior analyst should conduct proactive threat hunting by searching SIEM data in performing daily security analyst work, QRadar comes with a custom rules engine that can automatically detect potential threats in your environment. By default, the custom rules engine comes with hundreds of different rules, also known as use cases or insights, looking for certain threat activities. You can expand the number of rules by installing content packs from the IBM Security App Exchange or writing your own rules for a specific use case.
If rules find a matching pattern in your events and network traffic, they can trigger an offense. The offense is a potential security incident that analysts should investigate and make a decision whether it is benign or malicious for the IT environment.
Let's investigate some of the offenses triggered from the event data on this QRadar SIEM instance.
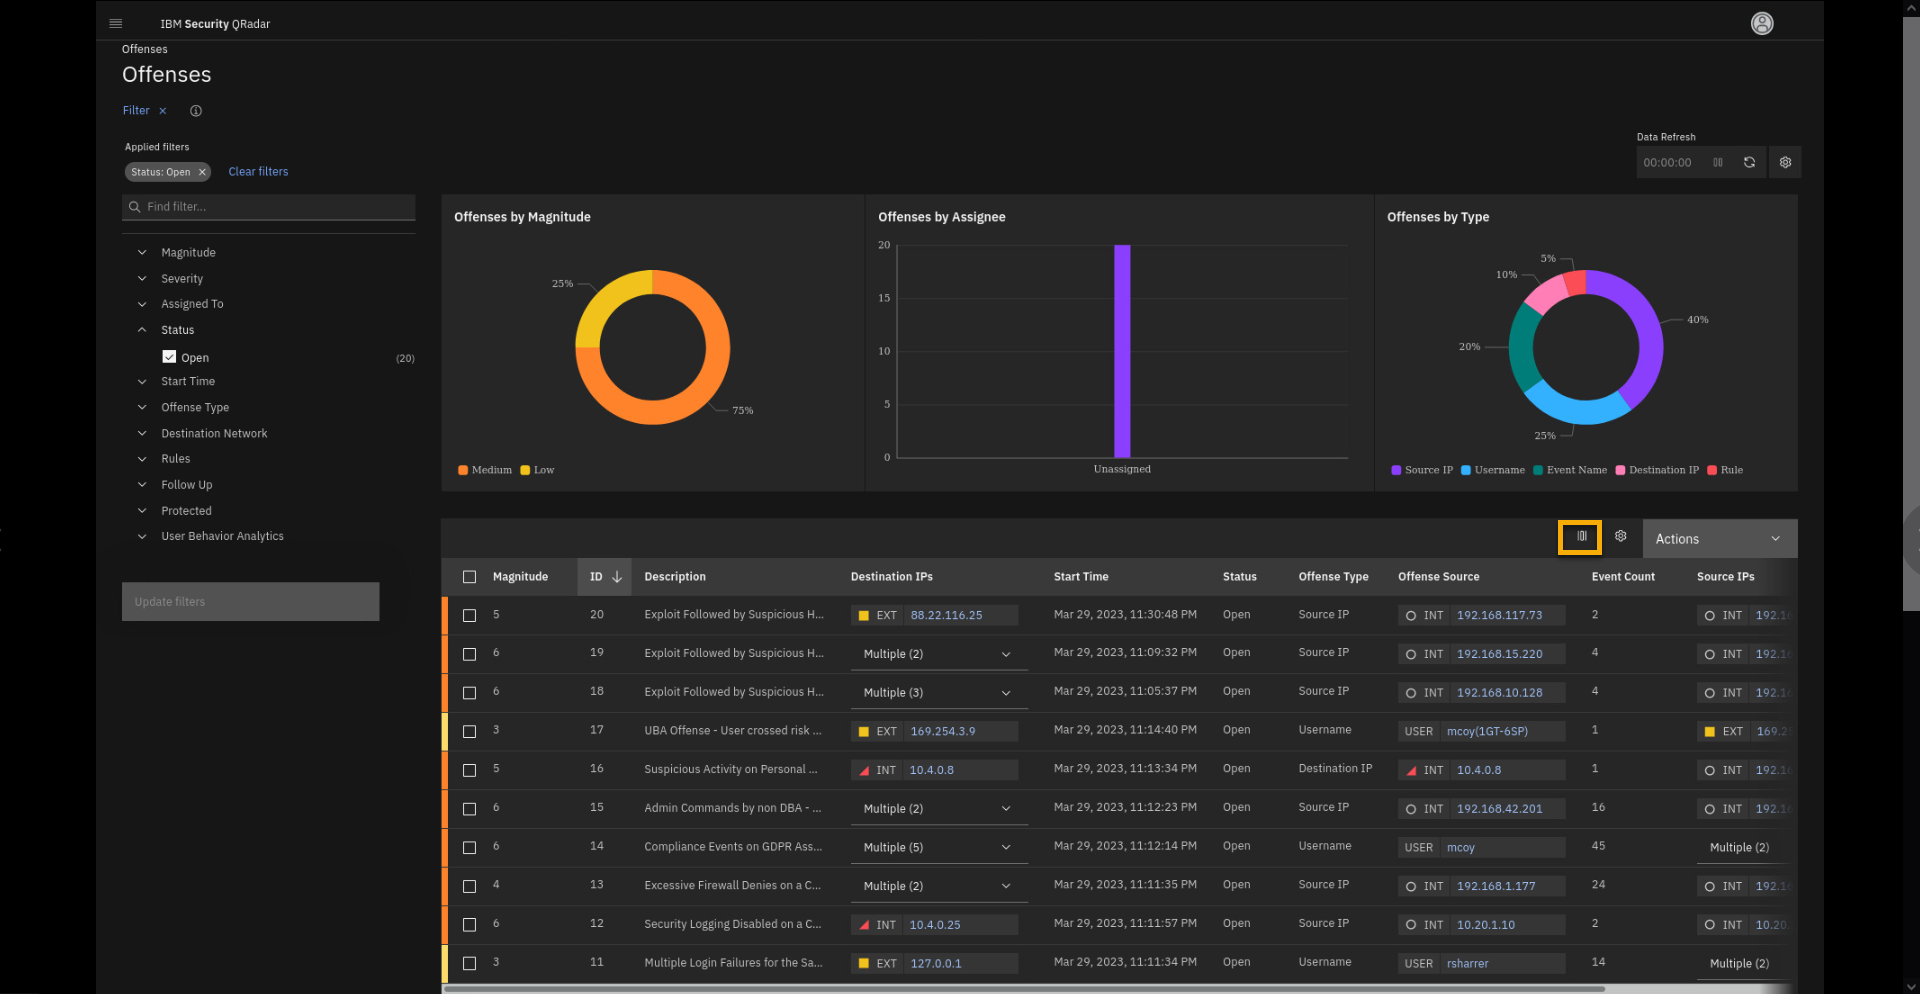
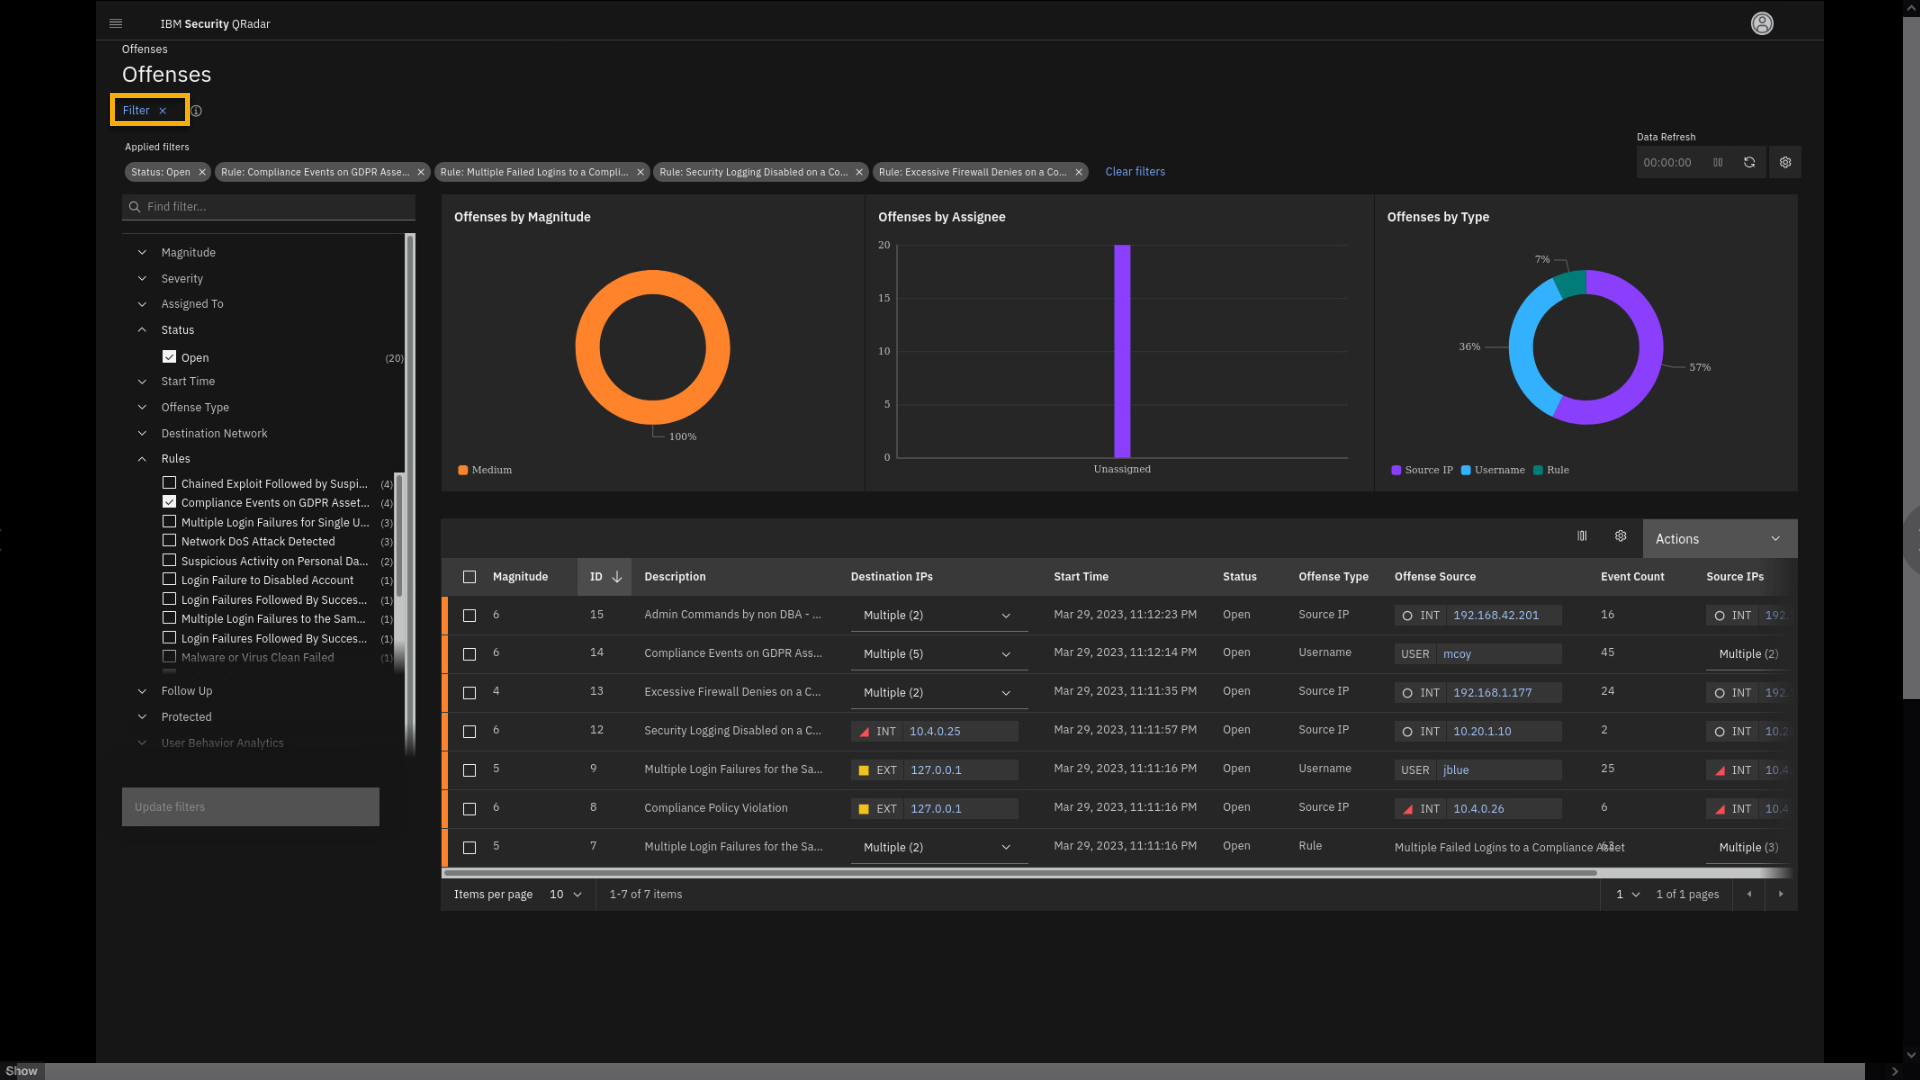
By default, the offense view displays some statistics at the top and lists the open (active) offenses in the table. You can customize this table view or adjust the items per page view.
-
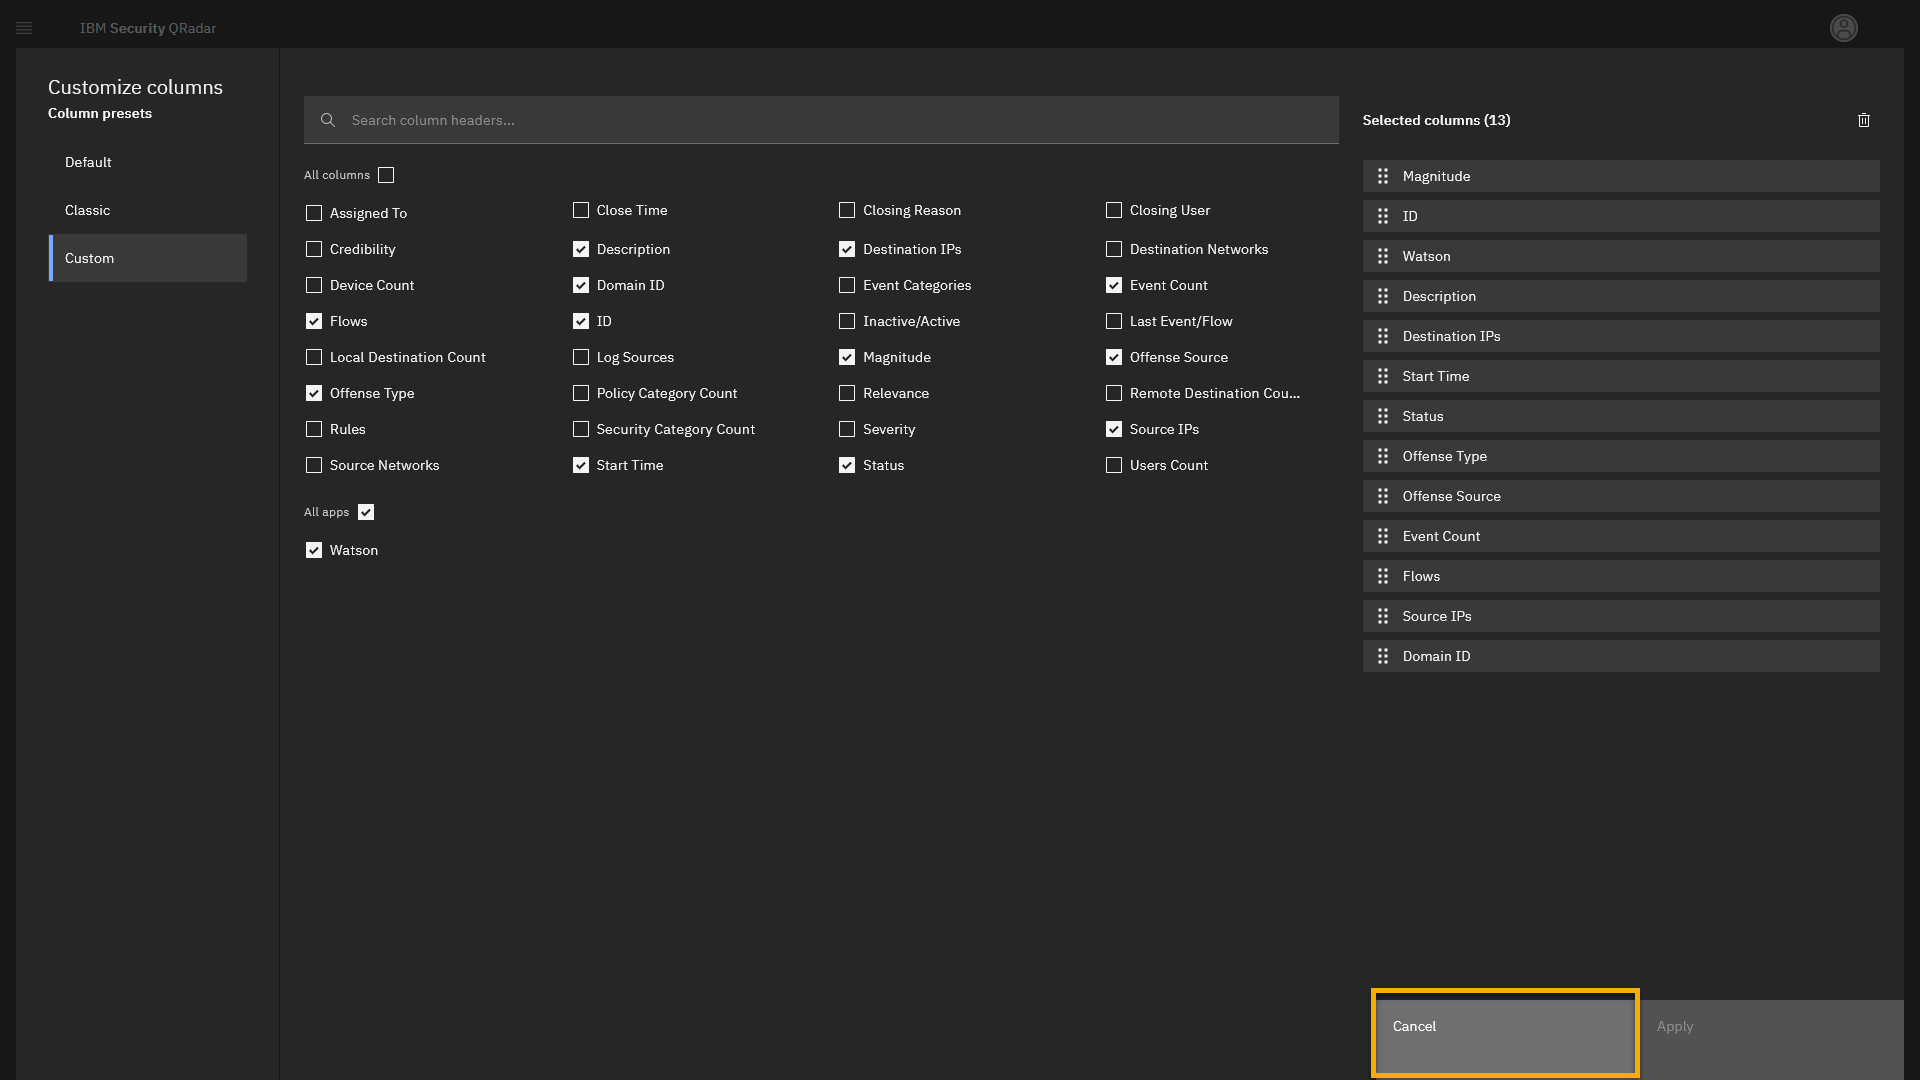
Click the customize column icon.
-
On the customize columns screen, take a moment to study and highlight for discussion key attributes
In the customize columns screen, you can see all attributes related to the offense and select which one you want to see in the default table view. For example, it can show which log sources contribute to the offenses. Leave the view as it is.
-
To go back to the offenses page, click Cancel.
-
Back on the offenses list, expand some attributes used for
filtering: Magnitude and Severity.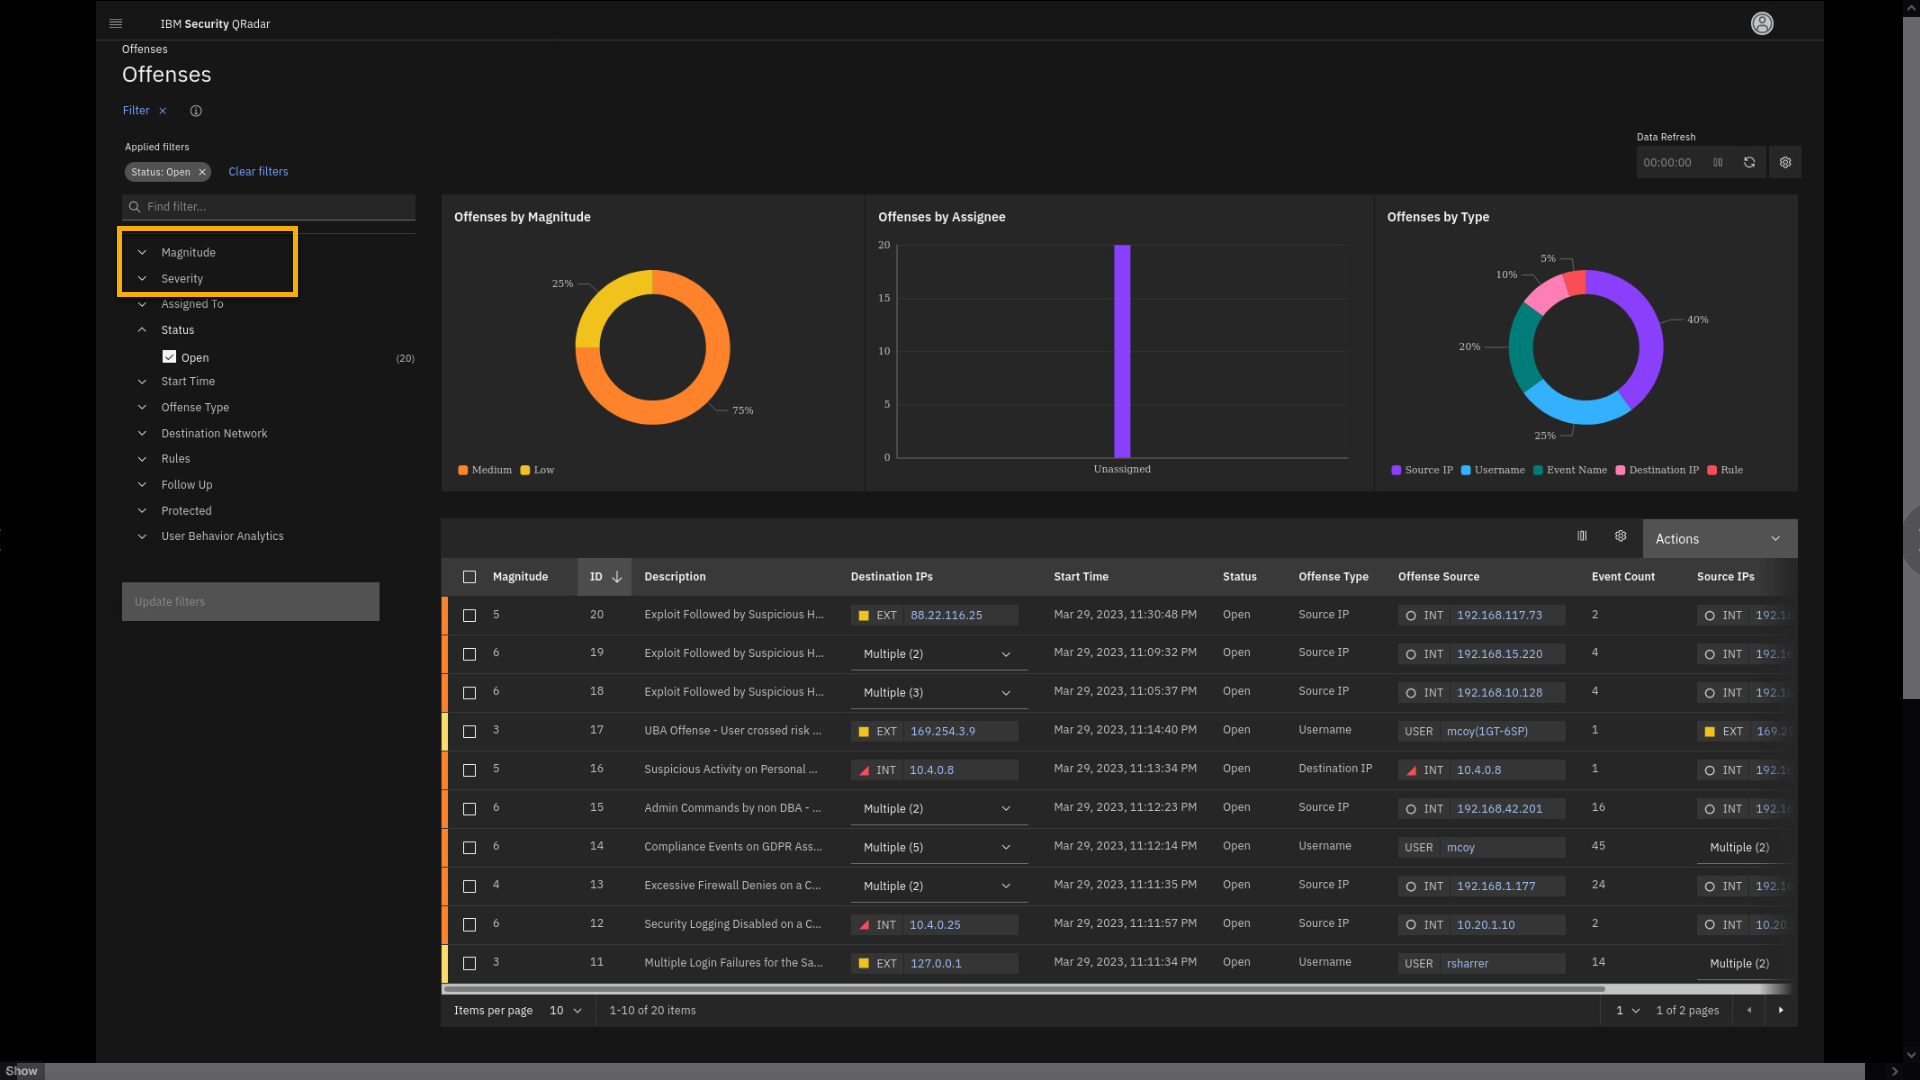
The offense table lists the offenses and some attributes, such as
magnitude, description, offense type, IP addresses involved, and more.Note the left pane contains a lot of filters that can help with
reviewing and analysing the offenses.For example, by using the Magnitude or Severity filters, you can show
only offenses that are rated low, medium, or high for those two filter
categories.In this demonstration, we want to look for specific offenses that are
compliance related. -
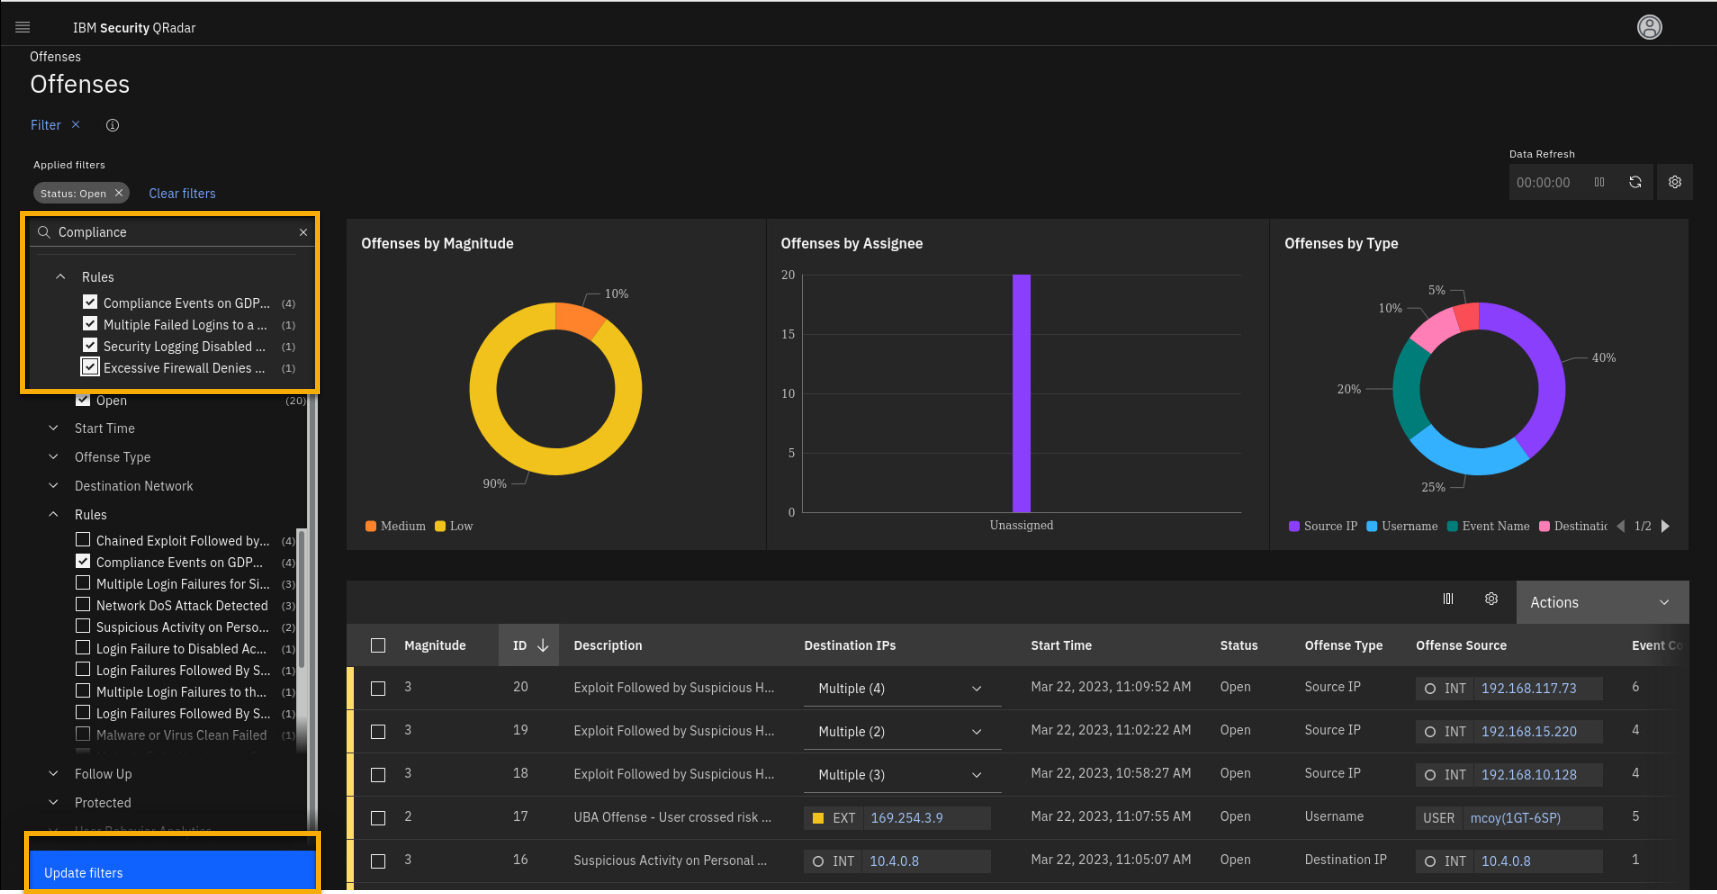
In the filter section, click the Search field and type
Compliance. -
Select all four compliance related rules.
-
Click Update filters.
-
Close the filter pane.
-
Review the compliance related offense.
Let's now review some of the offenses, acting like a security analyst.
Note that offense description or name can be quite long and if you move
the mouse pointer over it, you get the full name.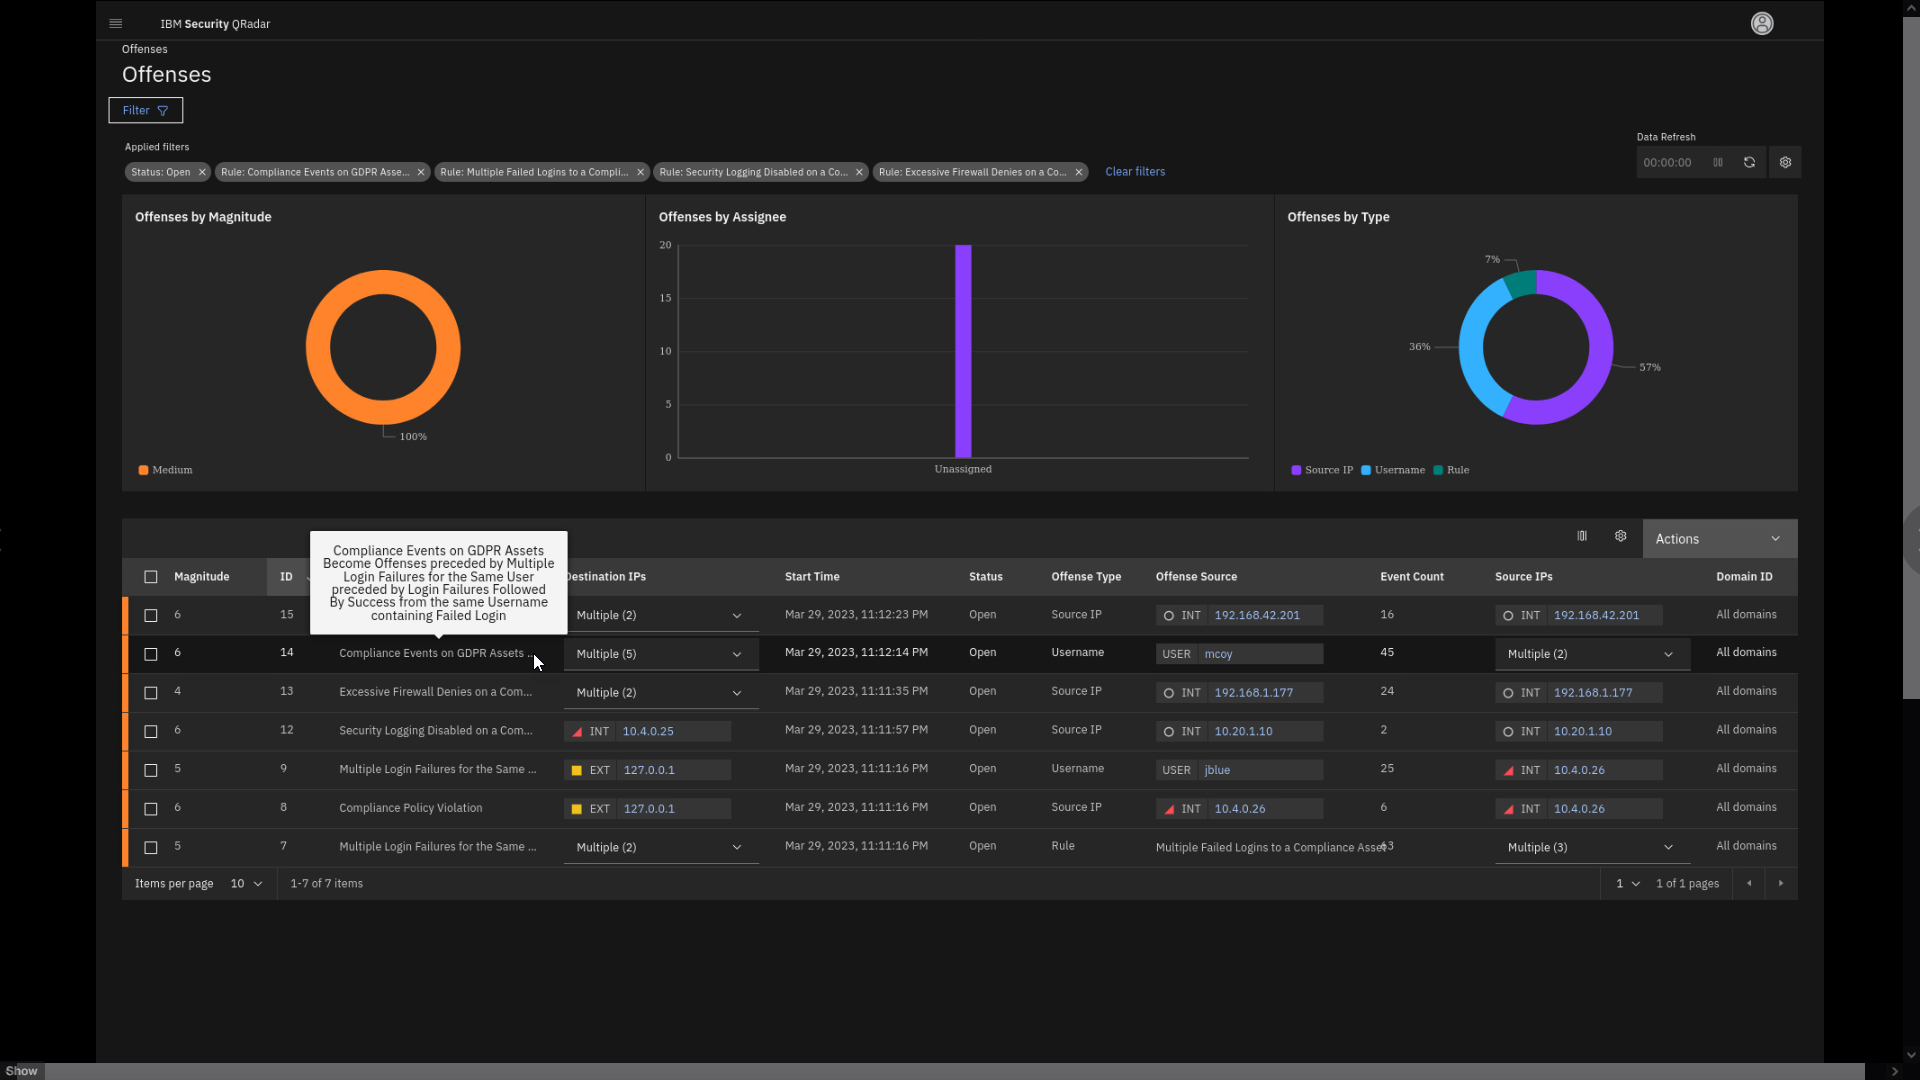
Depending on your timing and demo flow, you might show one or more offenses from this chapter. However, it is important that you go over the GDPR offense indexed by mcoy user, because the later demo topics build on that story.
If you are pressed for time to complete this lab in the workshop, only go through the GDPR related offense. This is the third offense in the list below
Offense 1 - Excessive Firewall Denies on a Compliance Asset
The market-leading QRadar correlation engine can detect an unusually large spike in network traffic denied by network access control lists (ACLs) or firewall rules. Such a burst of denied traffic is usually caused by either: 1) a mis-configured application or firewall or 2) suspicious or malicious activity. This suspicious or malicious activity may be connected to unsuccessful attempts to connect to a command-and-control (C2) server or data exfiltration, resulting in a burst of failed connections. This could also be due to unusually large amounts of reconnaissance or enumeration traffic. Denial-of-service attacks or traffic floods can also produce such a surge in traffic.
-
Click the Excessive Firewall Denies on a Compliance Asset
offense. -
Click the ellipsis (...) in the title to expand the full name of
the offense.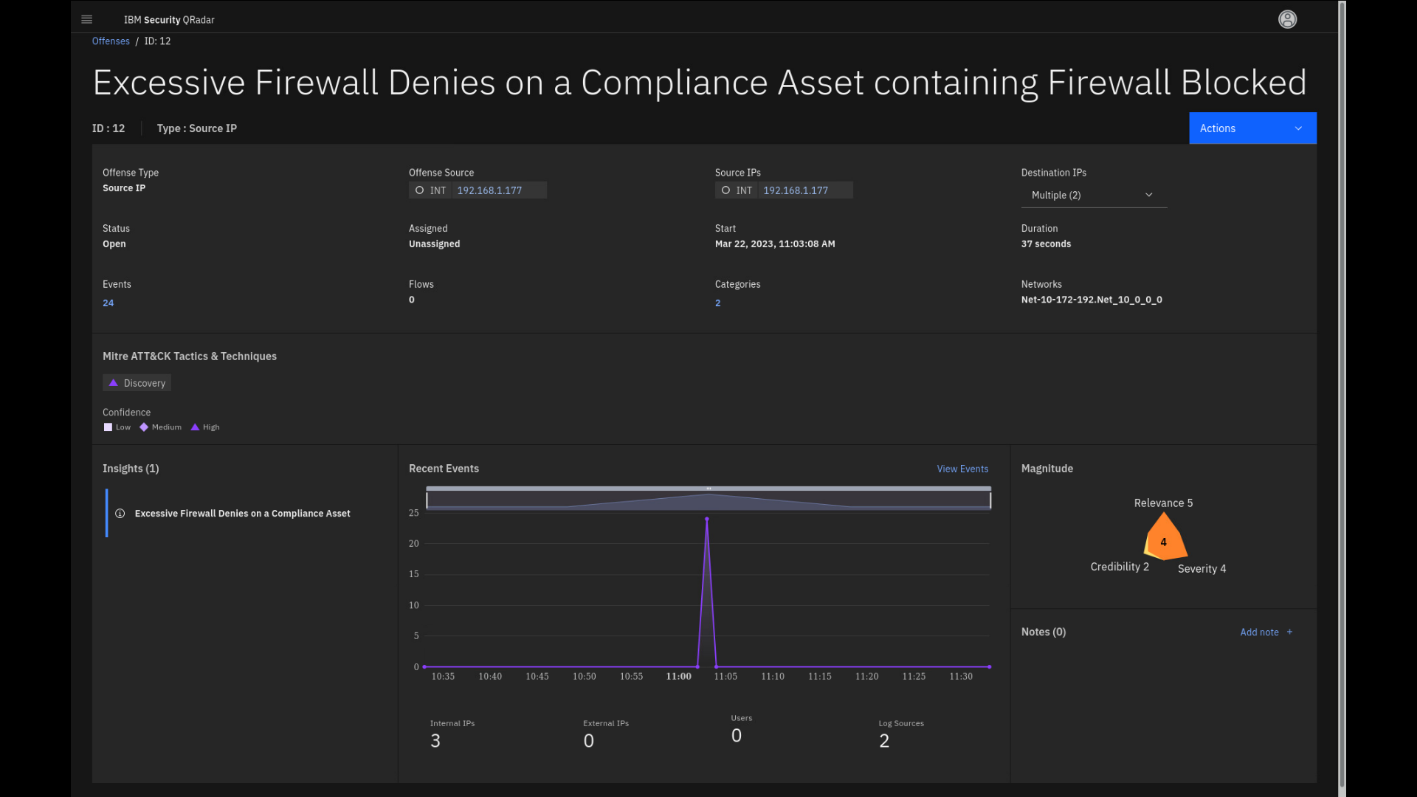
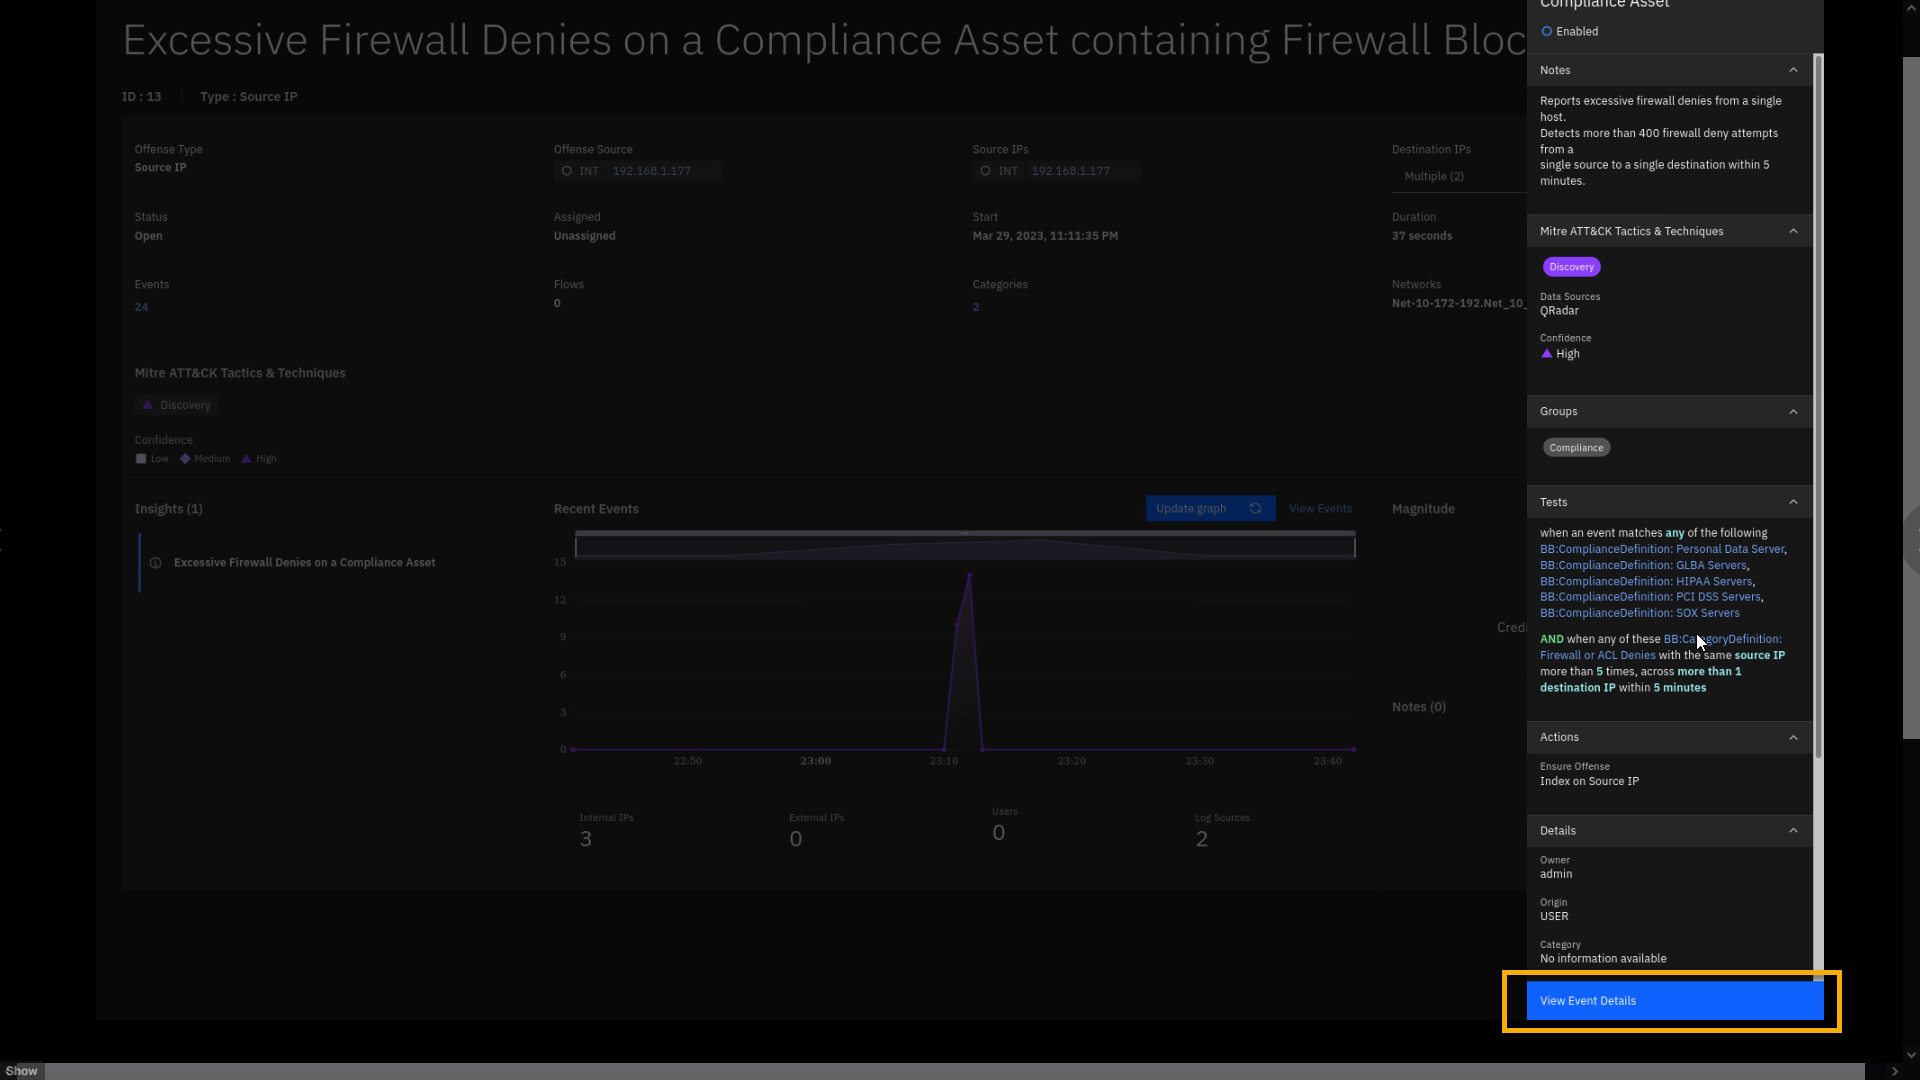
This is the offense overview page, where the security analyst starts reviewing the offense details.
By classifying your compliance-relevant servers with policy-mandated or policy-protected data on them, you can ensure that specific QRadar rules related to unsuccessful attempts at network traffic alert you when malicious activity is detected on those assets. This enables your analysts to stay proactively ahead of the attacker's path.
This offense is indexed on the Source IP and has multiple Destination IPs. The magnitude of the offense is 4, which helps you to prioritize the offense review. The offense summarizes 24 events, which trigger one insight Excessive Firewall Denies on a Compliance Asset.
Note: Be aware that some of these numbers can be different in your
demo.Let's have a look at the Insights, also known as Test Conditions, that
were successfully met from the collected events. -
Select the Excessive Firewall Denies on a Compliance Asset
Insights to reveal a side pane that shows the test conditions of the
rule.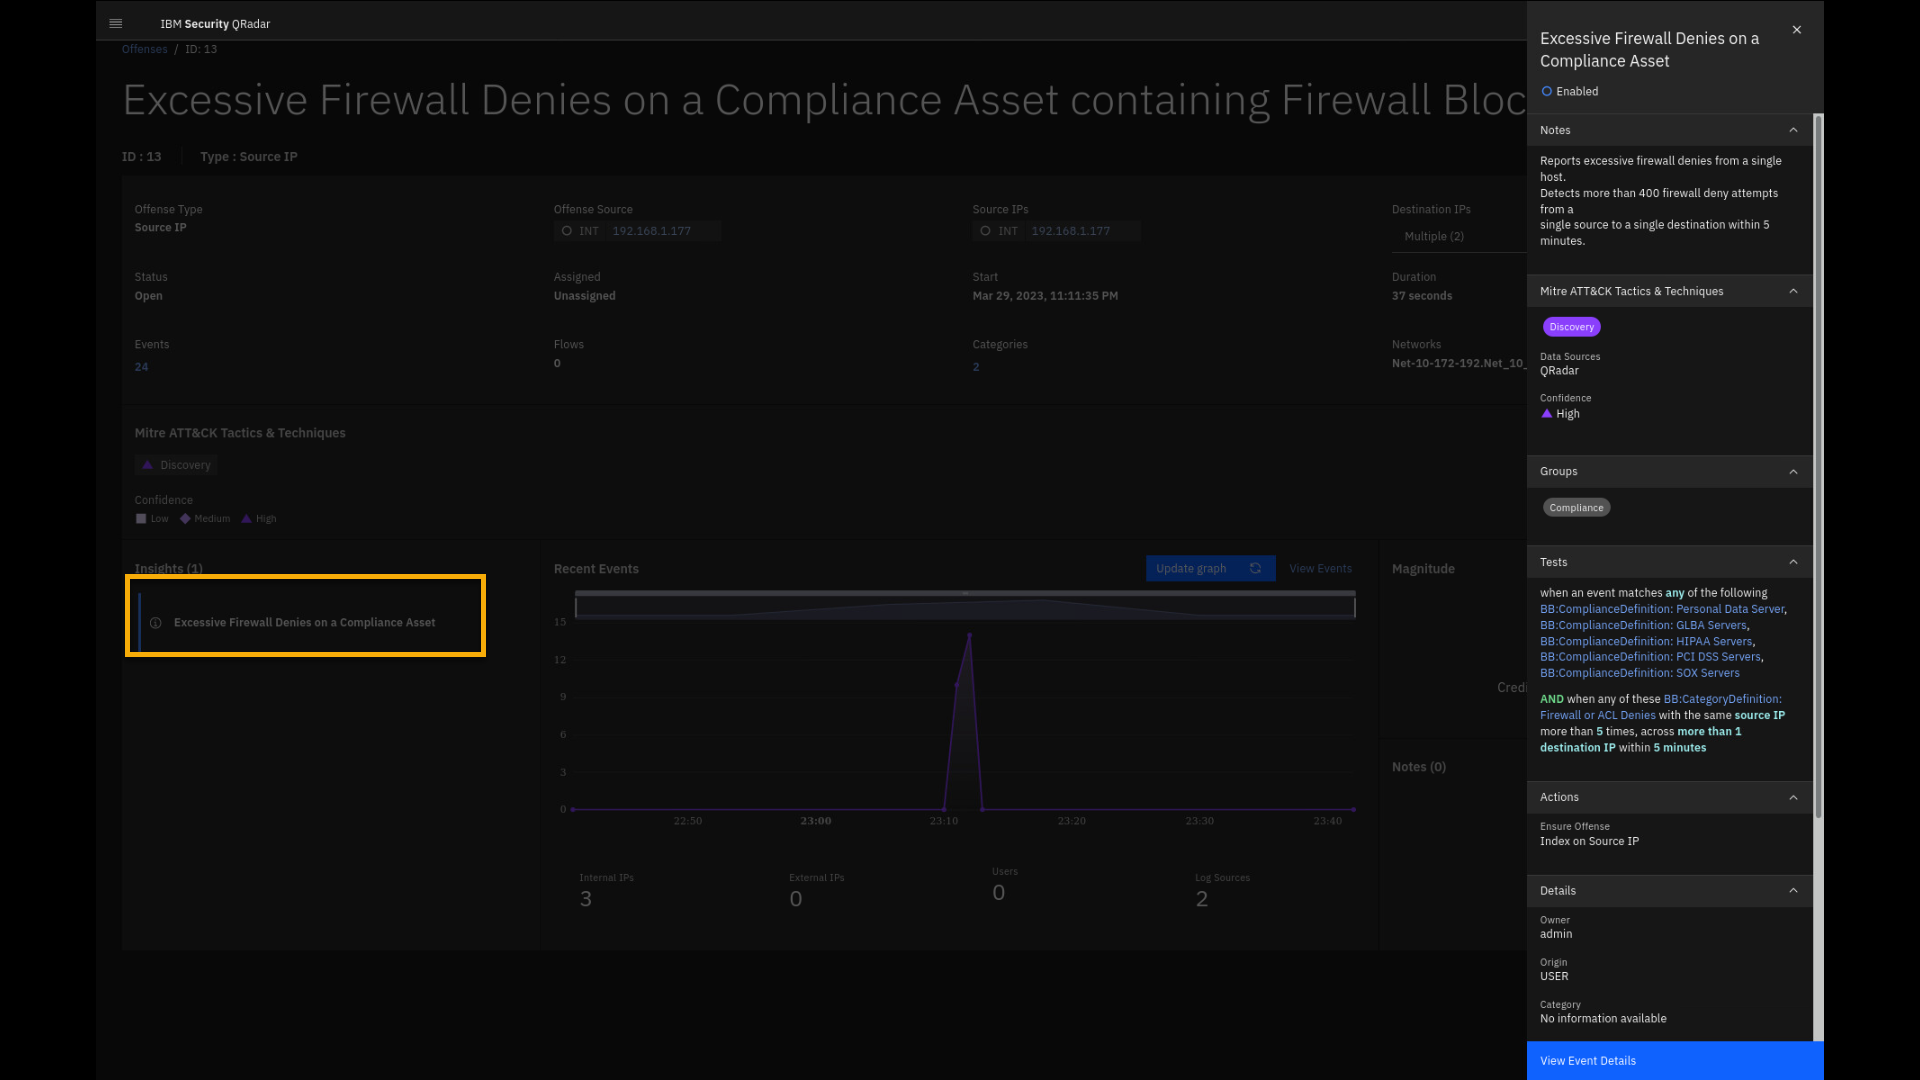
Reviewing the insights helps a Security Analyst to analyze the problem
without reviewing all individual events. The insights Notes already
explains why the offense was triggered. The Tests section provides
details on how this offense is generated. It is designed to alert you if
multiple conditions are met:-
The IP address must represent a critical asset as defined by the
listed building blocks, such as Personal Data, GLBA, HIPAA, PCI DSS,
or SOX Servers. -
Another part of the rule, the test condition, says that event must
generate Firewall or ACL denies and it is not a single event. QRadar
tracks events and has counters that will alert if this is happening
at least to 2 destinations over 5 times within 5 minutes.
Be aware that we have lowered the thresholds for those rule tests from
the default values due to demo environment constraints. -
-
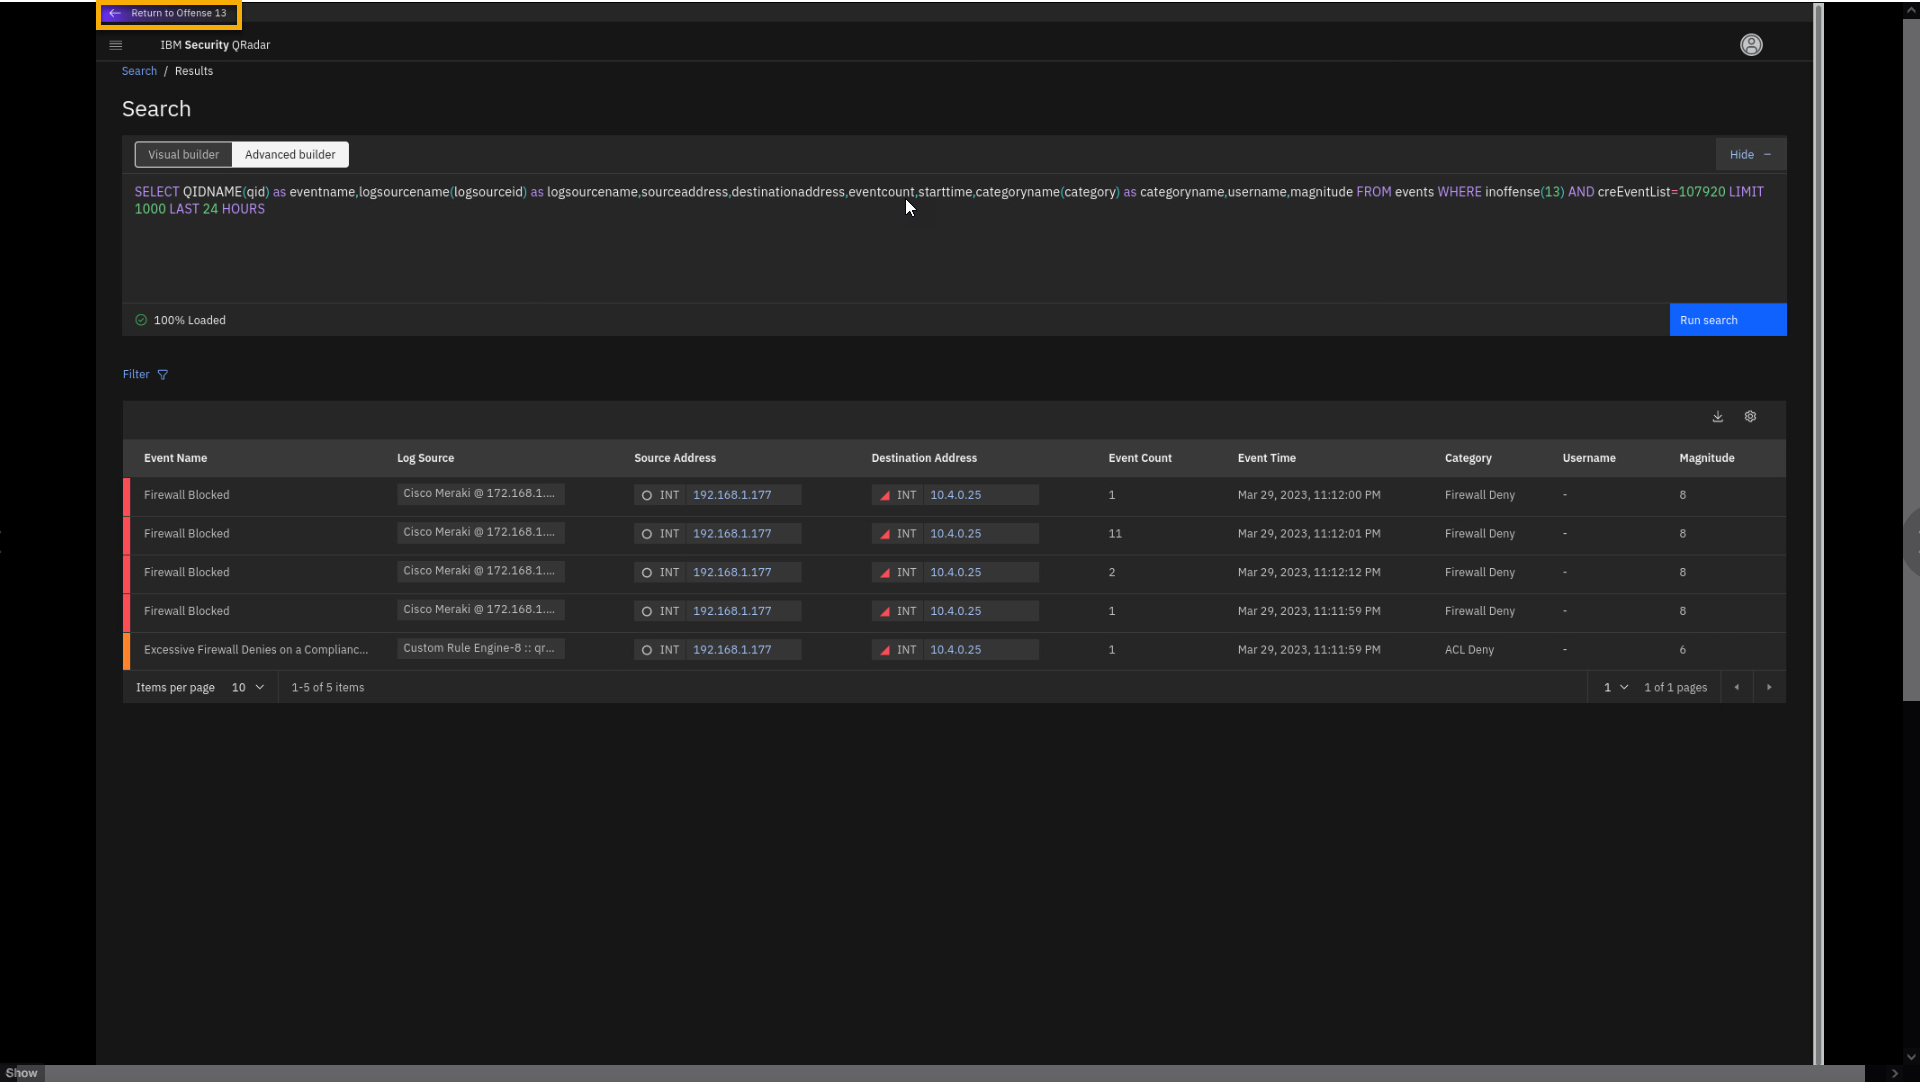
Click View Event Details.
-
Observe and be prepared to describe the AQL query at a high level in a demo.
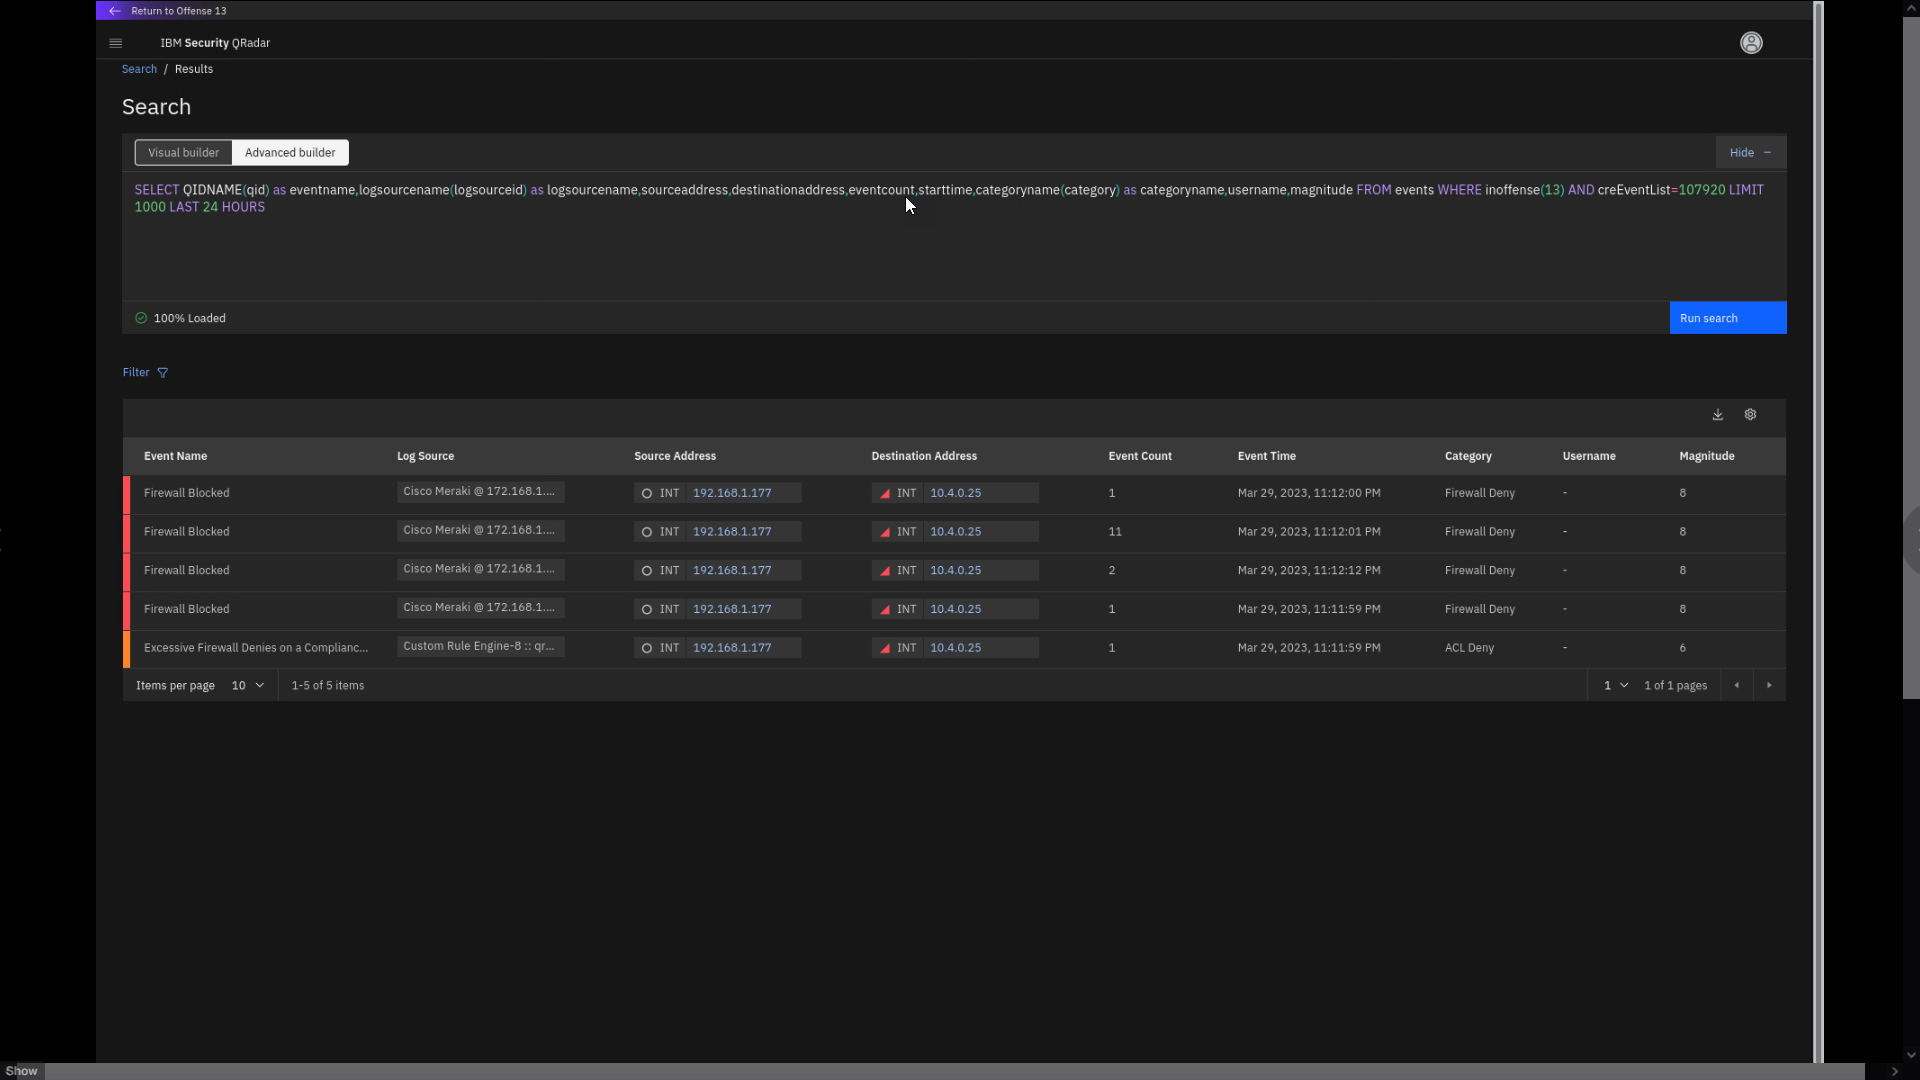
By understanding the insights, you do not need to review the details of
all the individual events involved in this suspicious activity. If you
decide to view the events related to these insights, the Search screen
opens. Without the need for deep AQL knowledge, the automatically-built
query shows the events associated with this offense and the particular
insights.Note the event count column. Some events are grouped using the
coalescing feature. Event Coalescing helps improve performance and
reduce storage for non-critical security events where the full event
payload does not need to be saved.Note also that the Internal IP 10.4.0.25 is marked red.
As data comes in and is coalesced, a large burst of events can
convert hundreds of thousands of events into only a few dozen records.
This action is done while QRadar maintains the count of the actual
events. Coalescing gives QRadar the ability to detect, enumerate, and
track an attack on a huge scale. It also protects the performance of the
pipeline by reducing the workload of the system, including storage
requirements for those events. When events are received that match a
specific criterium, QRadar can use coalescing to determine what to store
from the event payload based on the log source settings in QRadar. -
Click any of the Destination Address IP addresses and examine
the IP address slide-out pane.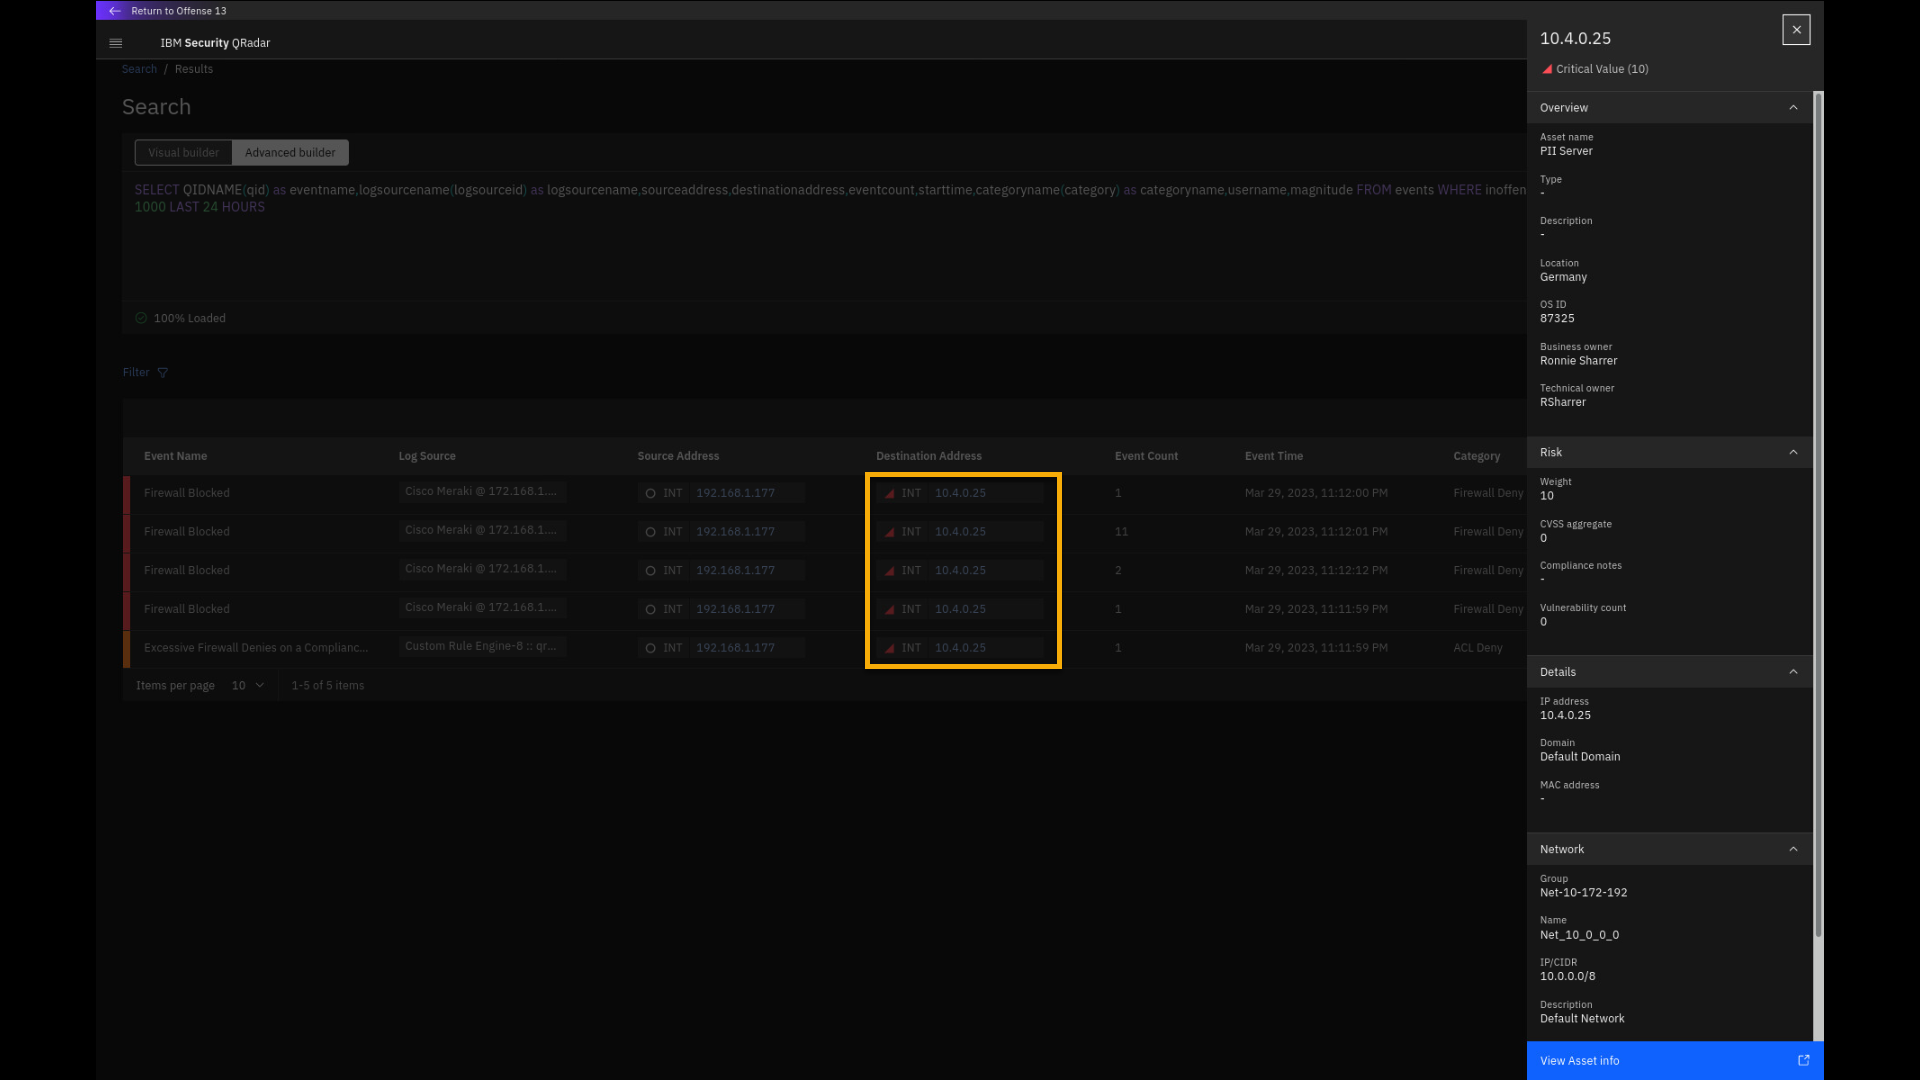
Note that this internal IP address is labelled as PII Server, which
means it contains personal identifiable information. Not properly
holding, processing, and protecting PII data can cause issues with many
compliance regulations if the data is compromised. We also see that this
asset has been manually assigned a risk weight of 10 in the QRadar Asset
database, it is located in Germany, and the owner is Ronnie Sharrer. If
more details about the asset are needed, you can click View Asset info,
which opens a new Asset details tab. -
Click View Asset info.
-
Review the asset details page and close it.
Hint: If you are running the virtual demo, you can click anywhere on
the page to close it.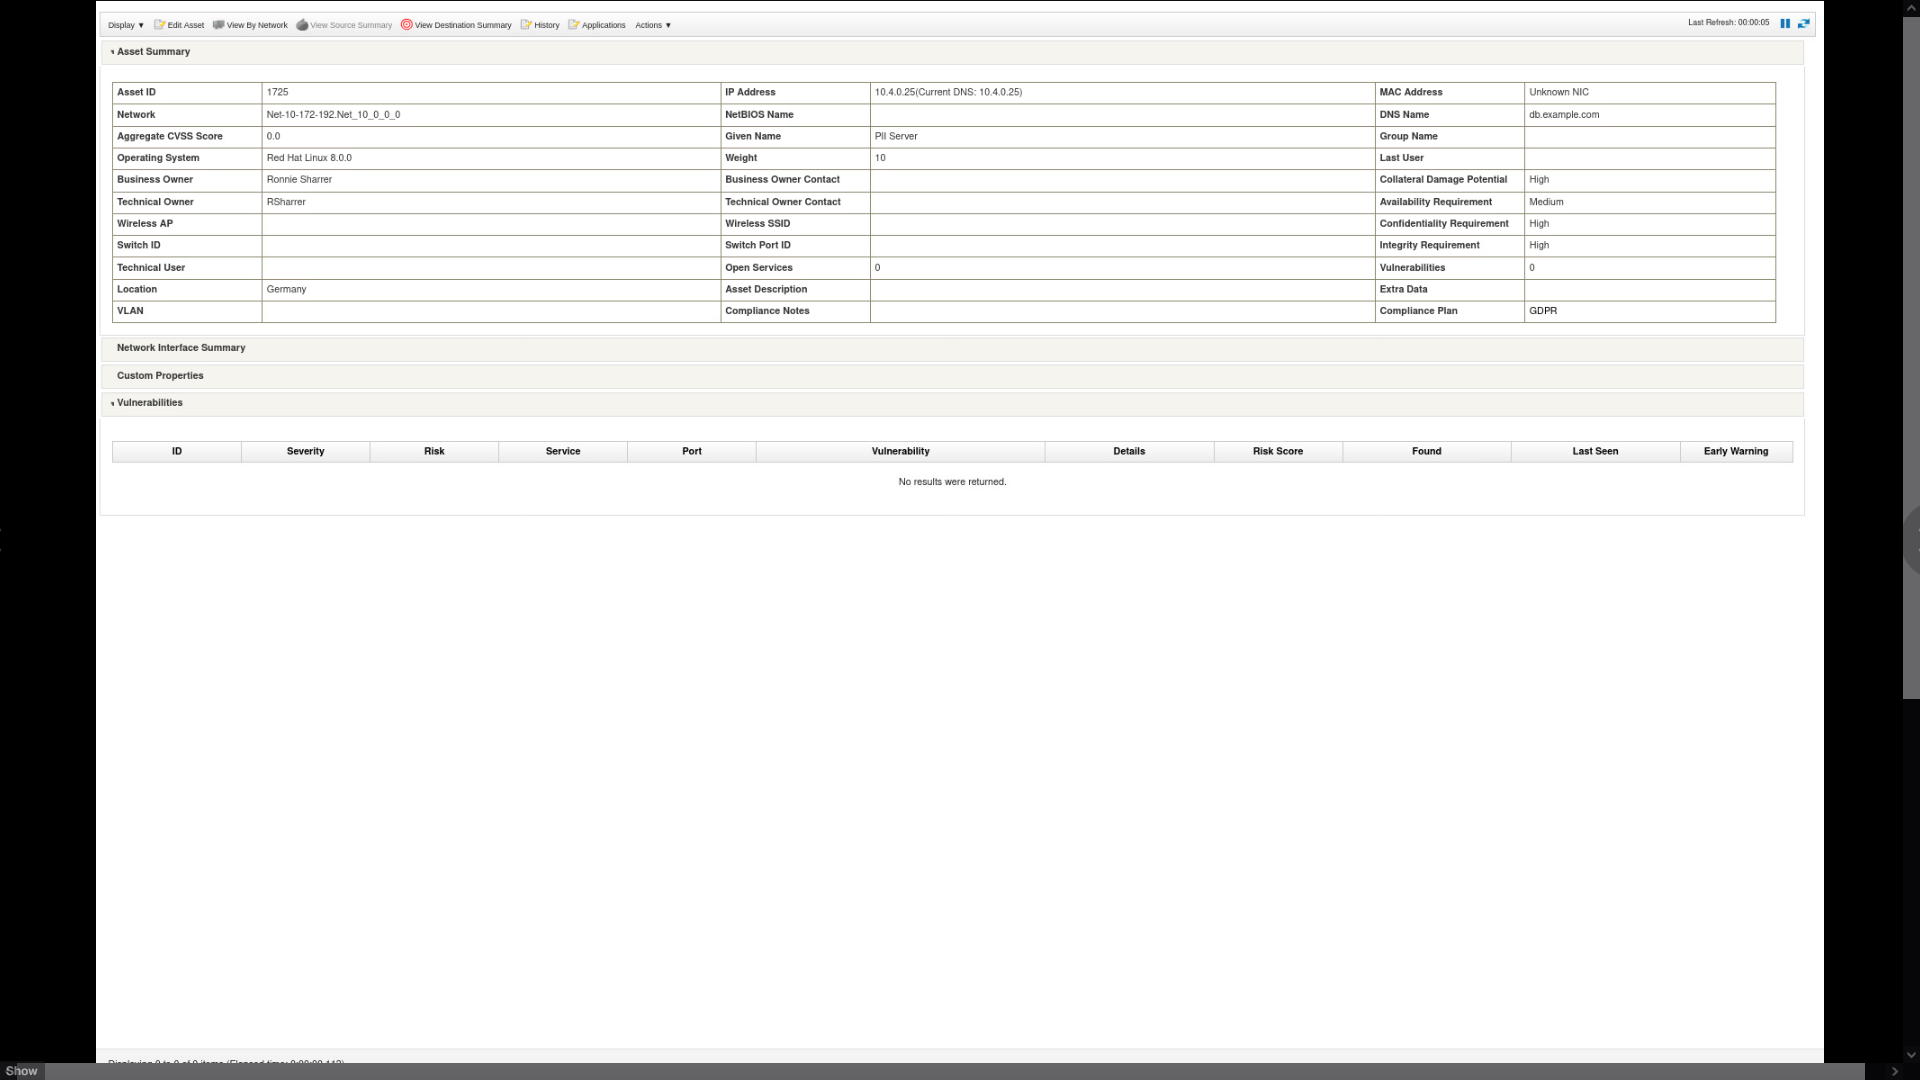
For example, the DNS Name indicates it is a database, and the Operating
System indicates the server is running Red Hat Linux 8. -
Close the Asset Details tab.
-
From the event search page, close the Asset info side pane, and in
the upper left corner, click Return to Offense <n>.Note: The offense number might vary.
This offense was not complex; it only contained one insight and 24
events. Moving forward, let's examine some more offenses related to some
other compliance aspects. -
Click Offenses in the breadcrumb to return to the main offense
dashboard screen.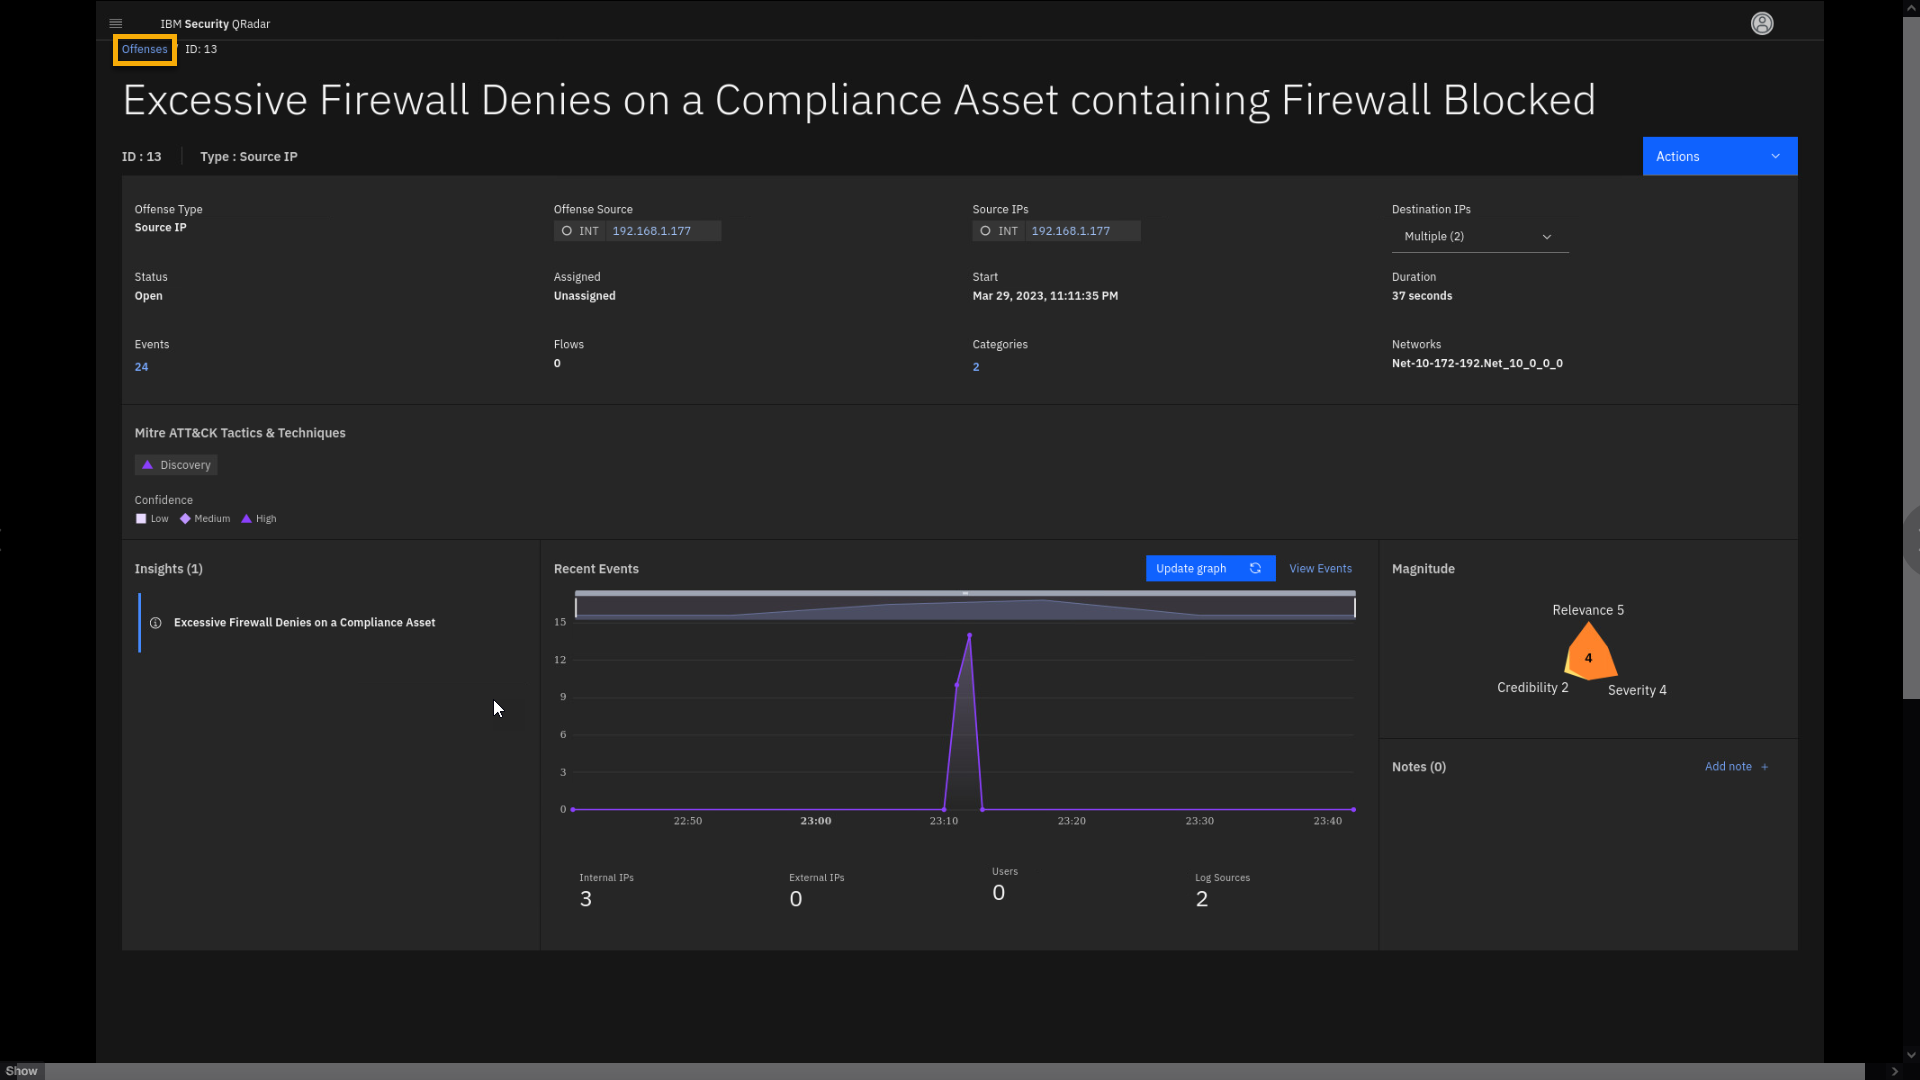
Offense 2 - Security Logging Disabled on a Compliance Asset
Hint: If needed, apply the Compliance filter again to reduce the
number of offenses on the screen.
Many regulations have requirements intended to provide guidelines for
minimum protection related to standard objectives. For example, Payment
Card Industry Data Security Standard (PCI DSS) is a set of requirements
intended to ensure that all organizations that process, store, or
transmit credit card information maintain a secure environment.QRadar helps you stay compliant with these standards by accurately
logging all access, modifications, and deletion attempts to PCI data.
All activity dealing with cardholder data and primary account numbers
(PAN) requires a log entry according to various compliance standards.
-
From the offense page, filtered by Compliance related events, click
the Security Logging Disabled on a C... offense to review
details.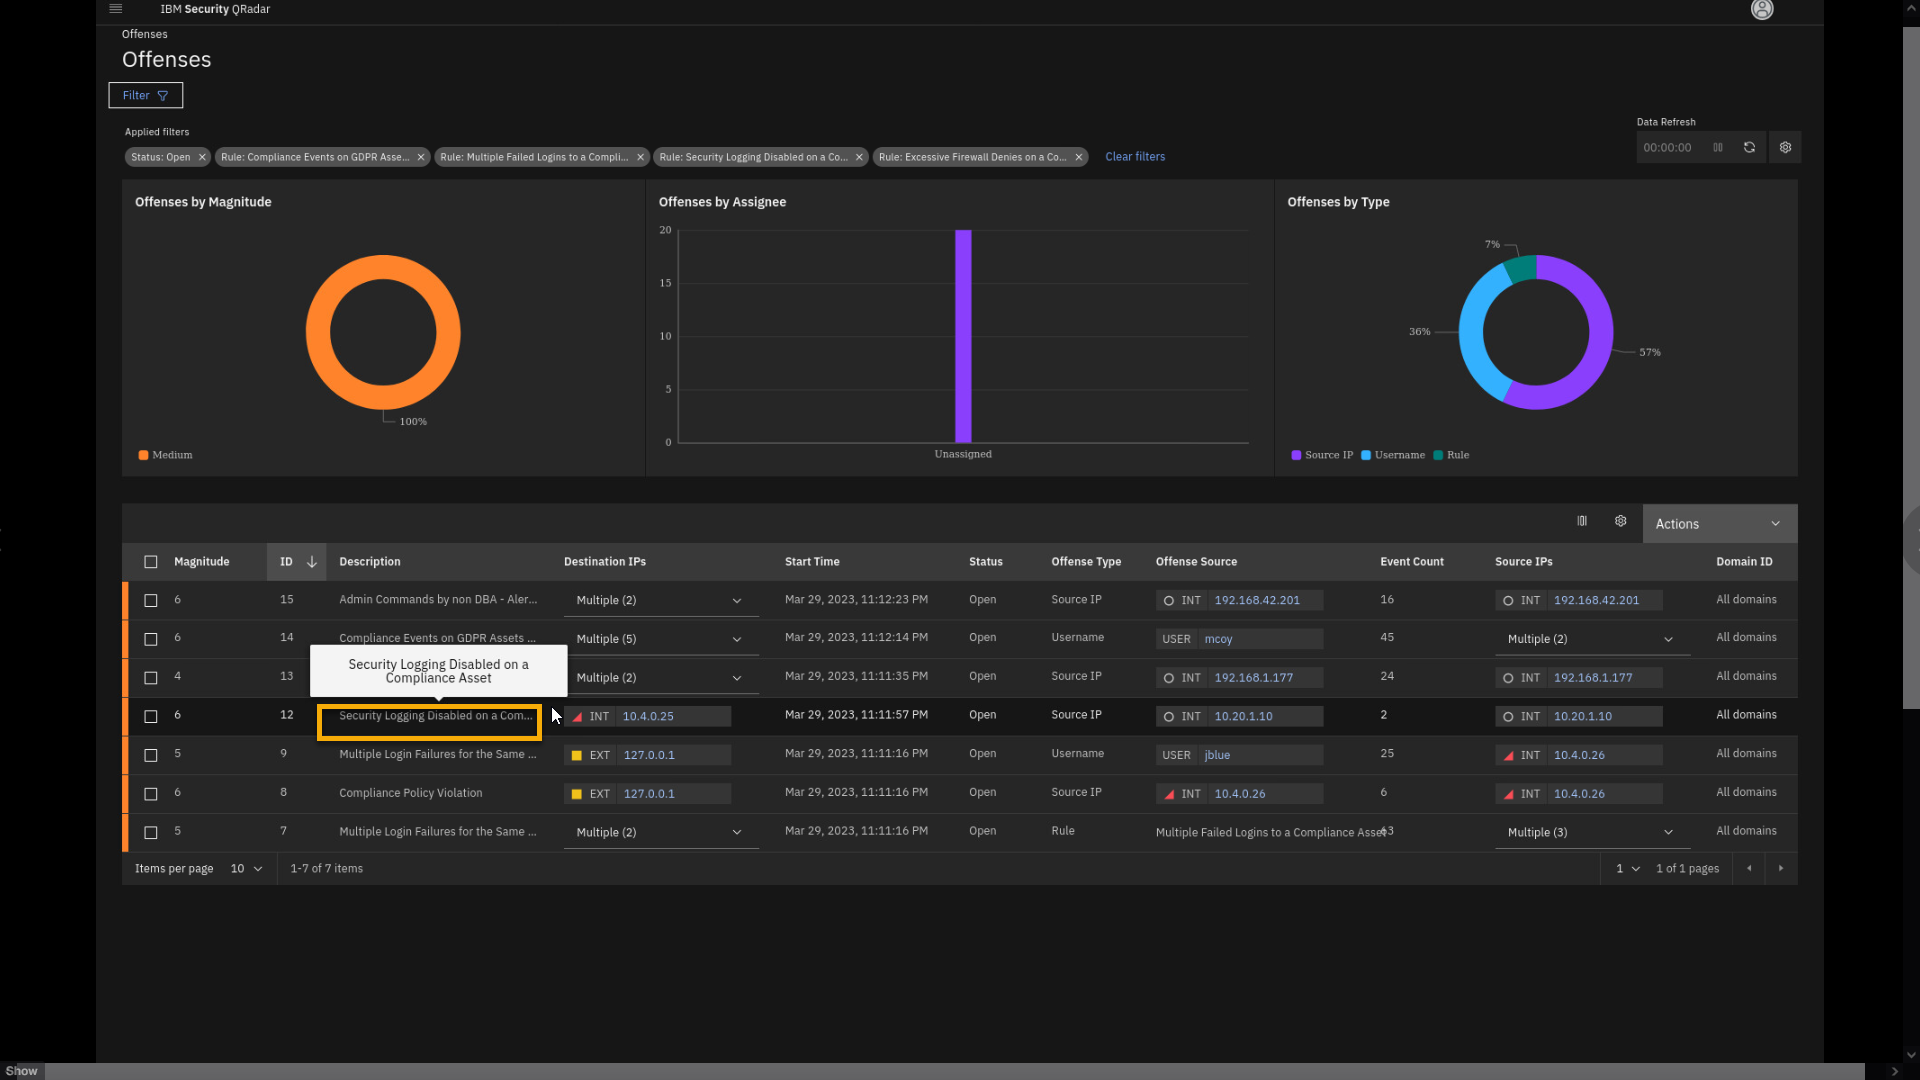
-
Click the ellipsis in the title to expand the full name of the
offense.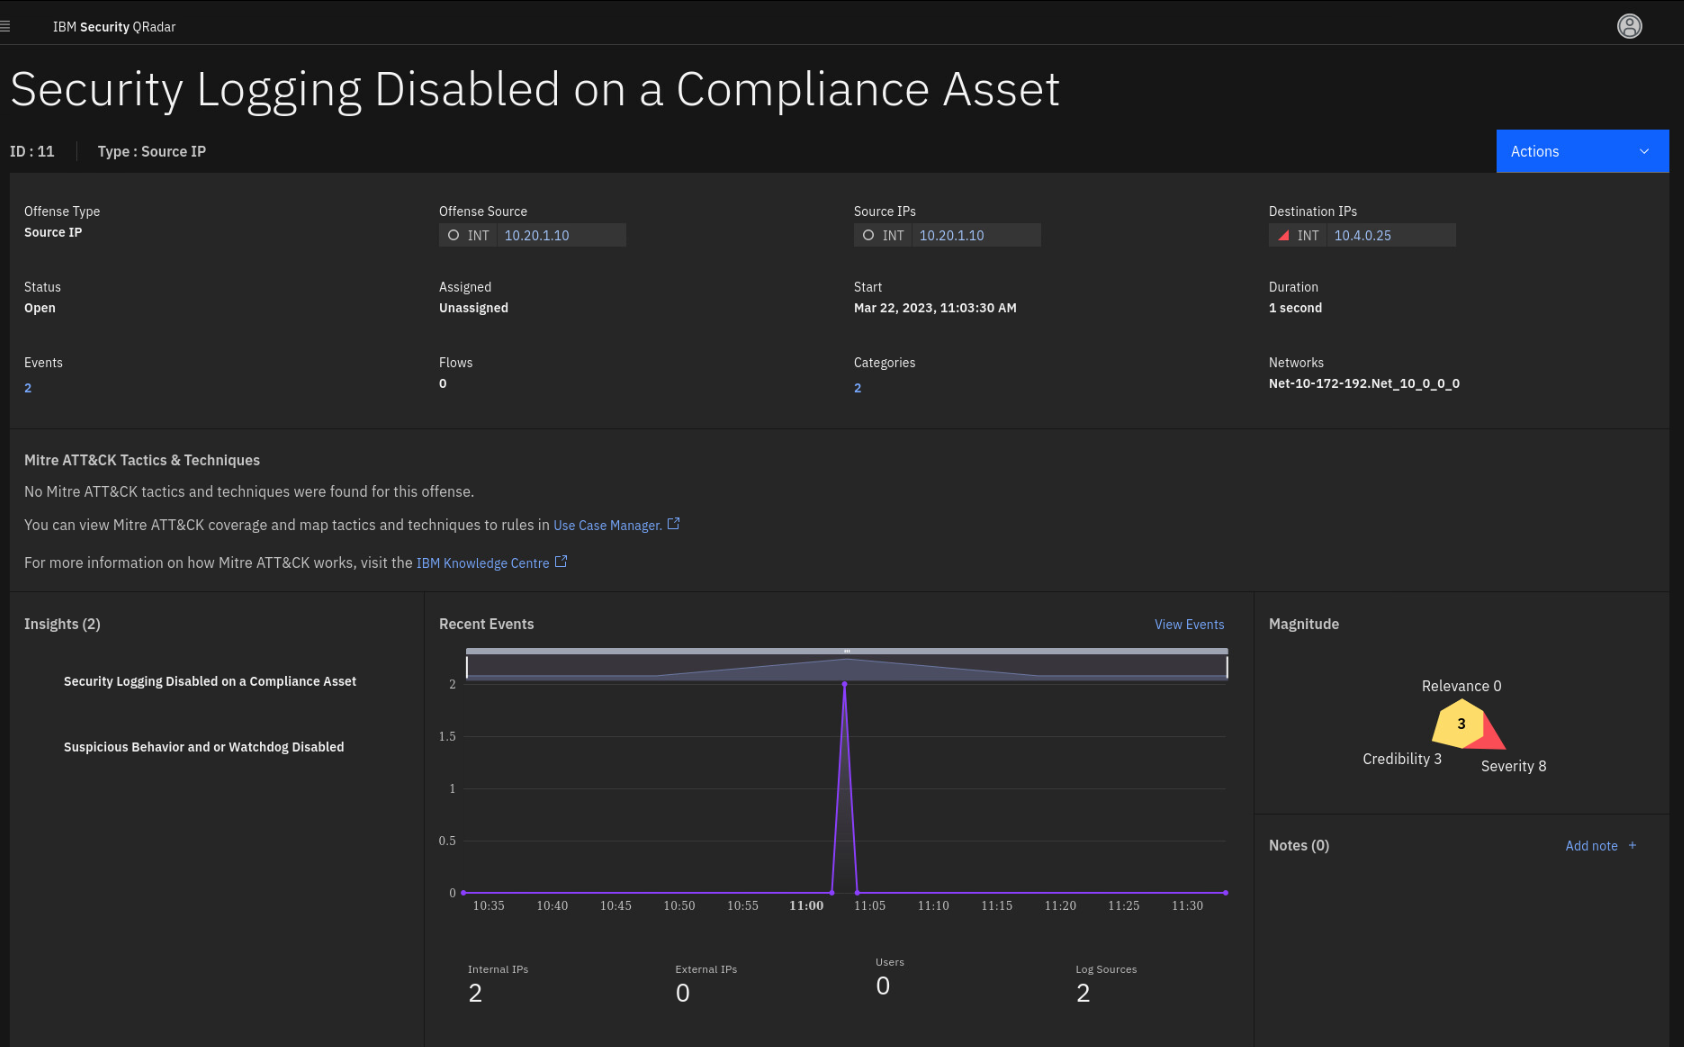
Like our previous use case, we take a close look at suspicious behavior
on a compliance-relevant asset related to disabling security logs.Security logs are important for overall coverage in monitoring and
detecting malicious activities. Moreover, the offense indicates it is
happening on an asset with compliance-relevant data (Destination IP).The offense is based on communication between two internal IP addresses.
There is no trace of user activity. Note the Destination IP shows a red
triangle indicating a high risk score for the asset. -
To learn more about the asset, click the 10.4.0.25 IP.
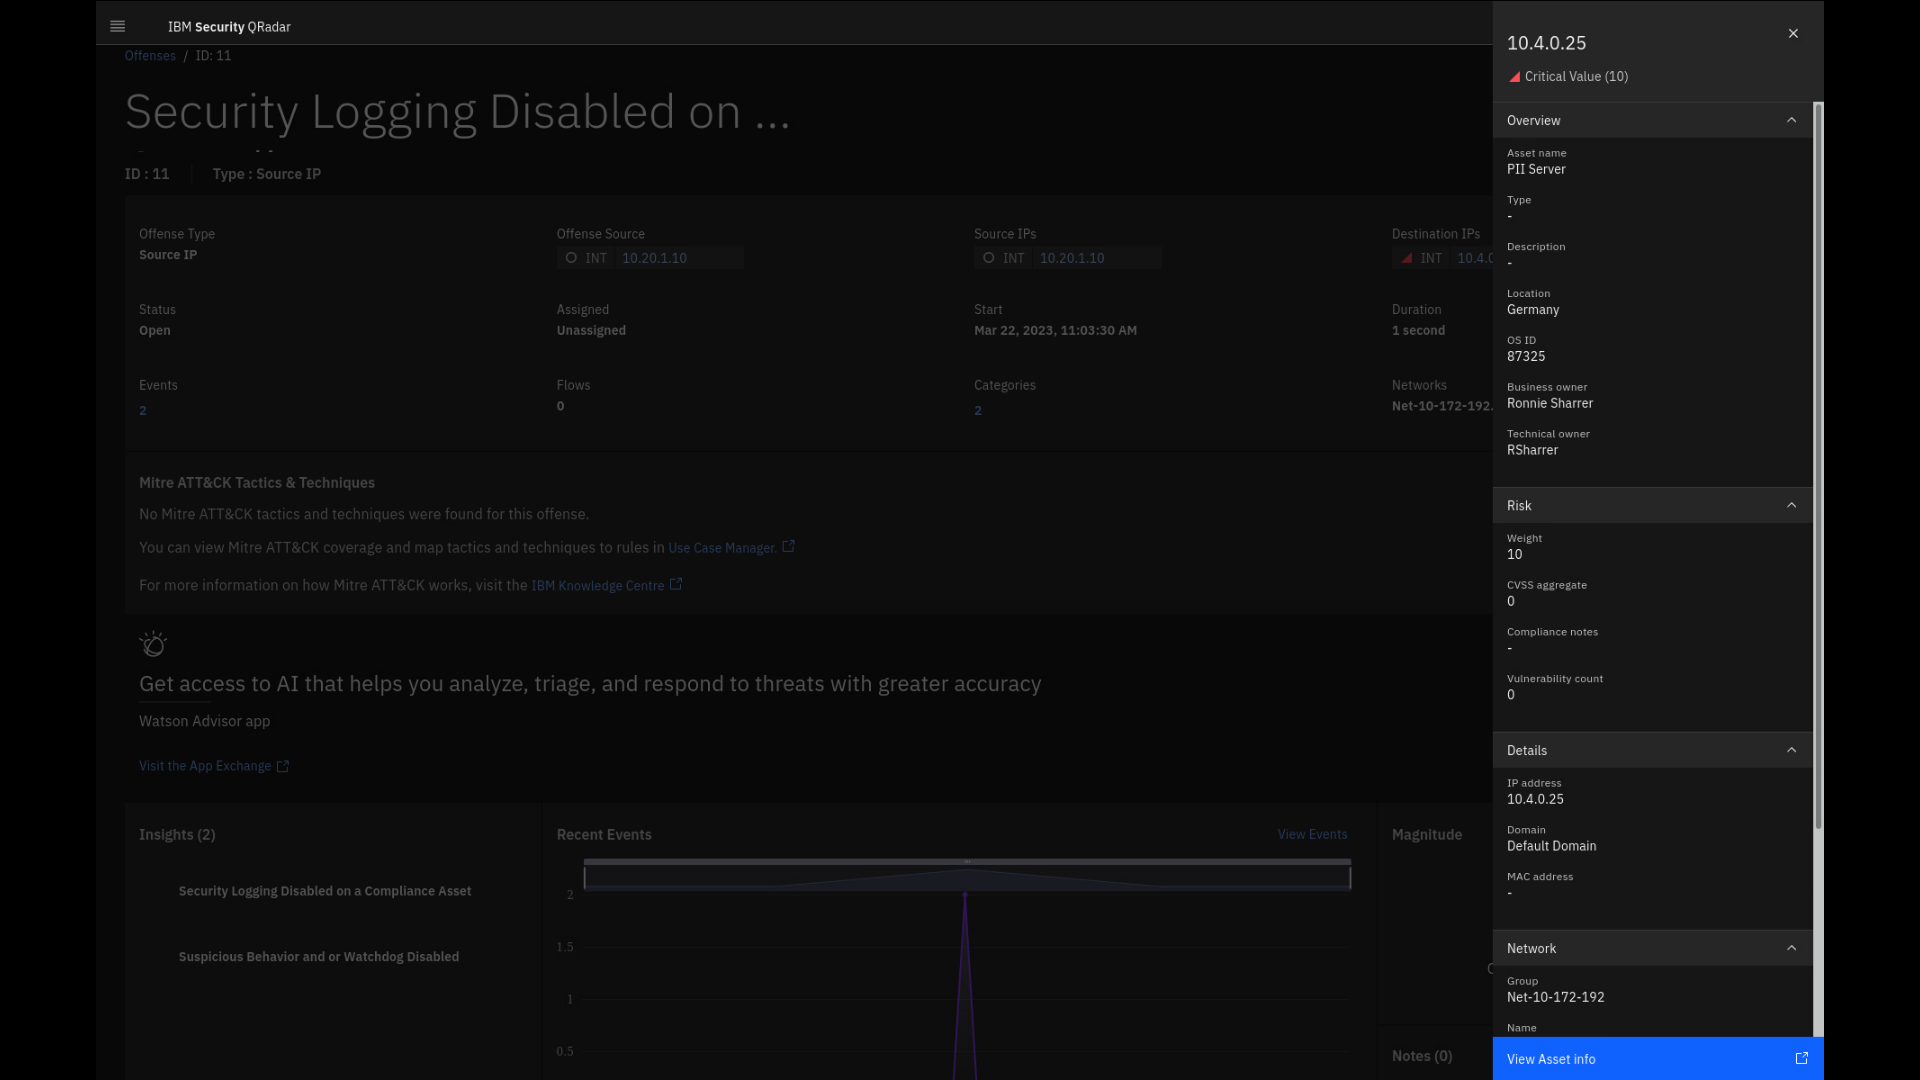
This asset is reported as a server containing PII
information, and it has a risk score weight of 10. It is located in
Germany, and the owner is Ronnie Sharrer. -
Click View Asset info, and a new Asset Details tab opens.
-
Review the asset.
For example, the DNS Name implies it is a database, and the Operating
System indicates the server is running on a Red Hat Linux 8. -
To go back to the offense, close the Asset details tab.
-
Close the Asset info side panel.
Let's review some other parameters of the offense, such as the log
sources reporting on this asset. -
To review the log sources, click the Log Sources 2 at the right
bottom of the page, indicating the amount of the log sources that
contributed to the offense.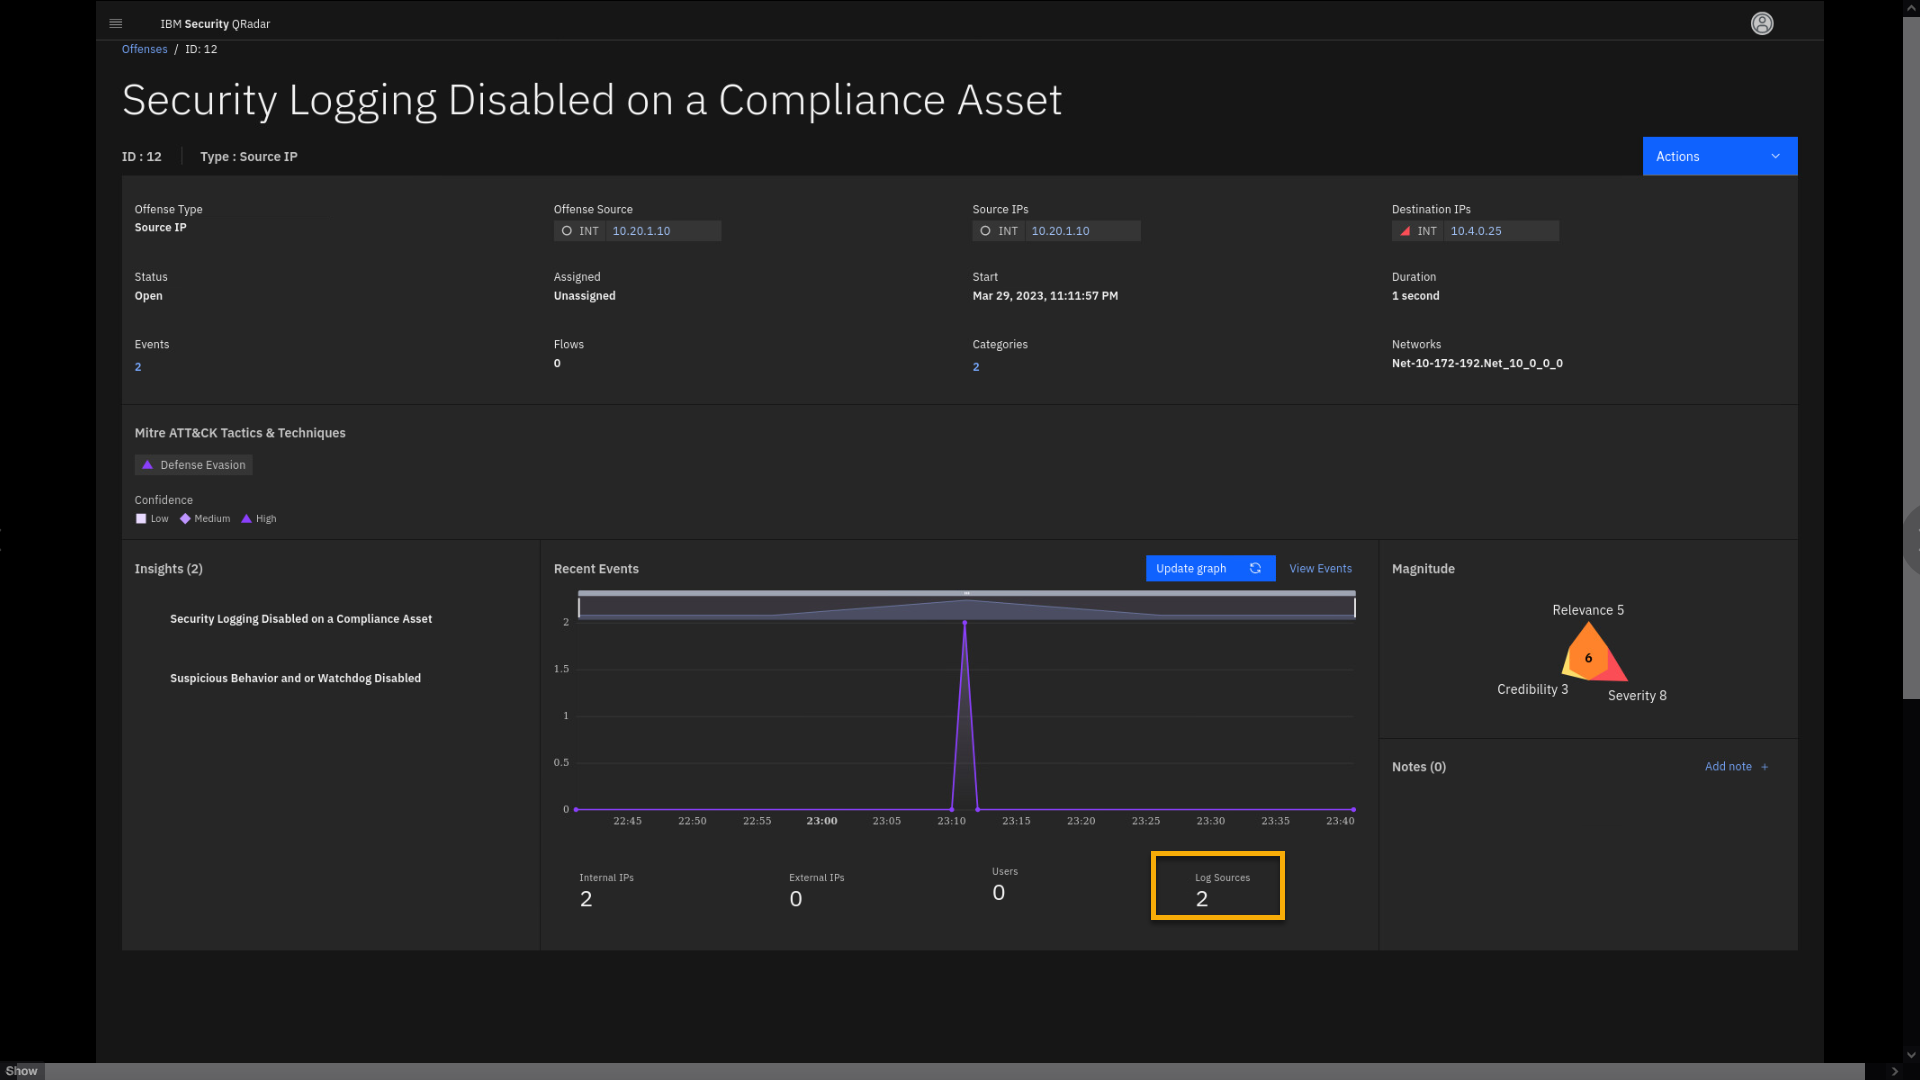
-
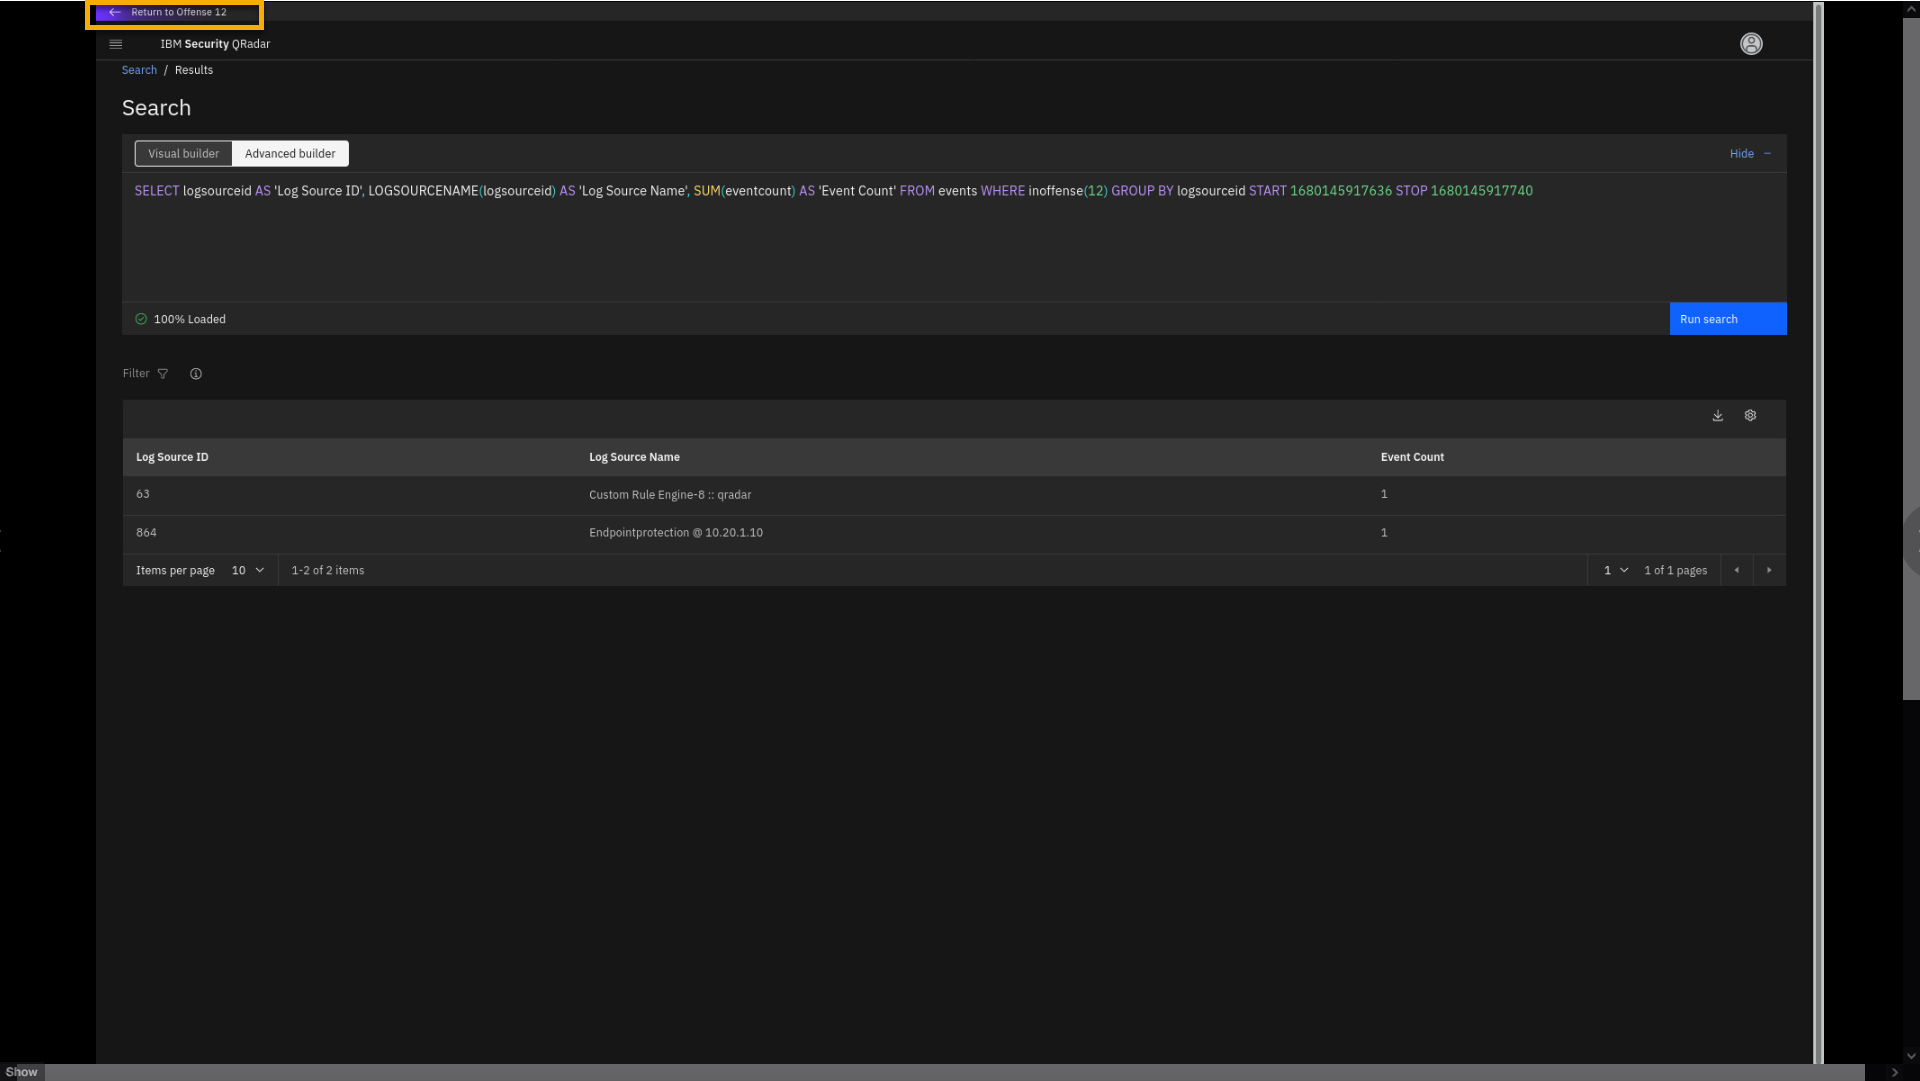
Review the search results for the log sources associated with the
offense.The main log source reporting on this offense is an EDR system (endpoint
protection) with the IP address 10.20.1.10. This can be an EDR server
reporting on the endpoint, which is, in this case, the destination IP of
the PII database server that we reviewed just a while ago.The other log source in this search result is the QRadar custom rules
engine. These events are usually triggered by conditions found in other
events, for example, if a certain number of events have occurred or if a
certain accumulated risk score has been reached. Events from the QRadar
custom rules engine can influence the creation of new events, increase
or decrease magnitude and other levels for offenses, or act in many
other ways. -
Click Return to Offense <n>.
Note: The offense number might vary.
-
To review the insight, click Suspicious Behavior and or Watchdog
Disabled.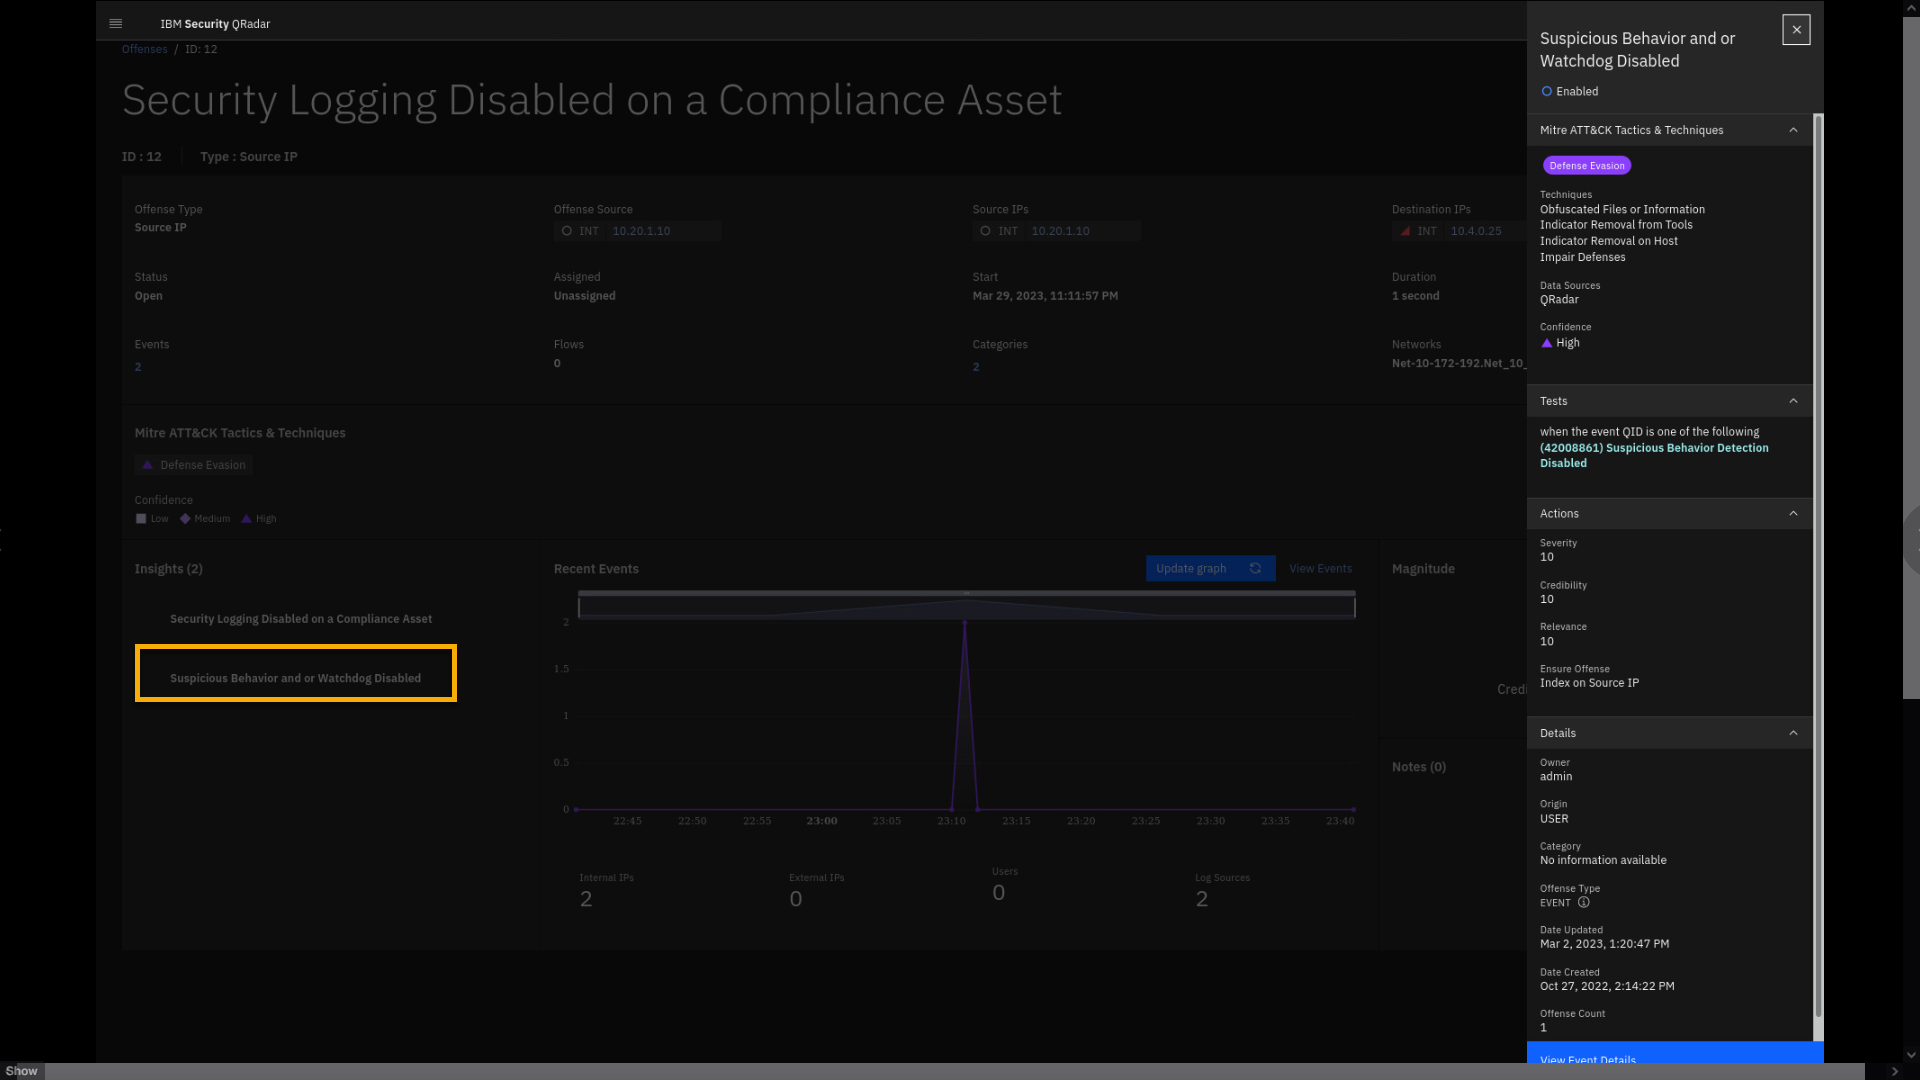
Looking at the Tests condition, you can see that Suspicious Behavior
Detection has been disabled. Let's examine the events associated with
these insights. -
Click View Event Details.
Note that the search is automatically formed to collect the data
associated with the offense and this insight. -
In the search result table, click the Event Name to open the details
pane.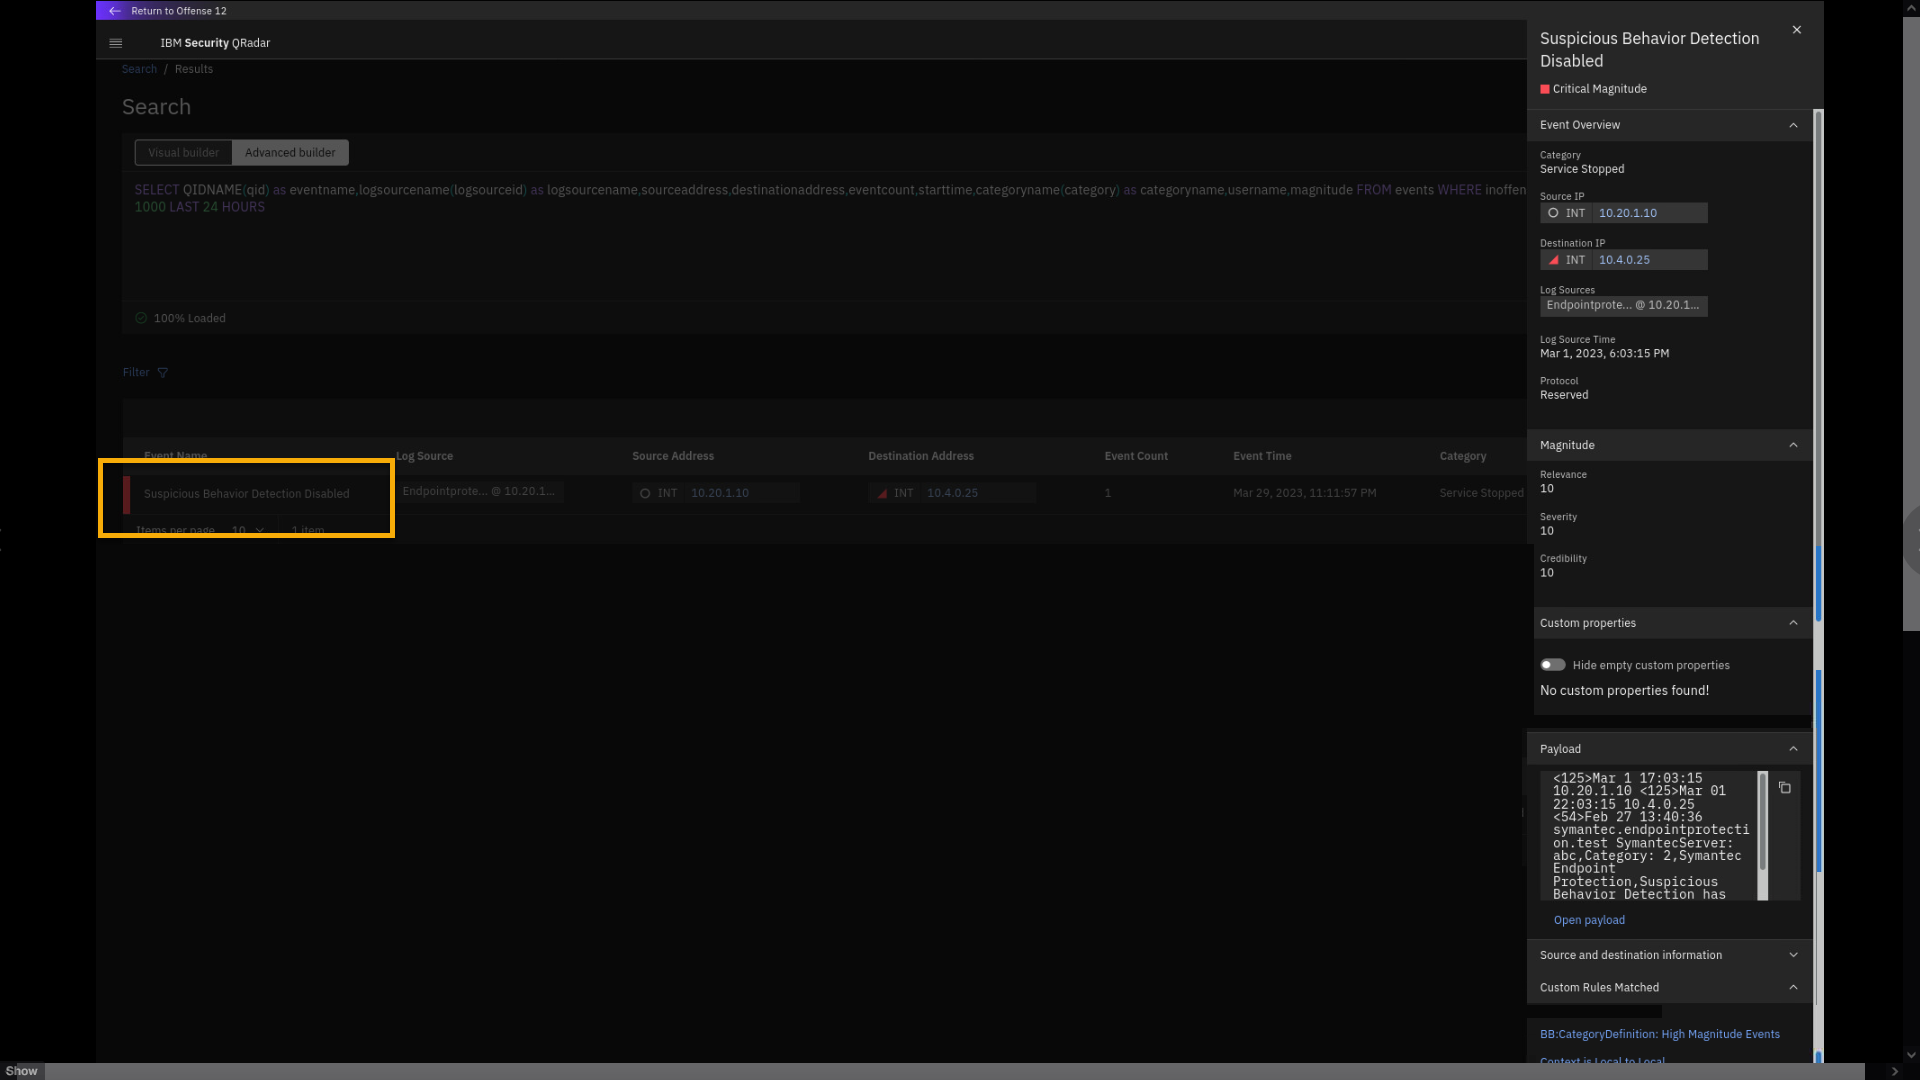
This event was generated by Symantec Endpoint Protection. The
event Category is Service Stopped. Based on the Critical Magnitude and
realizing that this insight pertains to a critical compliance-relevant
asset, the analyst must act immediately. Let's examine the raw payload
in more detail. -
In the Insights pane, click Open payload.
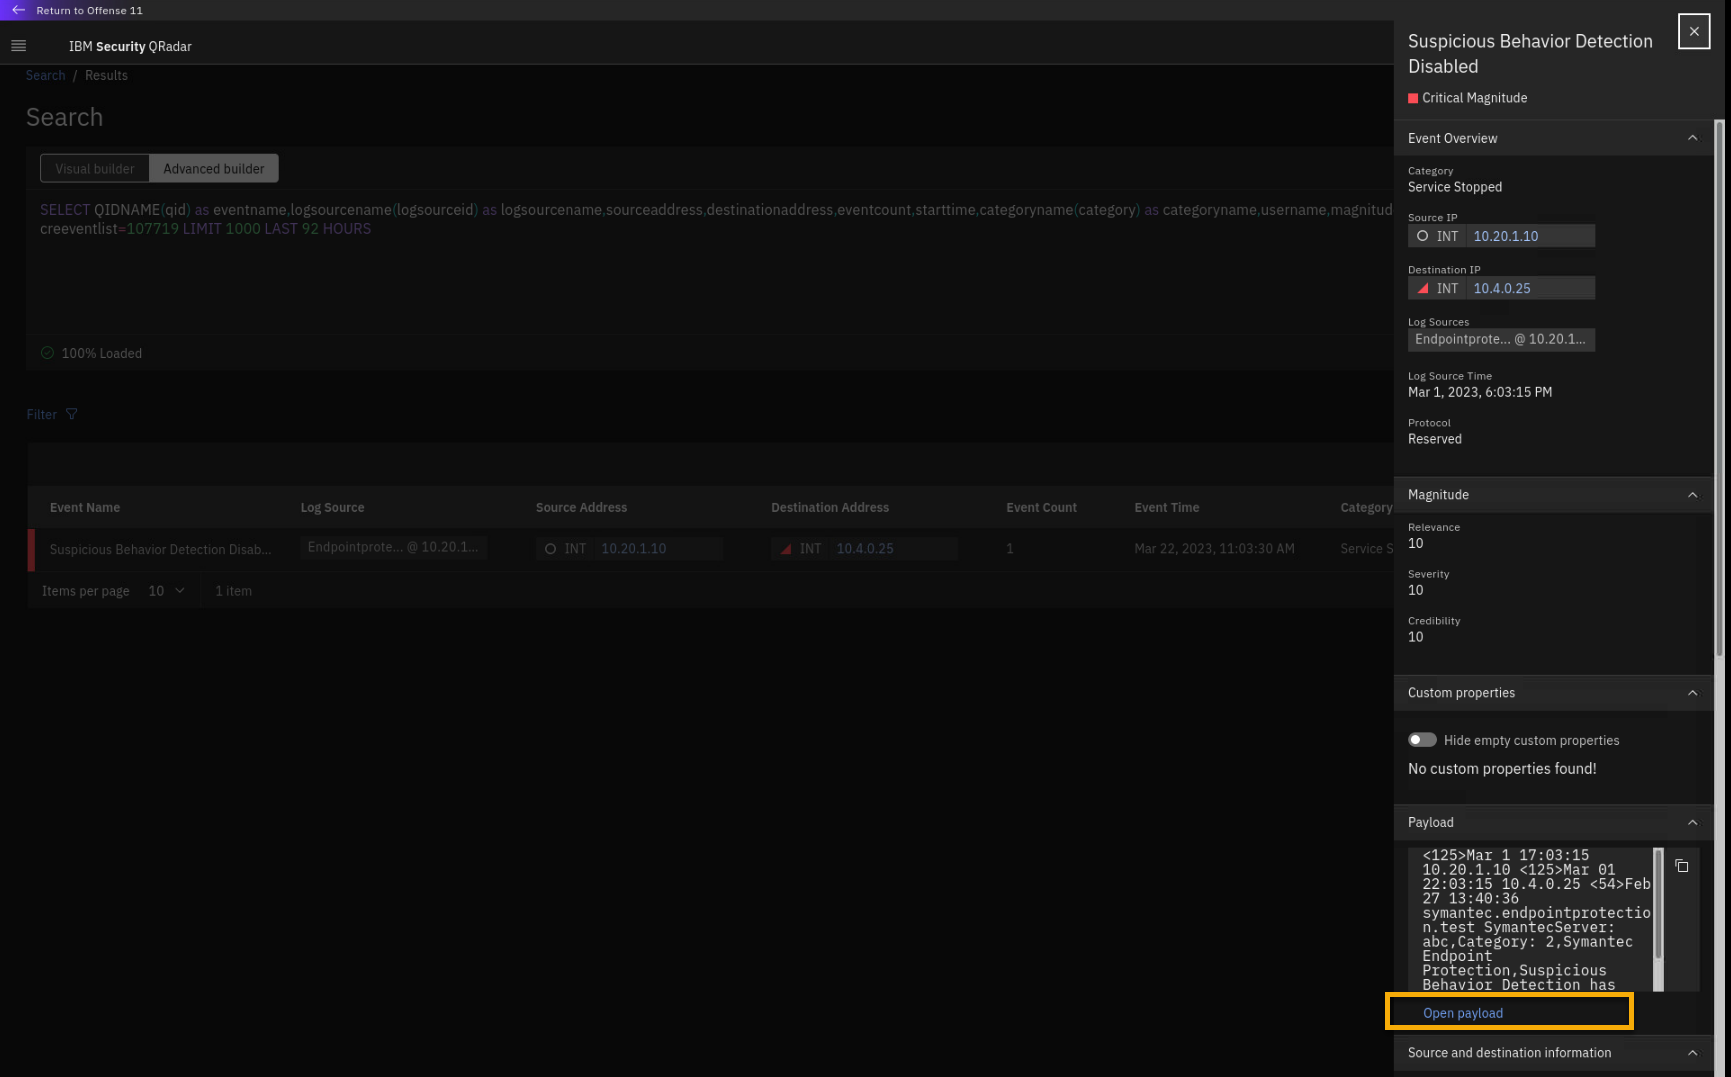
-
Review the payload.
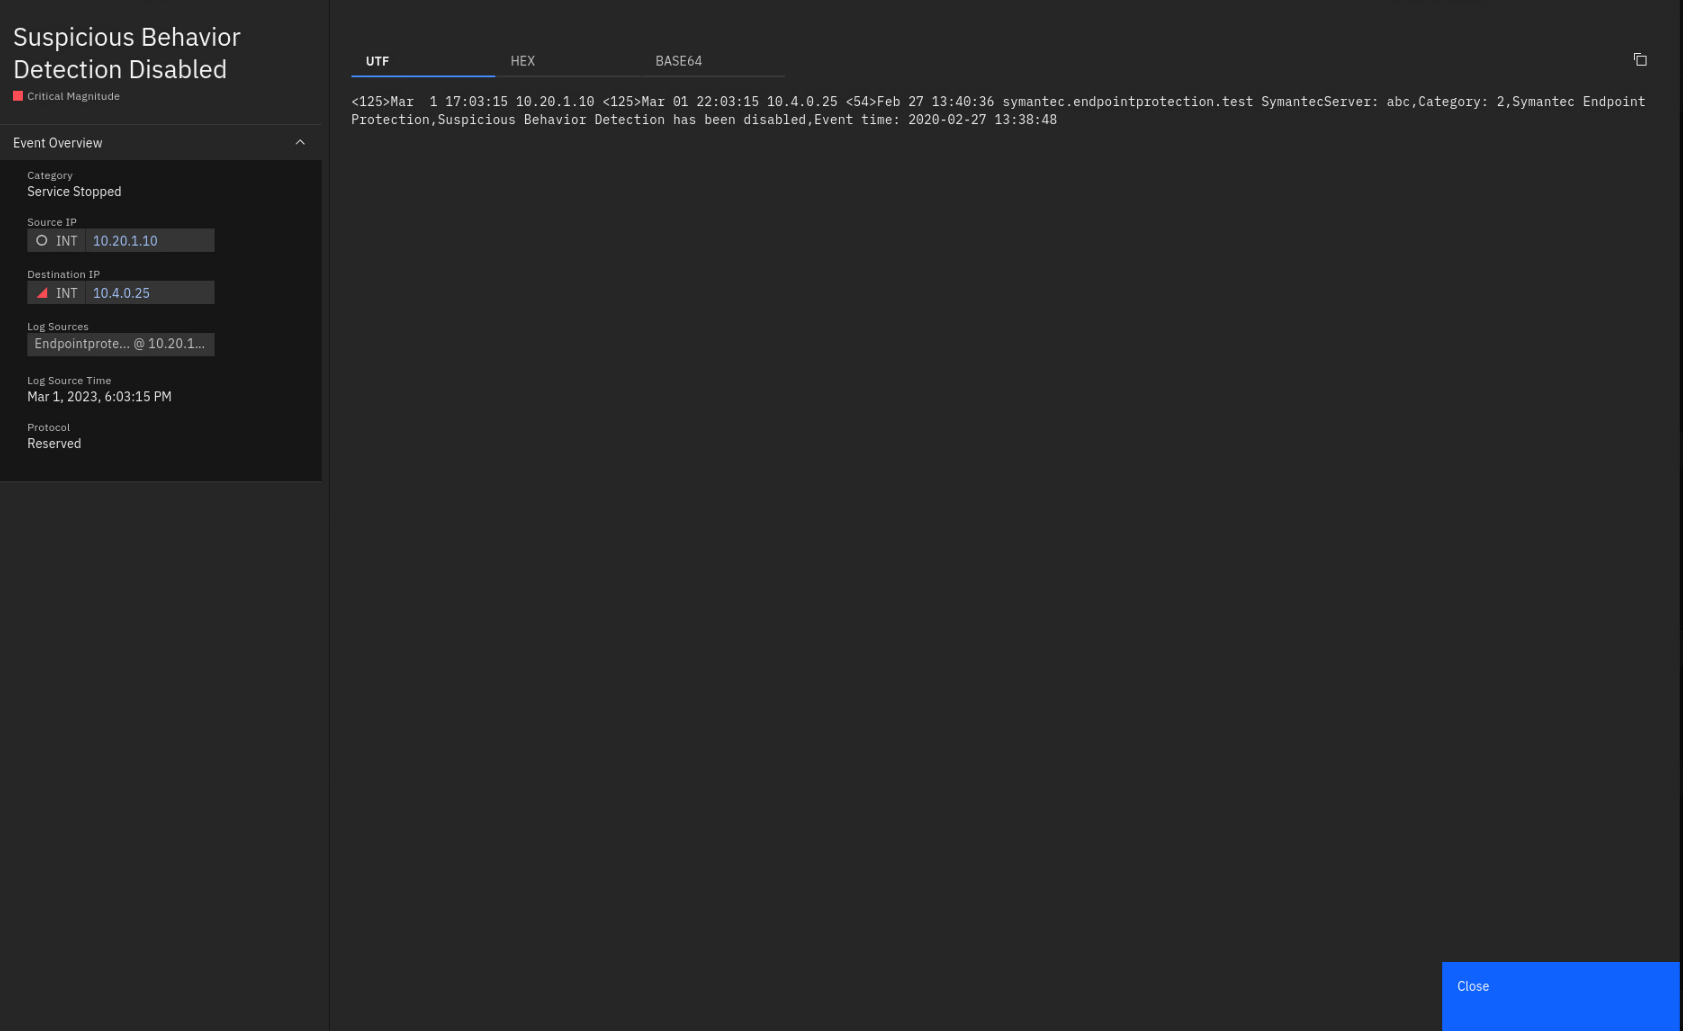
The payload confirms that Symantec Endpoint Protection was disabled on
the compliance-relevant asset (10.4.0.25) with PII data. -
Close the Payload window.
-
To return to the search window, close the side pane.
-
Click Return to offense <n>.
Note: The offense number might vary.

> Many organizations use the [MITRE ATT&CK Framework](https://attack.mitre.org/), which represents adversary tactics that are used in a security attack. It documents common tactics, techniques, and procedures that can be used in advanced persistent threats against enterprise networks. The QRadar Use Case Manager app can map custom rules and building blocks to specific tactics and techniques to allow organizations to visualize, understand, and plan their threat detection coverage.
Next in this demo, you will investigate the MITRE ATT&CK classification and learn that the offense is classfied as a Defense Evasion tactic.
-
To review the details of the MITRE ATT&CK classification, click
Defense Evasion.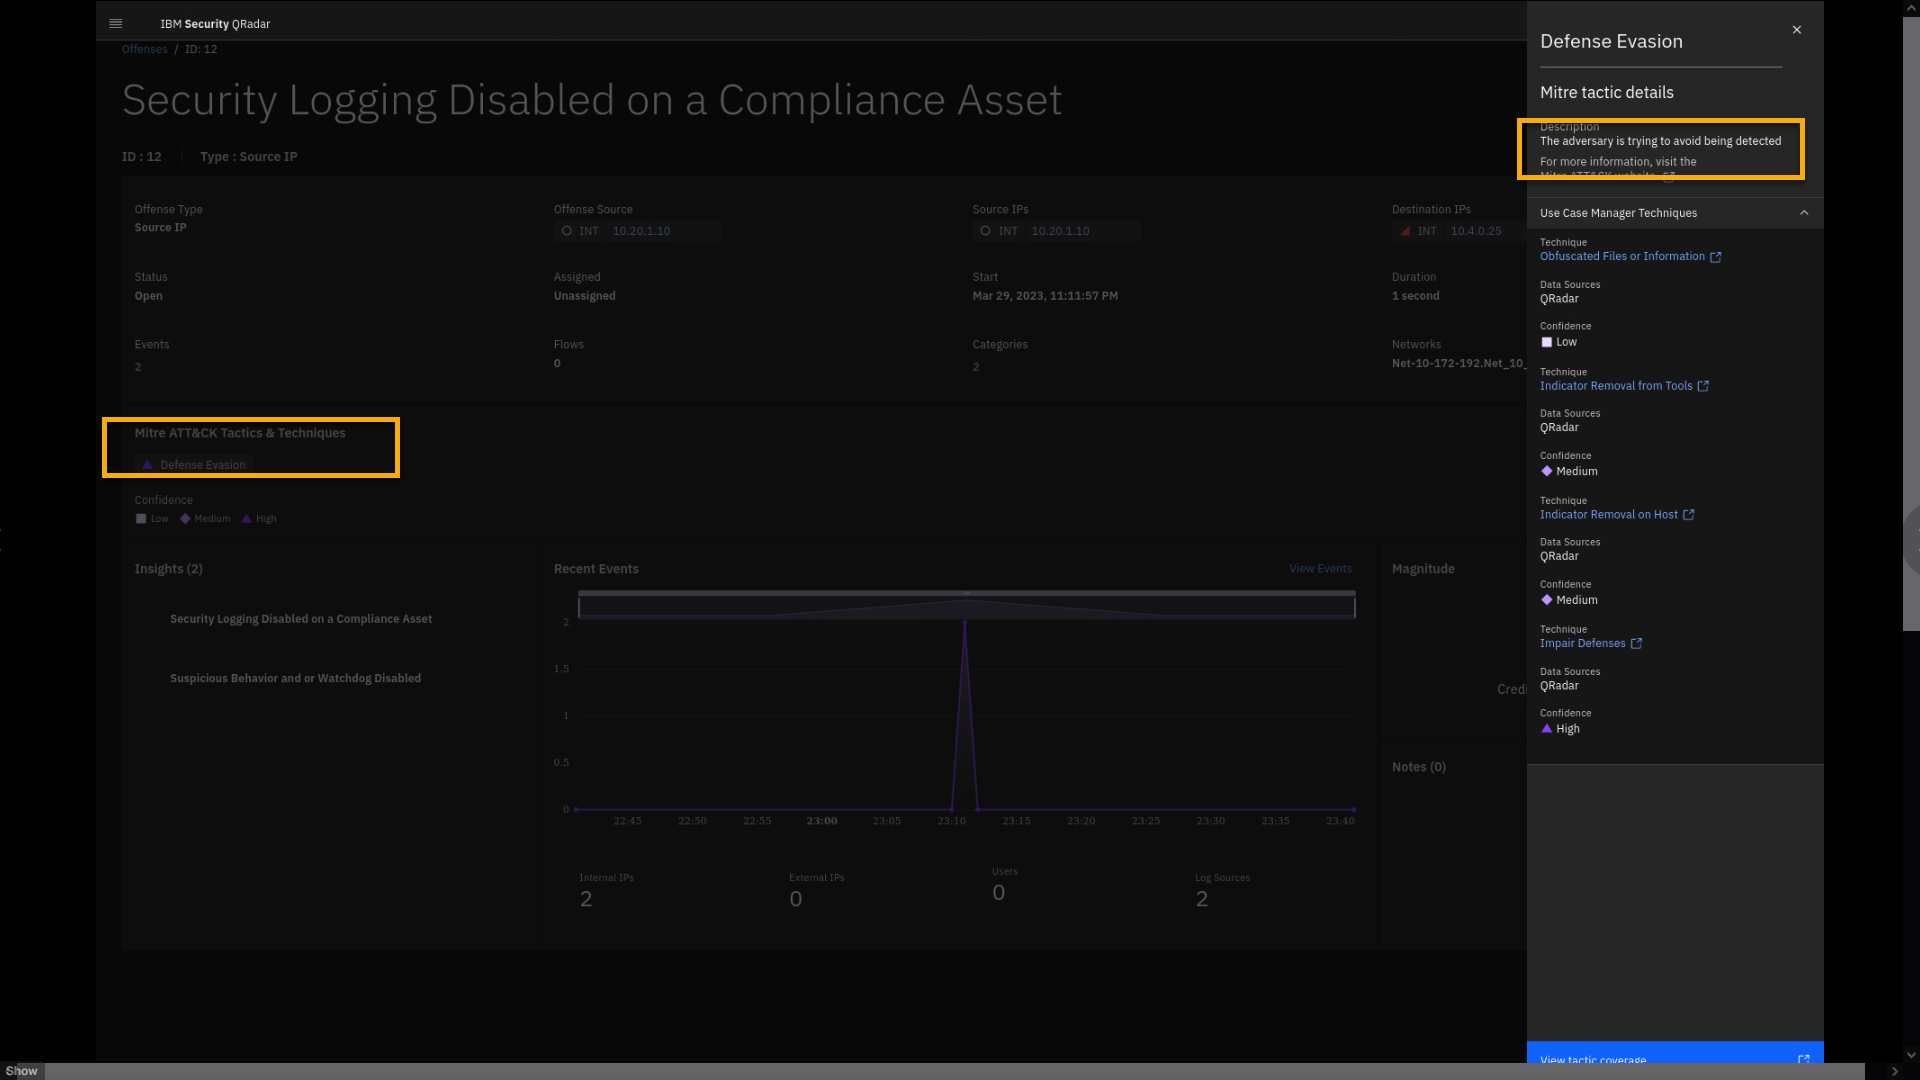
The attack is classified as Defense Evasion -- the adversary is trying
to avoid being detected.In the side pane you can see which of the MITRE techniques are covered
by your rules and building blocks that supported triggering the offense,
including the Confidence level.Learn more about the MITRE Defense Evasion tactic by clicking
View tactic coverage. -
Click View tactic coverage to navigate to the MITRE website for
the Defense Evasion tactic. Browse through some of the details.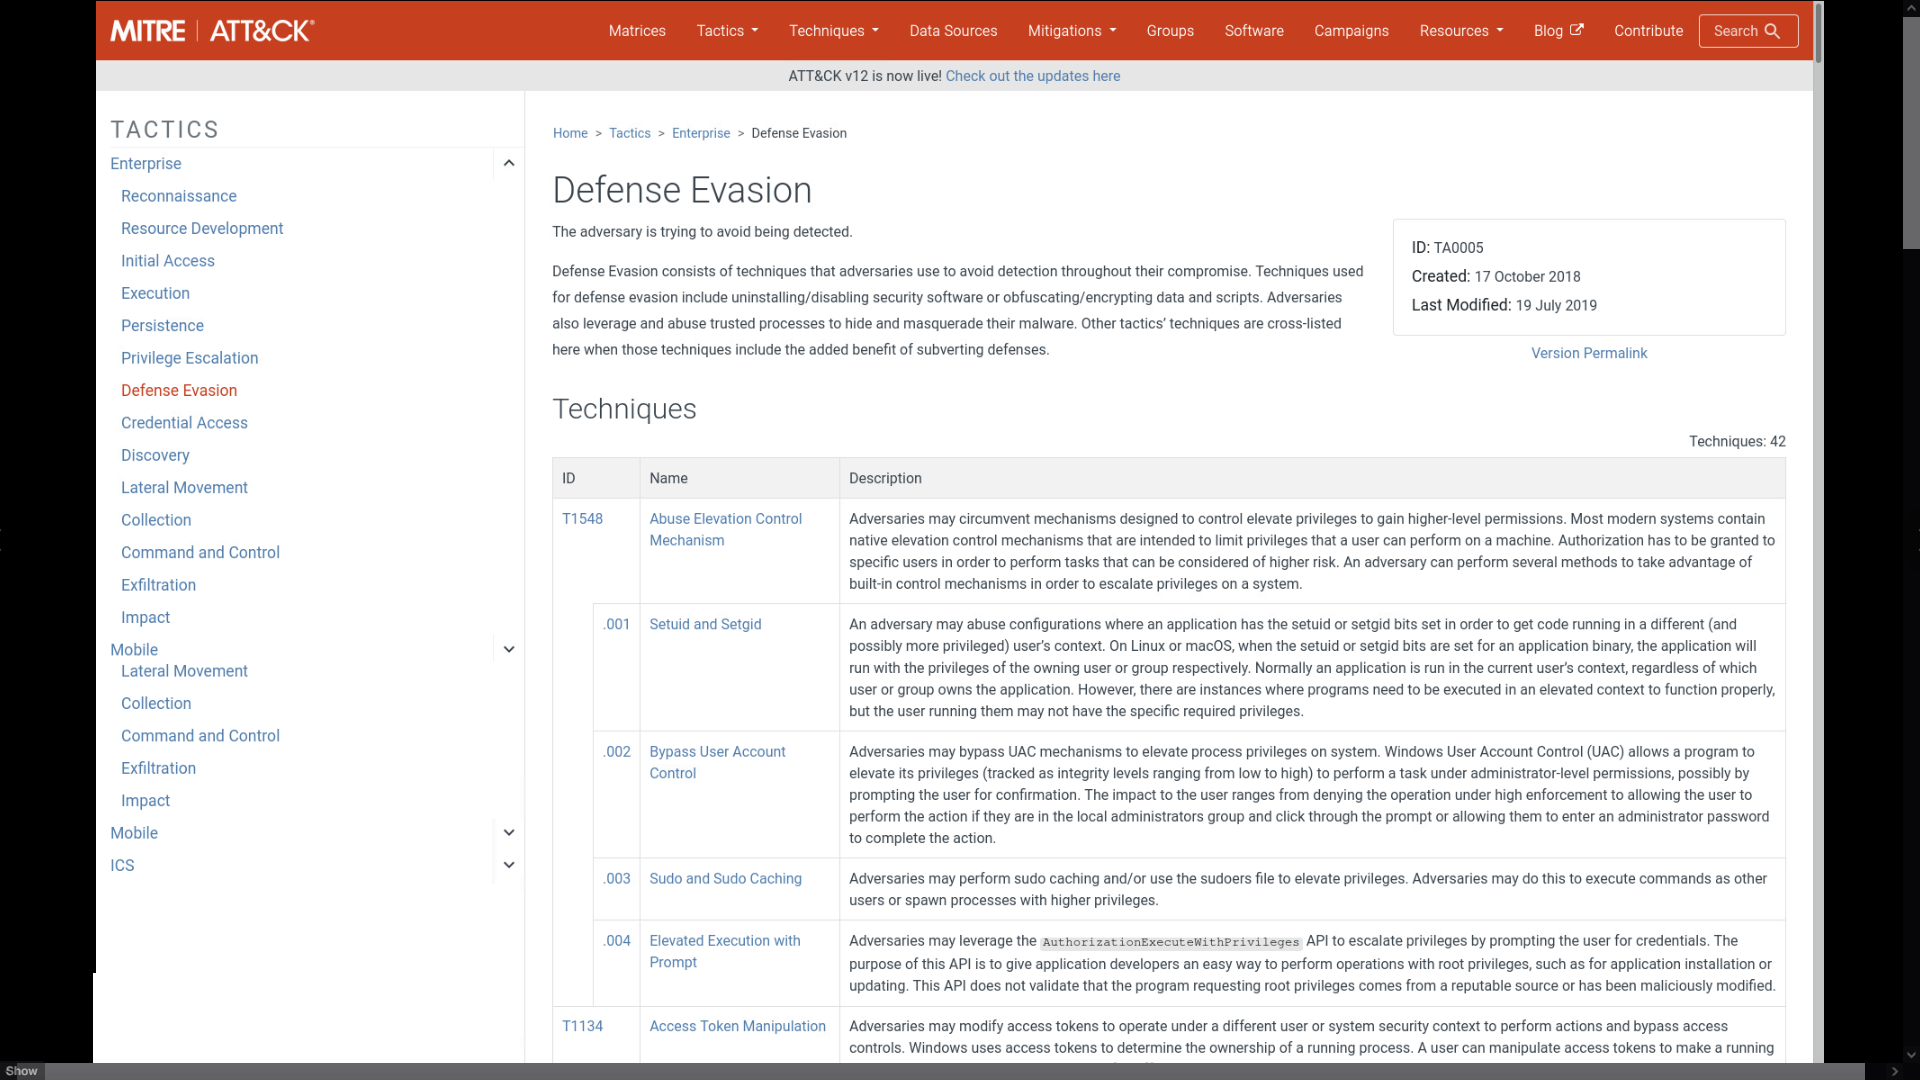
This integration through the link in View Tactics coverage to the MITRE website accelerates access for the security analyst to details about each of the tactics and techniques.
-
After reviewing the MITRE page, close the MITRE tab.
-
Close the Defense Evasion side panel and click the Offenses
breadcrumb to review the last use case.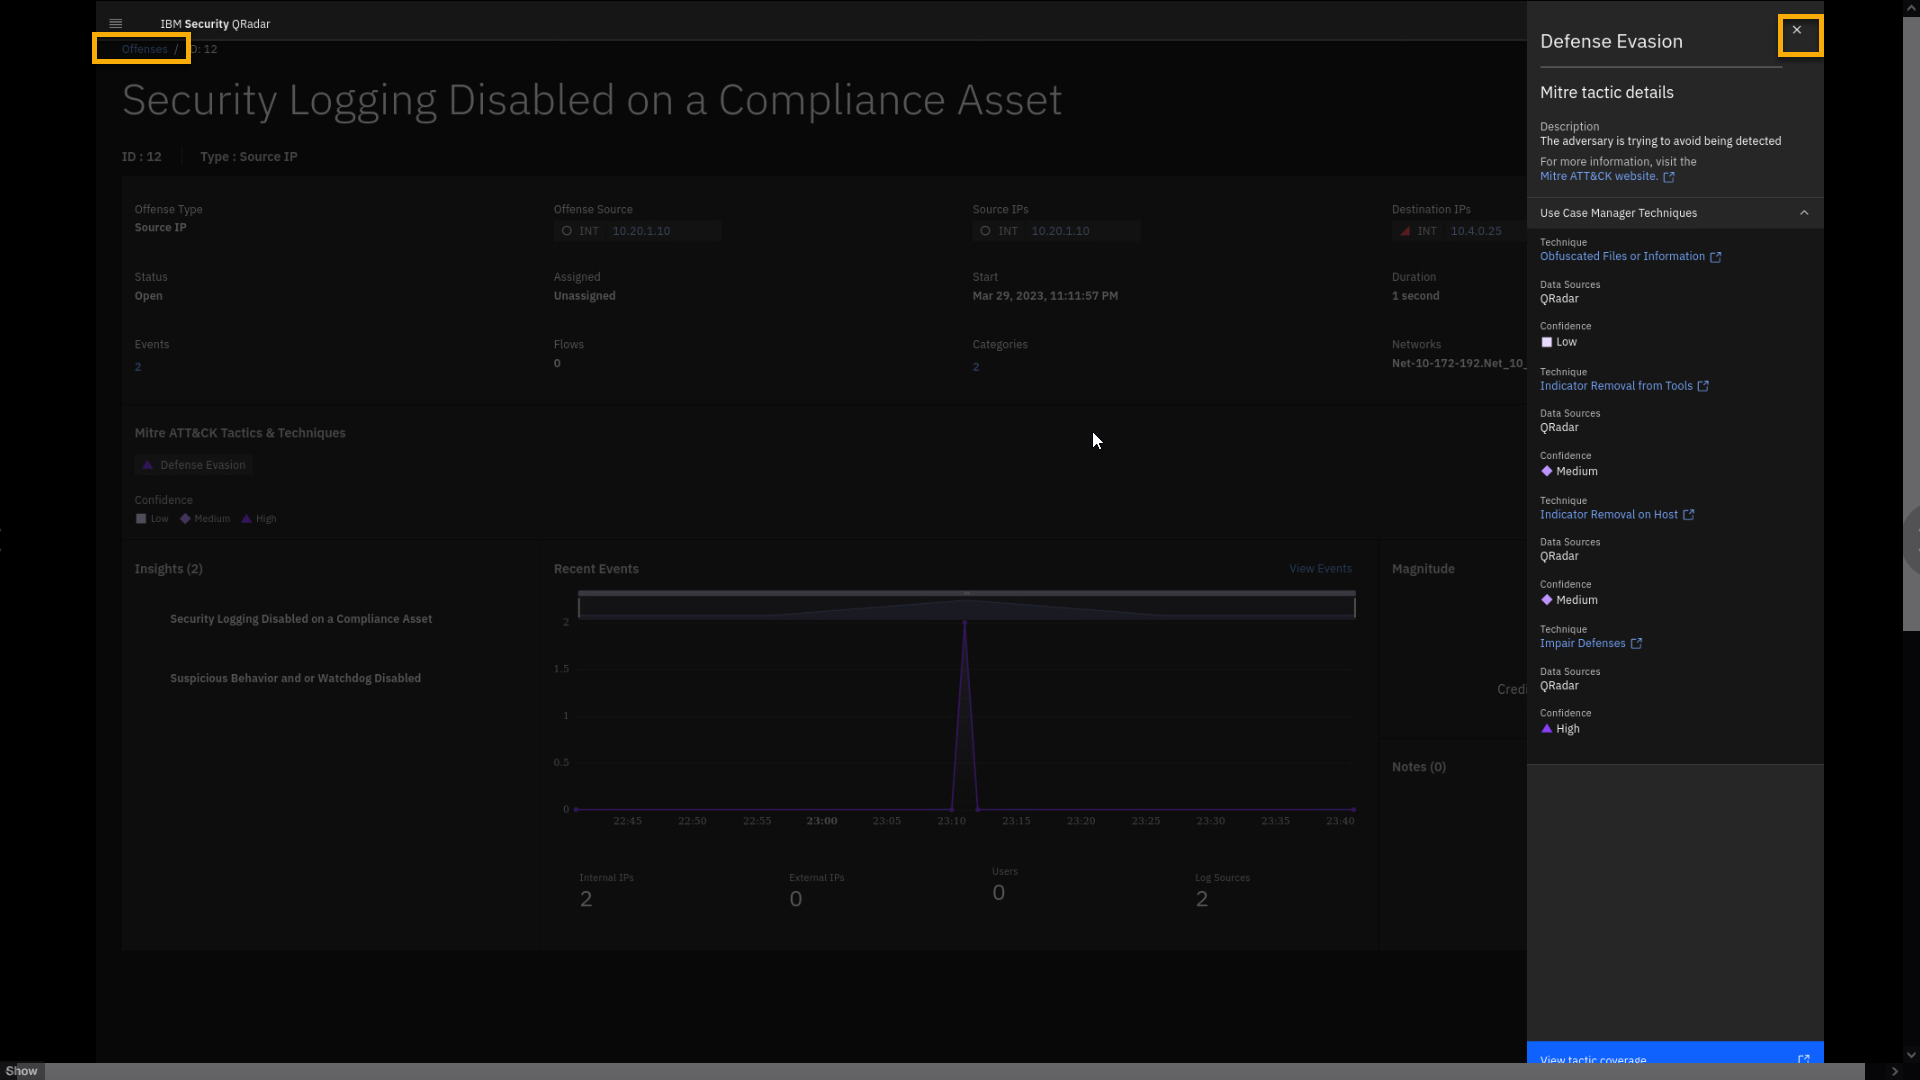
We have reviewed one more offense, which was indexed on the Source IP address. In this offense, a Symantec Endpoint Protection server reported a disabled endpoint protection service on the destination IP address of a high-value compliance-relevant asset.
It is now time to look at the last offense example, with this one a little more complex than the previous two.
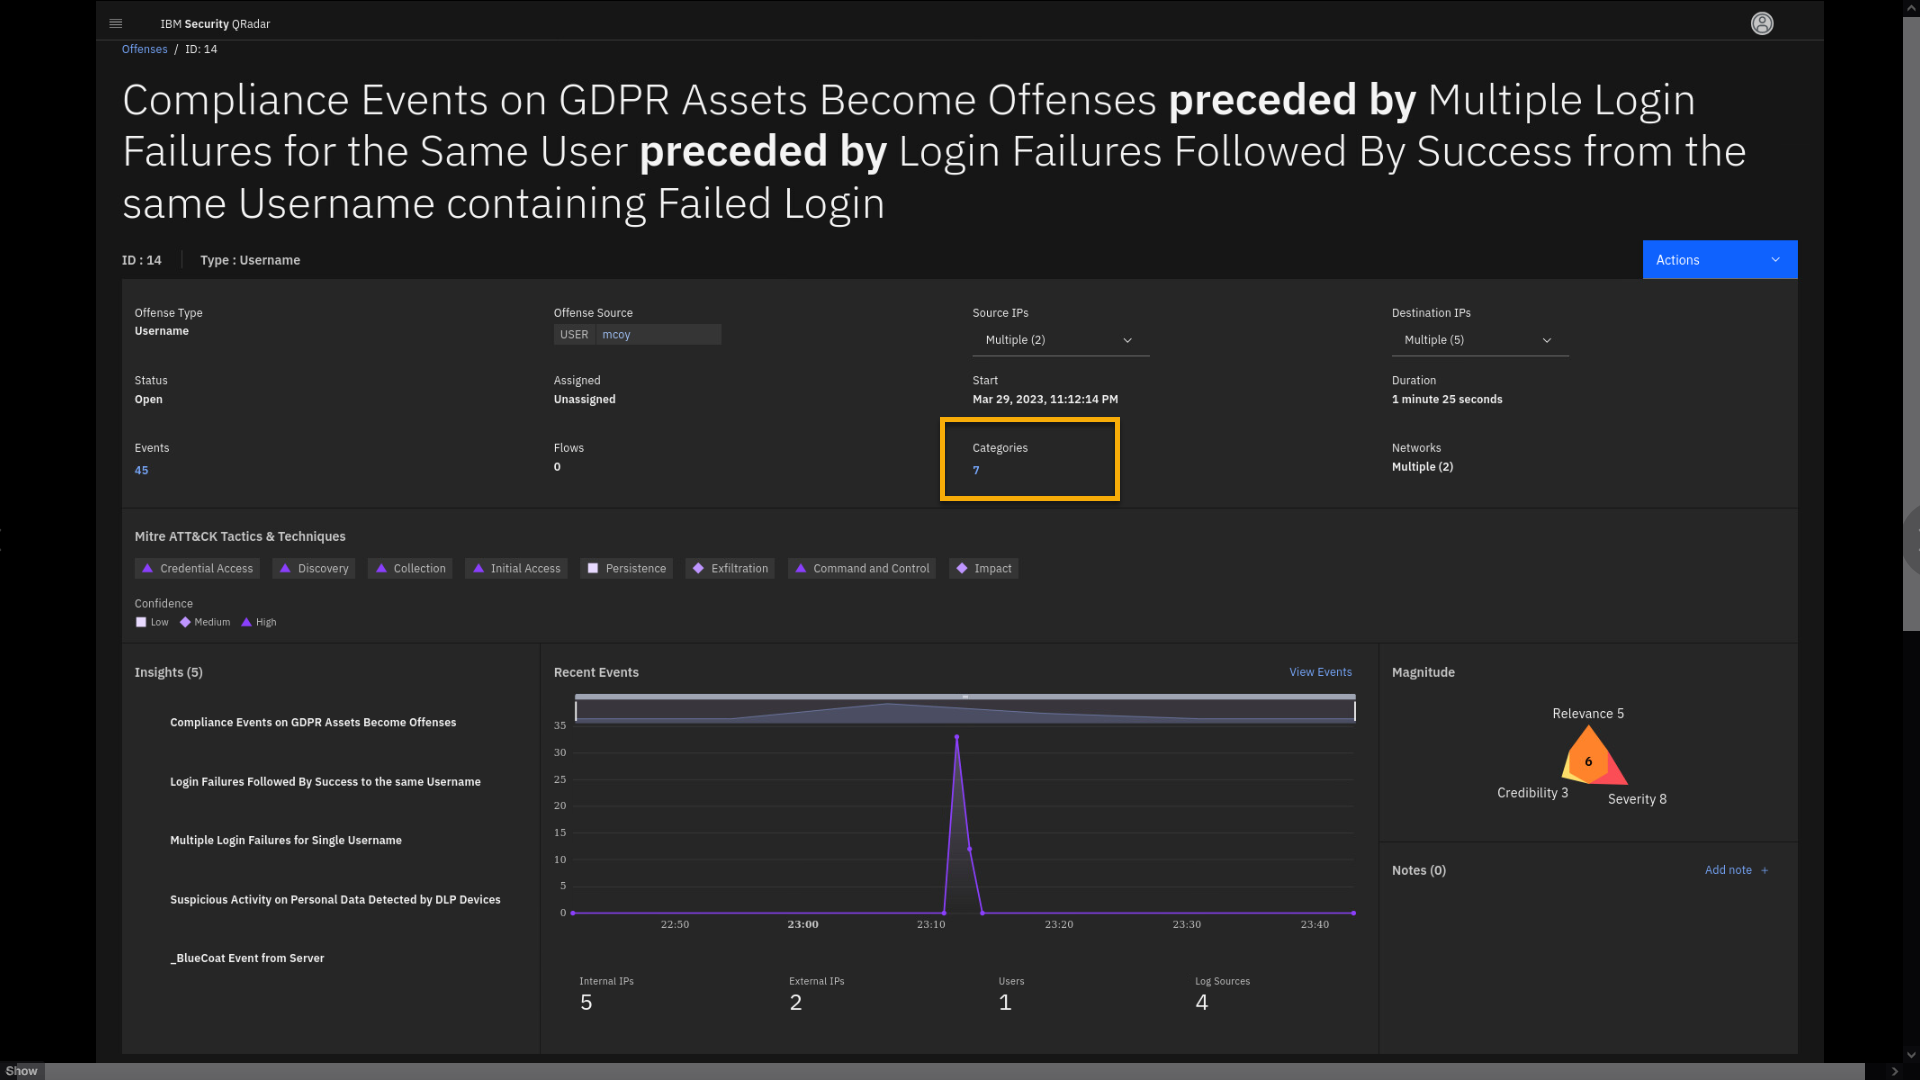
Offense 3 - Compliance Events on GDPR Assets... (Indexed by User mcoy)
Hint: If needed, apply again the Compliance filter to reduce
number of offenses at the screen.
General Data Protection Regulation (known as GDPR) is a regulation that requires organizations to protect the personal data and privacy of European Union (EU) citizens, and non-compliance can result in significant fines.
Technical safeguards, such as Data Loss Prevention (DLP) technology, help in preventing a breach. You can pair your QRadar with your security
tools to notify you of specific policy alerts that you have deployed through other security technologies such as IBM Guardium, Imperva,Vormetric, and so on.Because organizations are held liable for the loss of any personal data they collect, layers of protection are added by incorporating DLP
controls within QRadar to identify and restrict the transmission of personal data outside the network.
Let's now closely look at and analyze one GDPR related offense.
Important: Be aware that there may be multiple similar Compliance
Events on GDPR asset offenses, but only one where the Offense Source is
the user mcoy. Use that one for this lab and demos.
-
From the offense page, filtered by Compliance related events, click
the Compliance Events on GDPR Ass... offense that displays the
user mcoy as the Offense Source.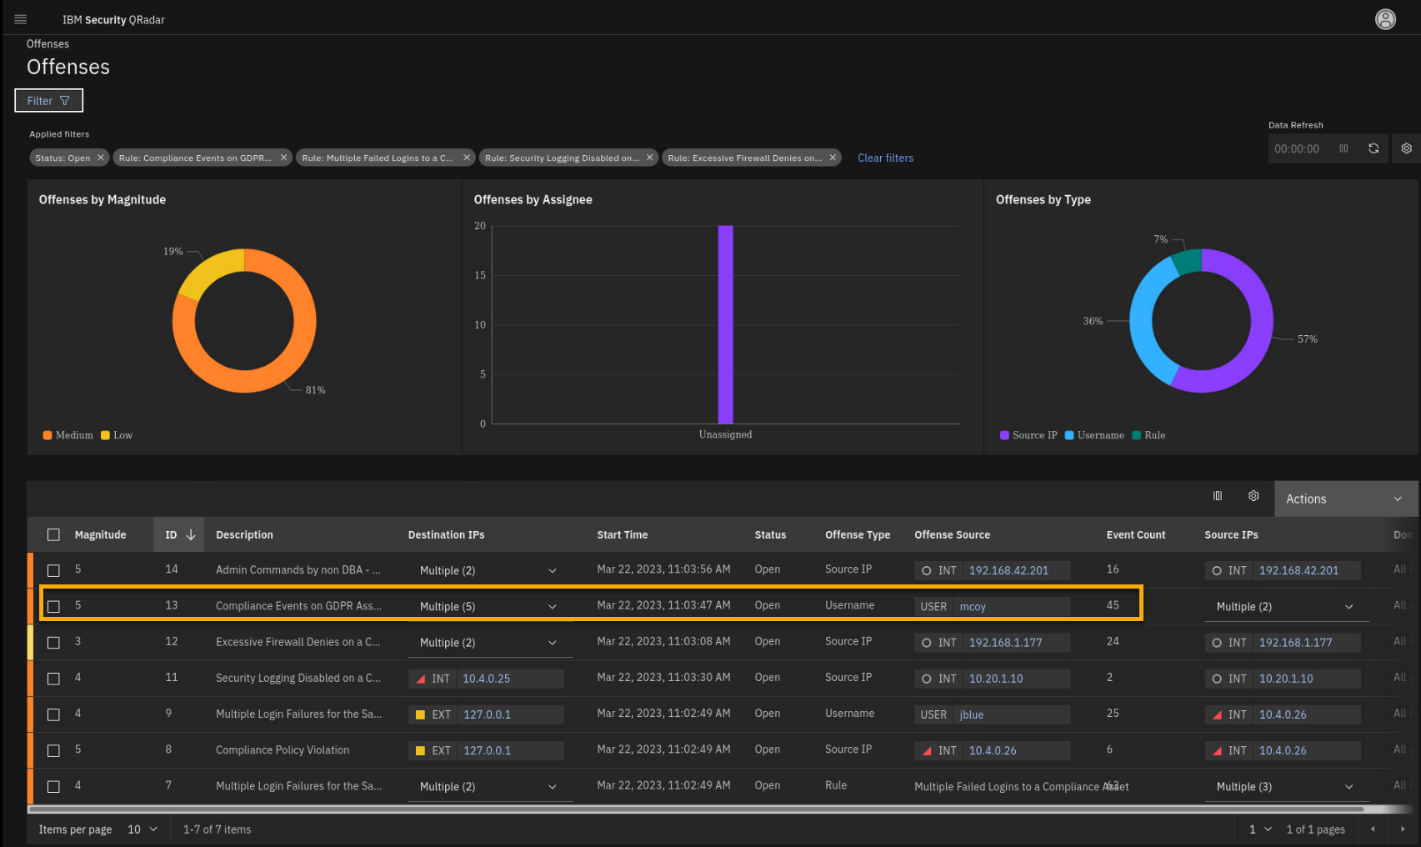
-
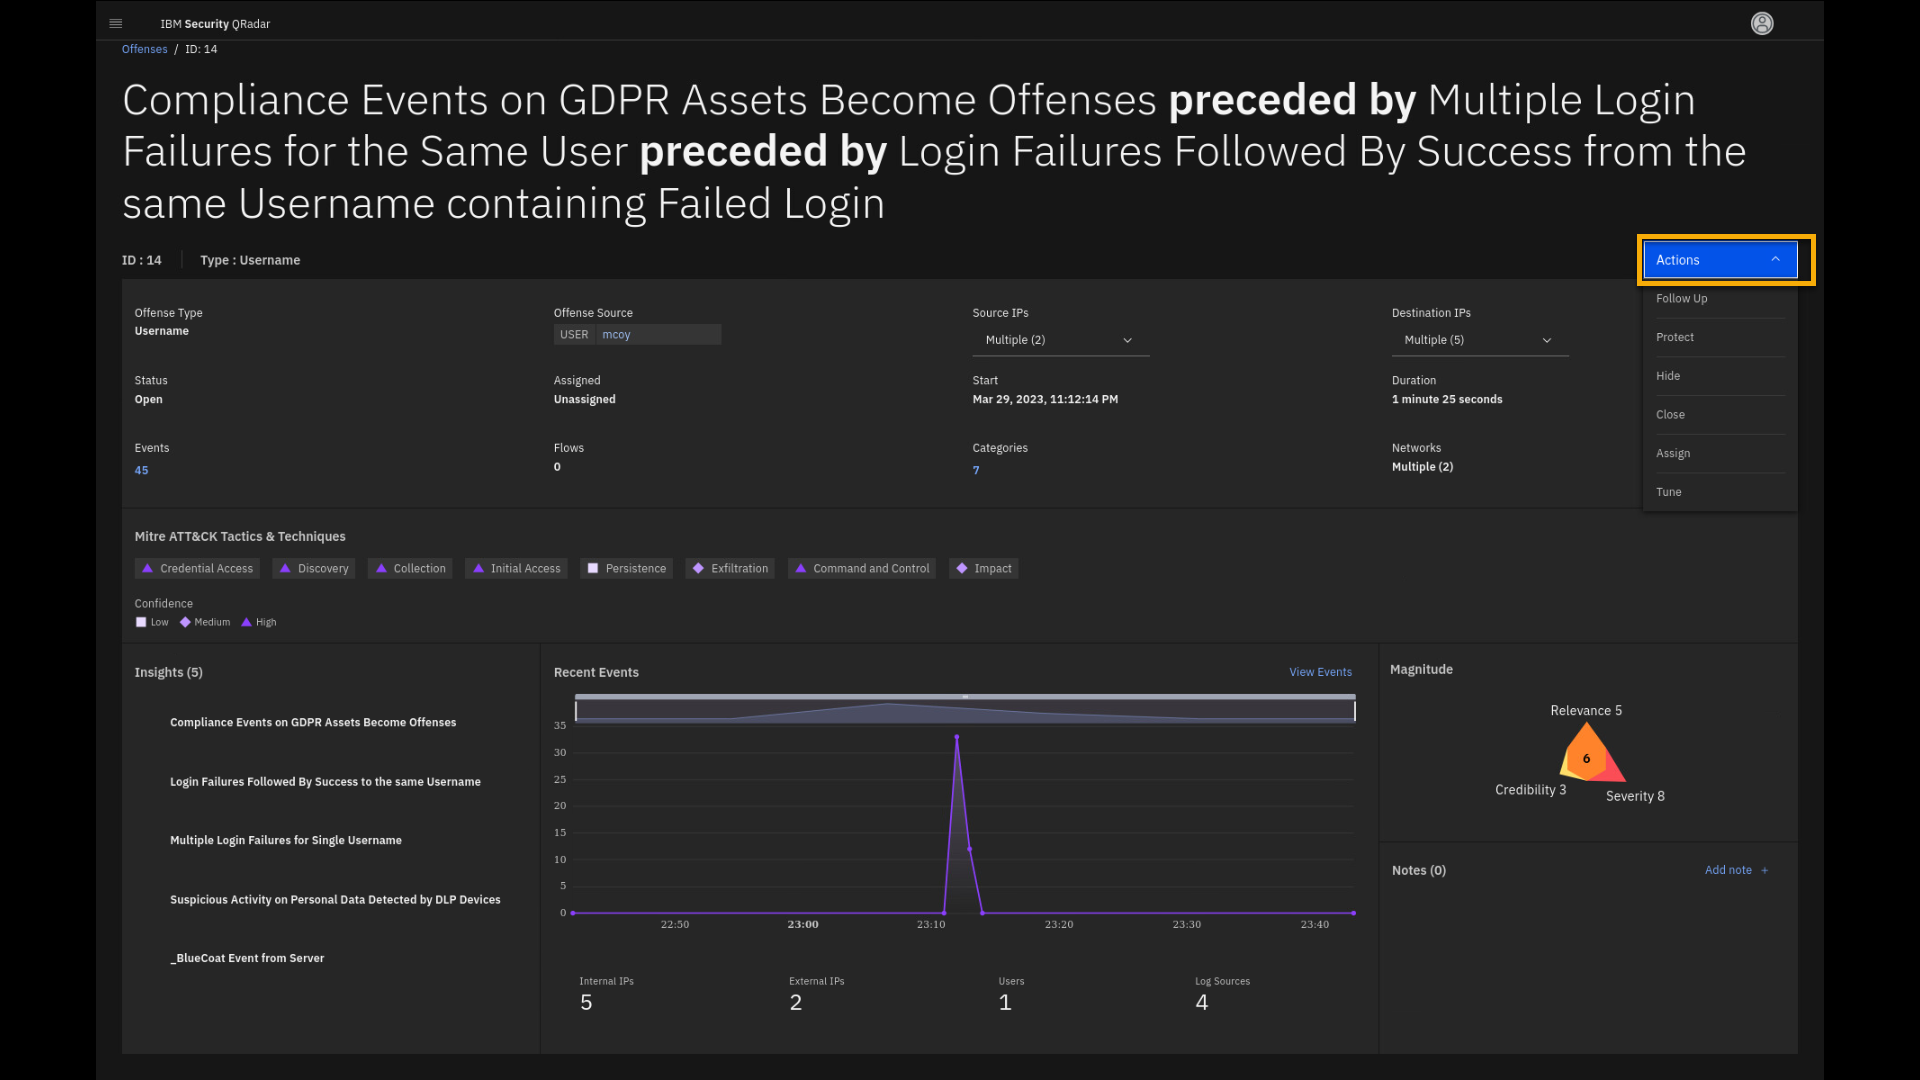
In the offense details page, click the ellipsis to see the full
name of the offense.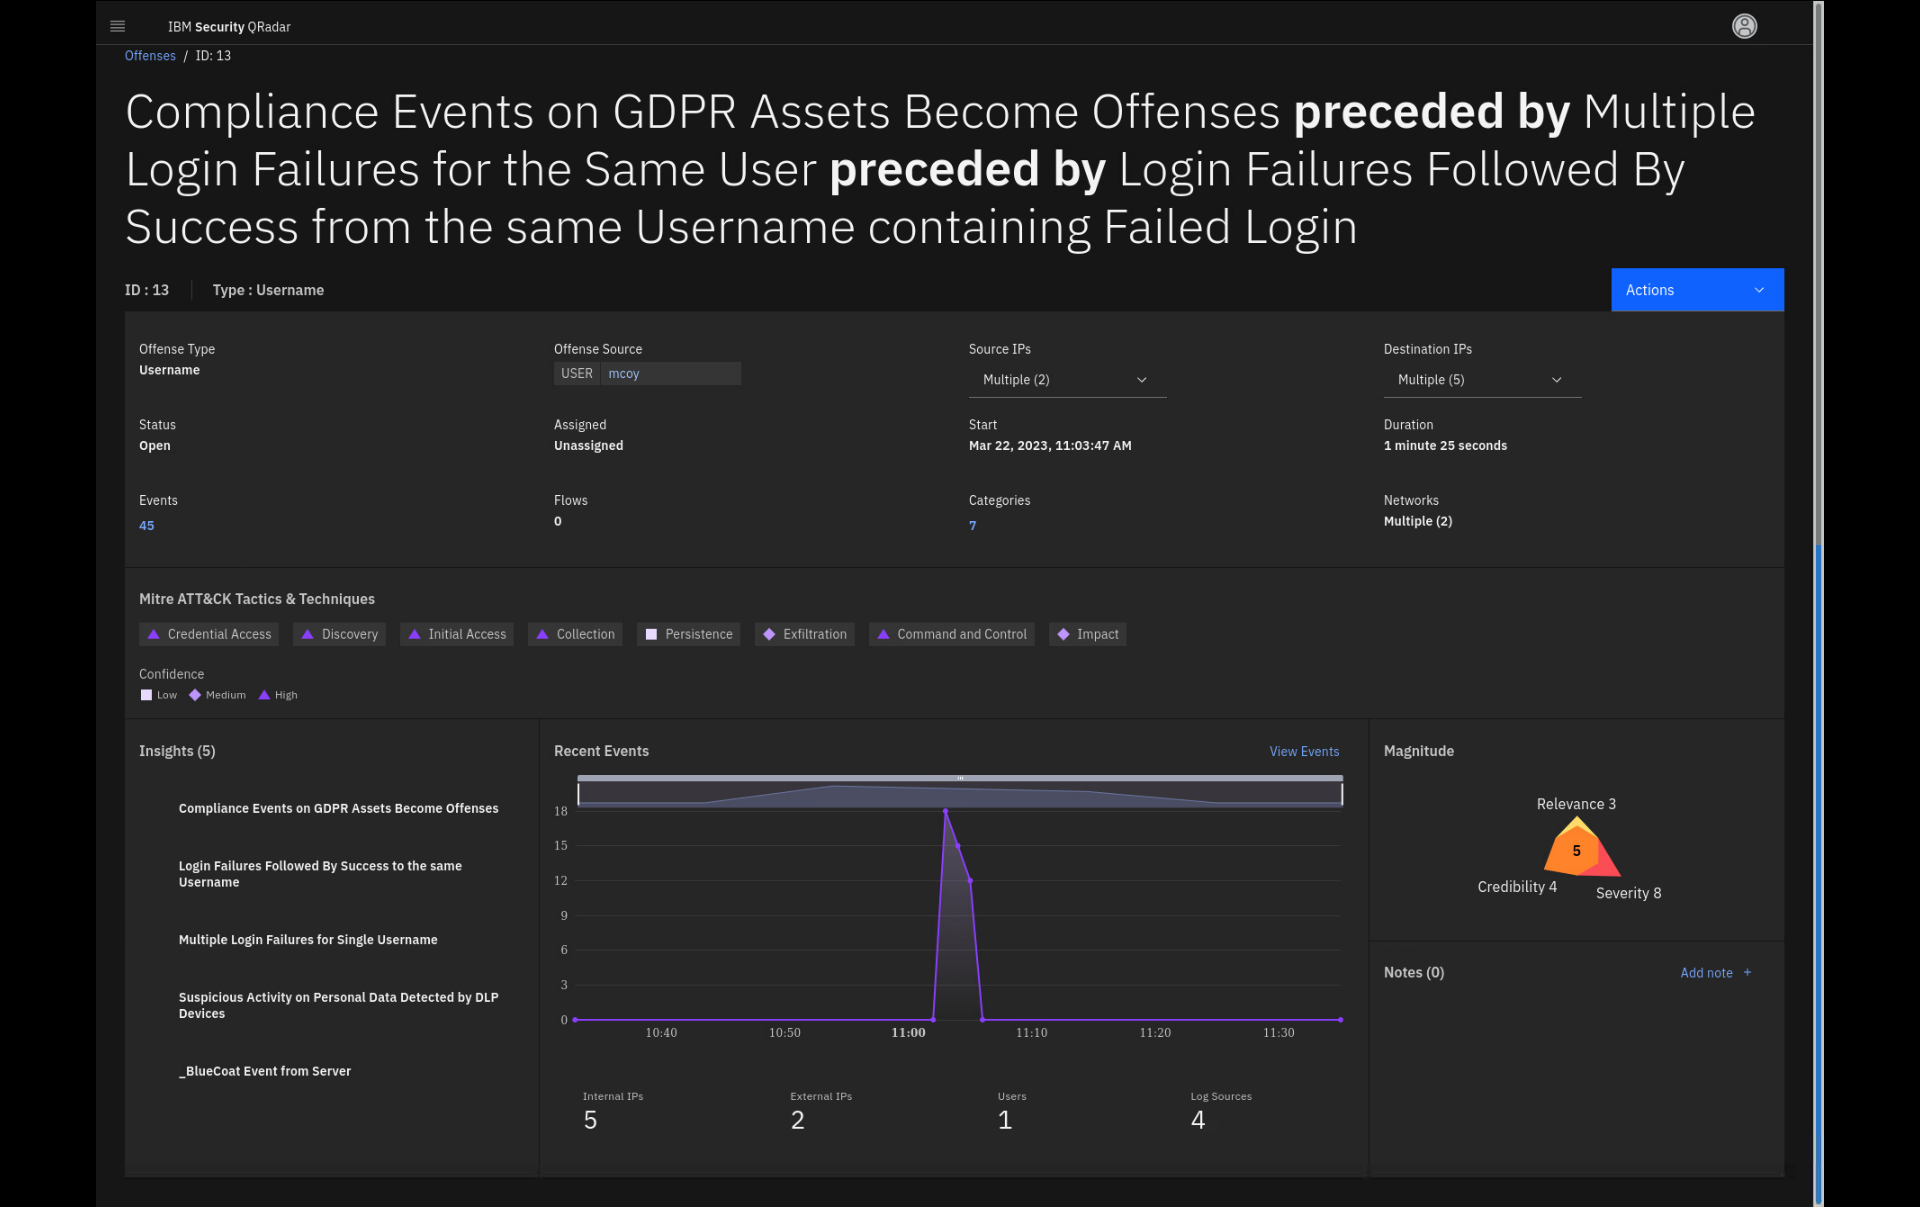
Note that the name of this offense is very long. That is due to the
offense chaining feature combining multiple insights contributing
to the offense using the same index. Those insights are linked or
chained by using the proceed by keyword.Before we dive into the insights of this offense, let's examine the
upper part of the page, where you can find offense summary data.The Offense Type tells you about the root information that was used to
collect data. We also call that parameter the offense index. The two
most common offense types are Source IP, Destination IP and Username.This offense is indexed by username.
-
Click the Offense Source USER mcoy.
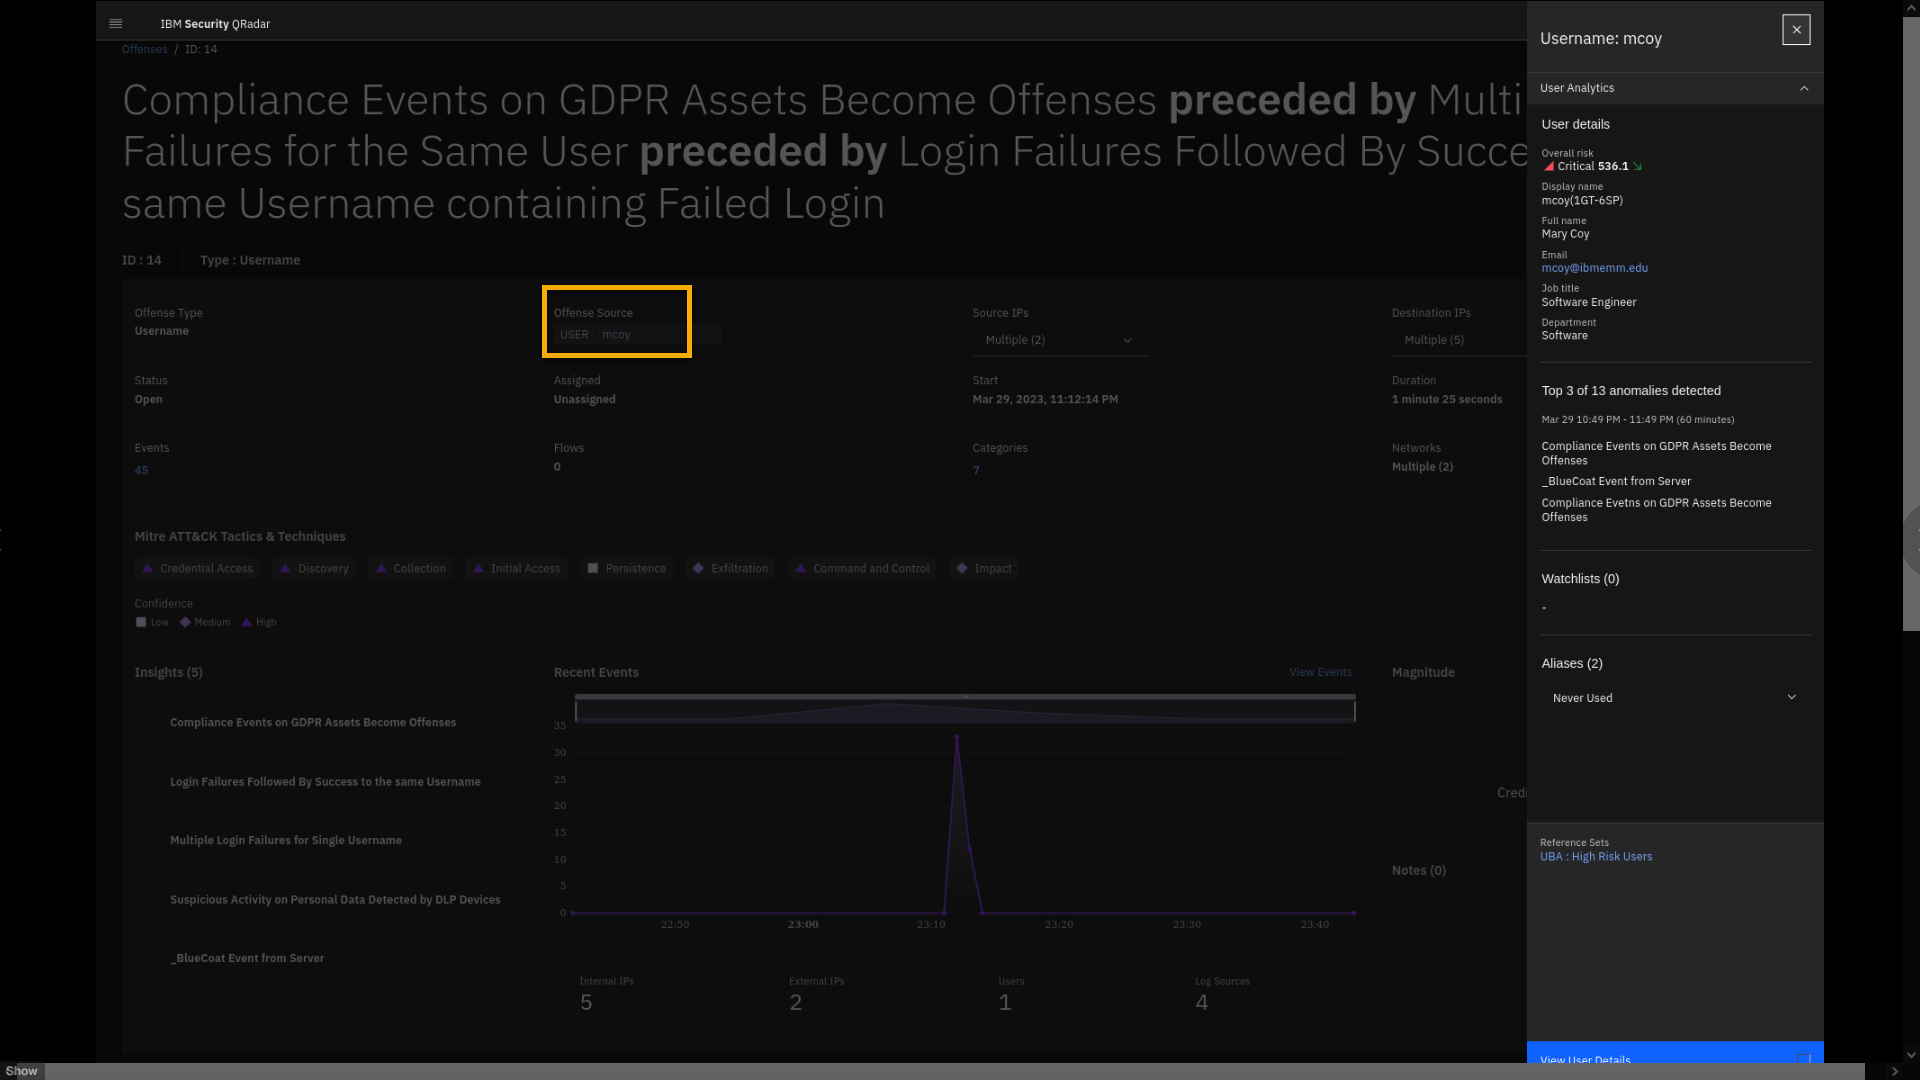
When you open the details pane for the Offense Source or username, you
might get additional information about that user, which then leads you
to drill down into the User Behavior Analytics (UBA) app. We will
discuss the UBA app in more detail a bit later. -
Close the User details side pane and return to the offense details
page. -
Expand the Source IP and Destination IP addresses.
Besides the offense being indexed on username, the offense collects all
internal and external Source and Destination IP addresses from the logs
(and flows) contributing to the offense.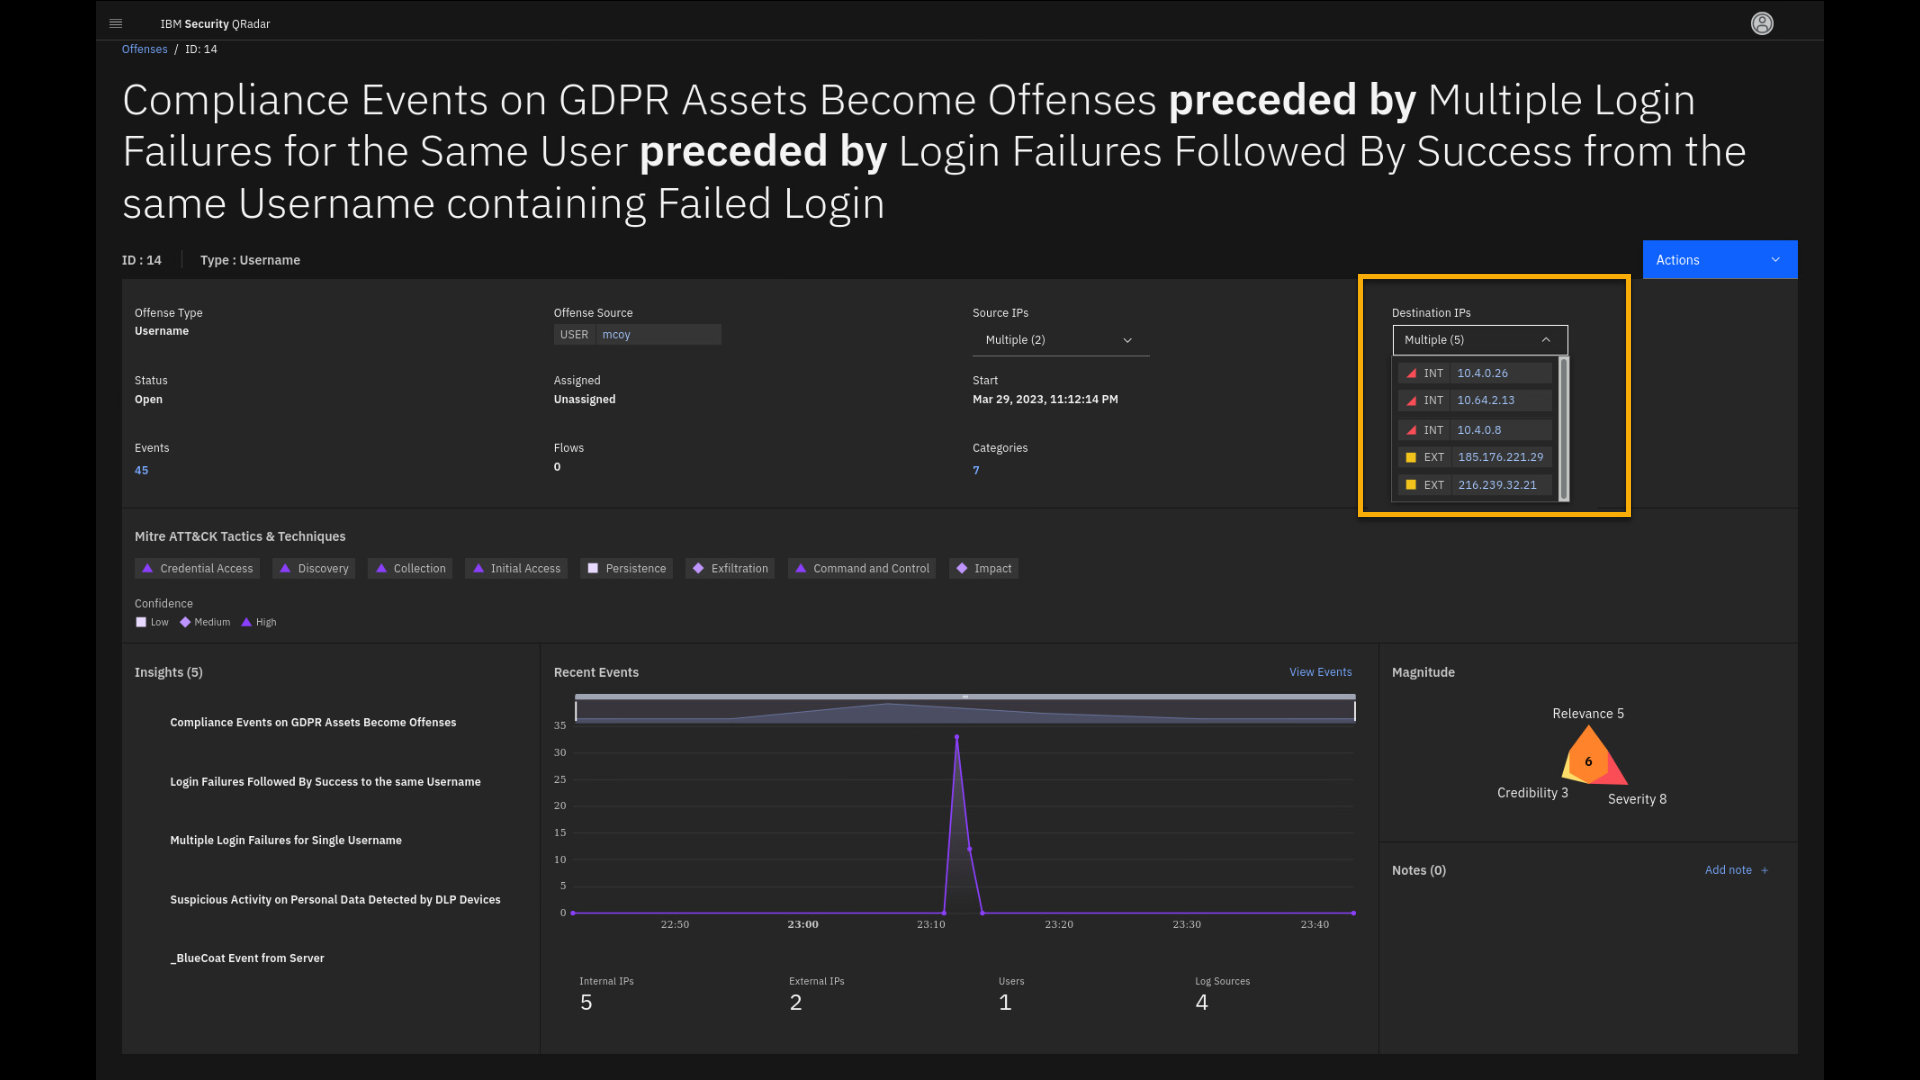
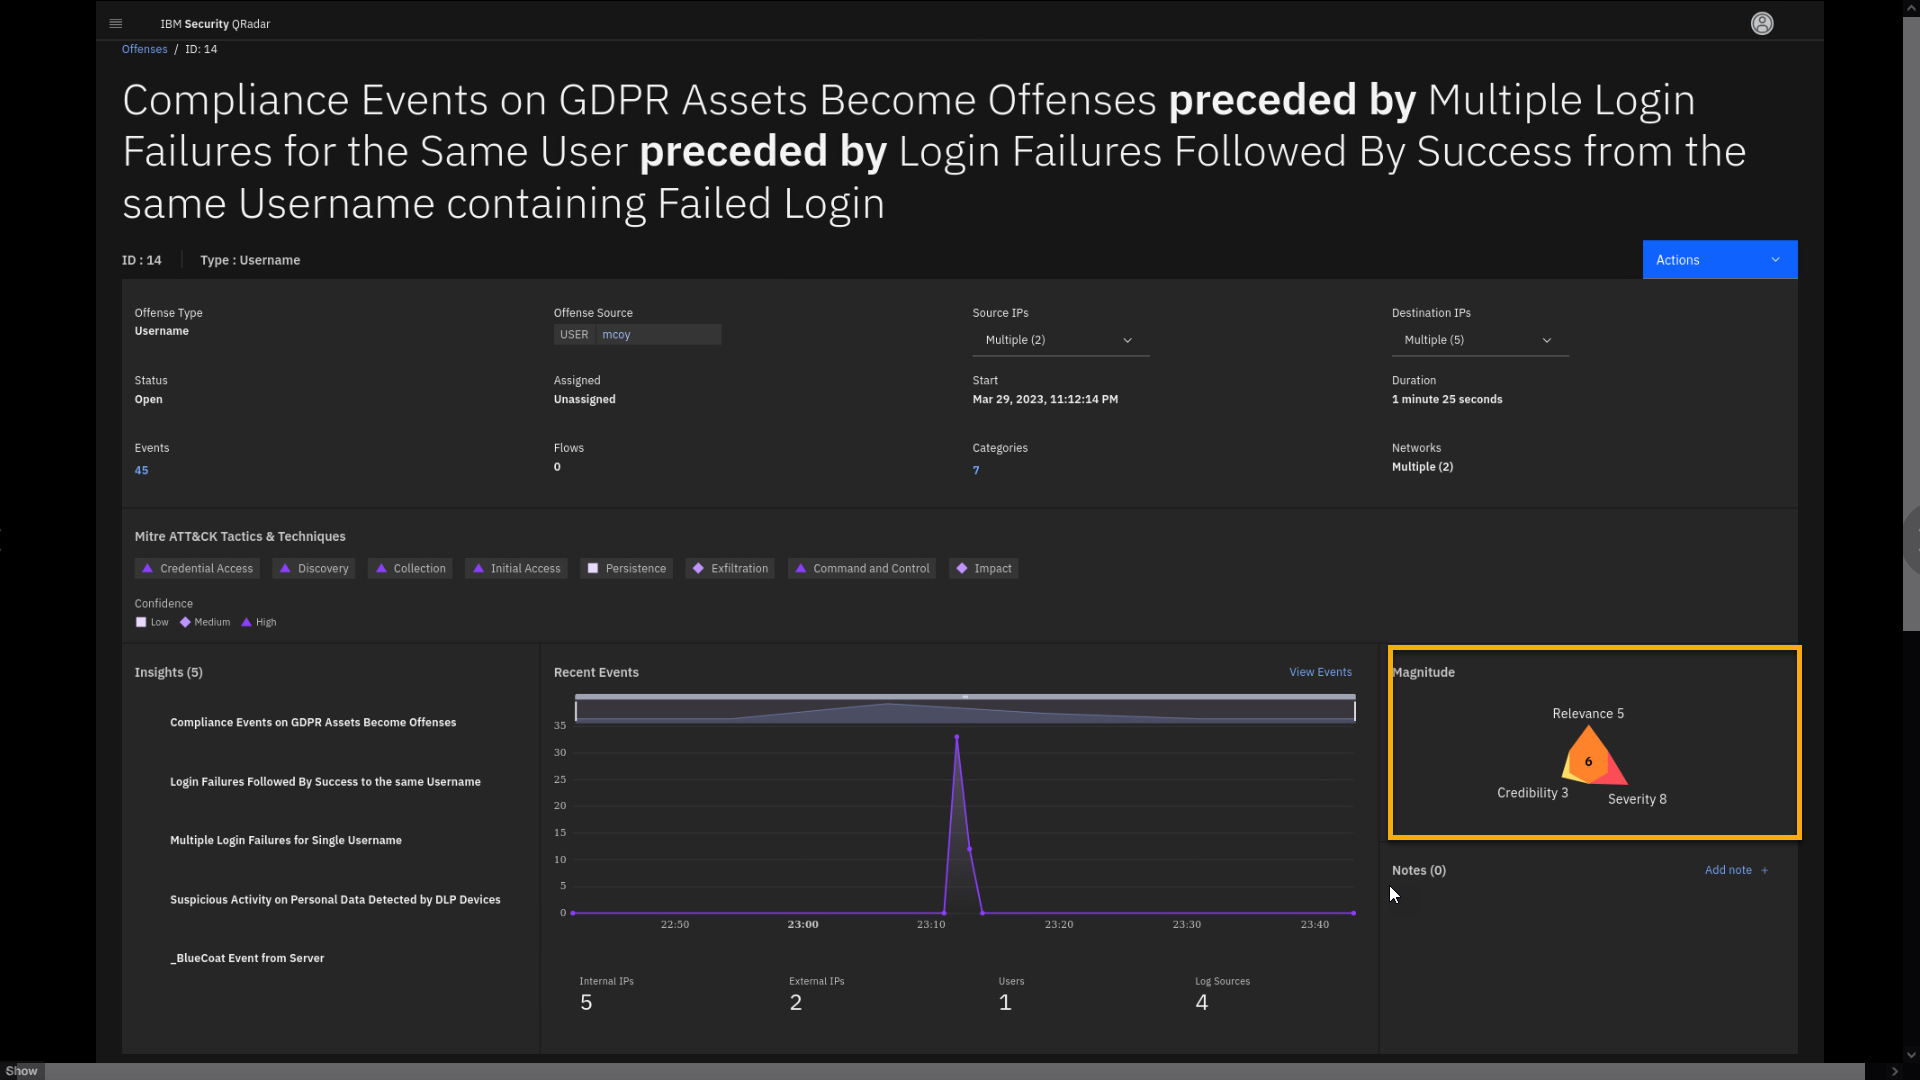
The next important detail we want to investigate is the magnitude of the
offense. -
Click the Magnitude region.
-
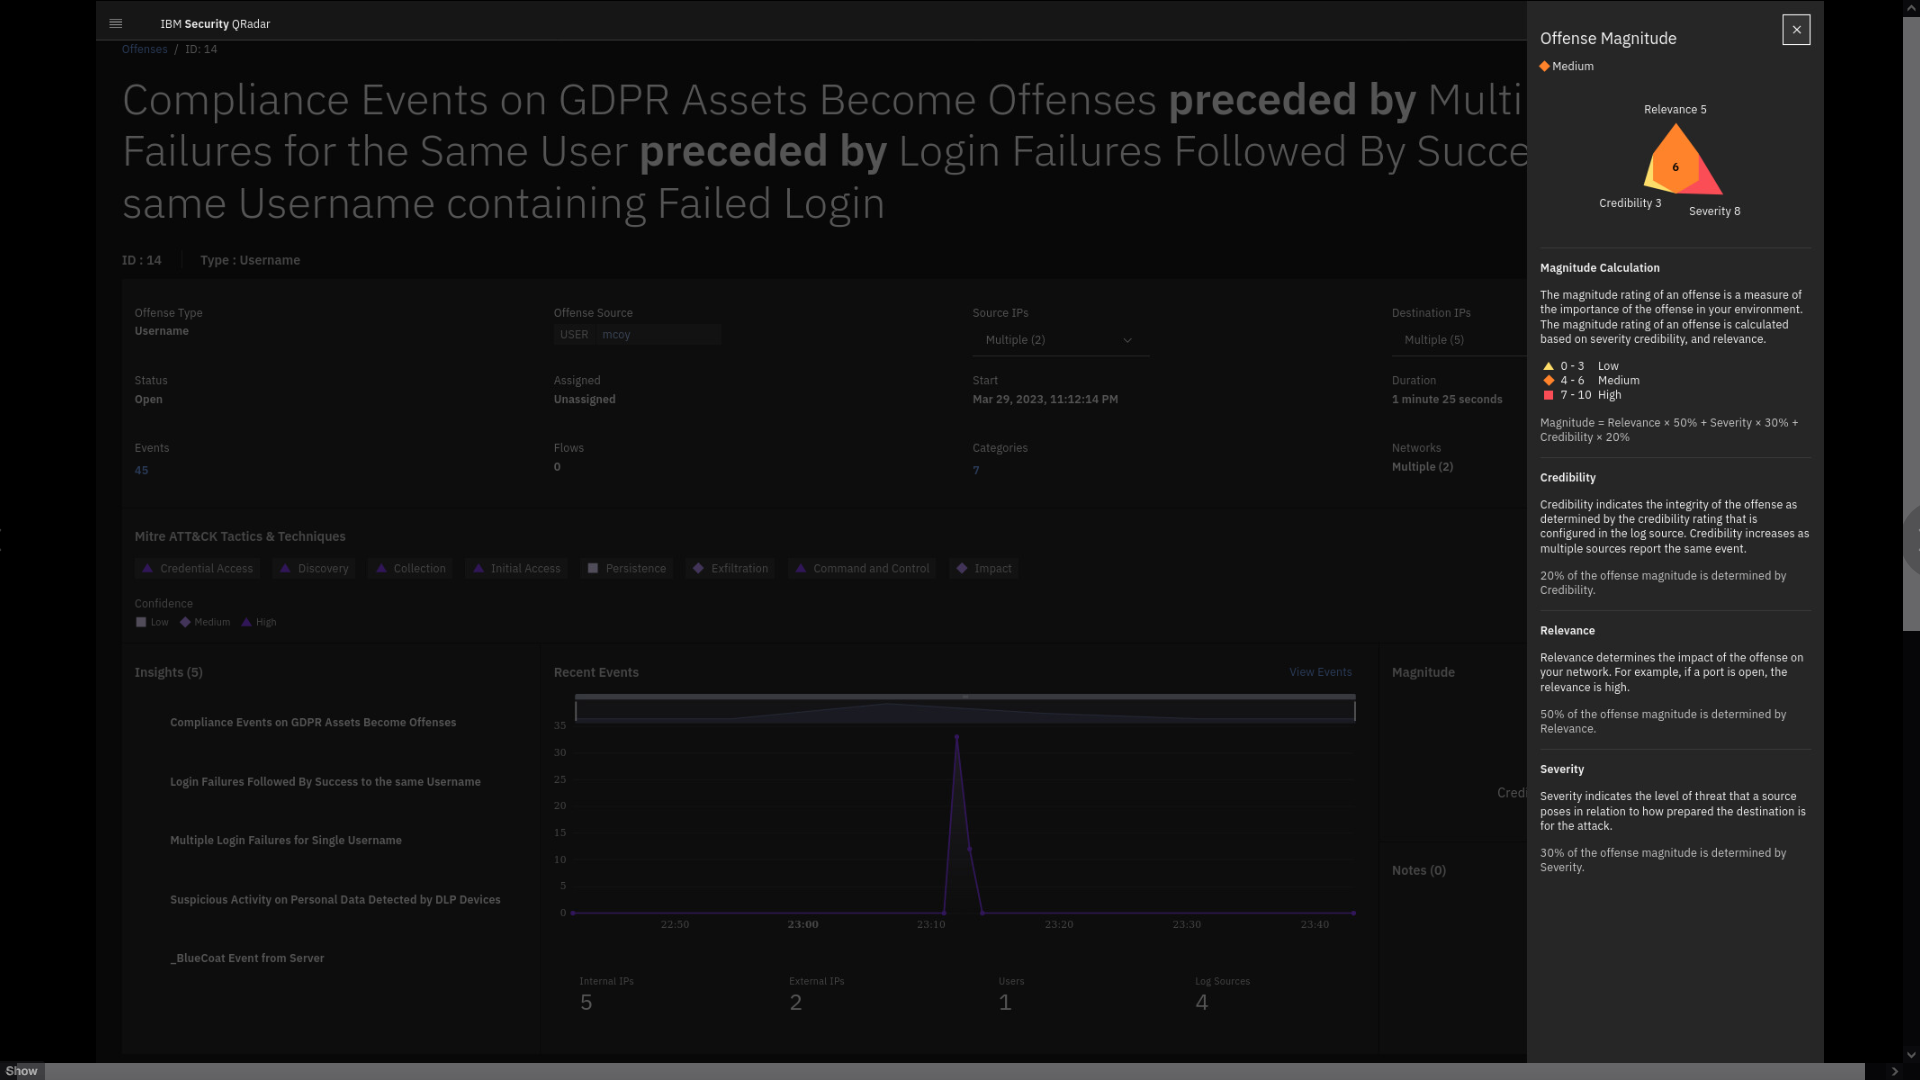
Review the Offense Magnitude side pane.
This will be on the quiz
The magnitude provides a score on how bad the issue is associated with
the offense. The magnitude is calculated based on the relevance and
severity of the events contributing to the offense, as well as the
credibility, which depends on a level assigned to the log source that
processes the event. For example, the credibility of IBM Security
Guardium logs might be considered higher than logs from a web server
that does not handle personally identifiable information (PII).Note the formula displayed on the screen that shows how the magnitude is
calculated.RELEVANCE x 50% + SEVERITY x 30% + CREDIBILITY x 20%
Note that the magnitude score decreases over time. This is sensible because the older the offense is, the less relevant it becomes. The magnitude score ranges between 0 and 10. The higher the score, the more urgently the offense is in need of analysis for potential security issues.
-
Close the Offense Magnitude pane and return the offense summary
screen.Observe that offense includes multiple source and destination IP
addresses relevant to mcoy activity. Also, QRadar reports on MITRE
ATT&CK tactics and techniques observed in this offense. It can also be
relevant for the analyst to observe the event categories that
contributed to this offense. -
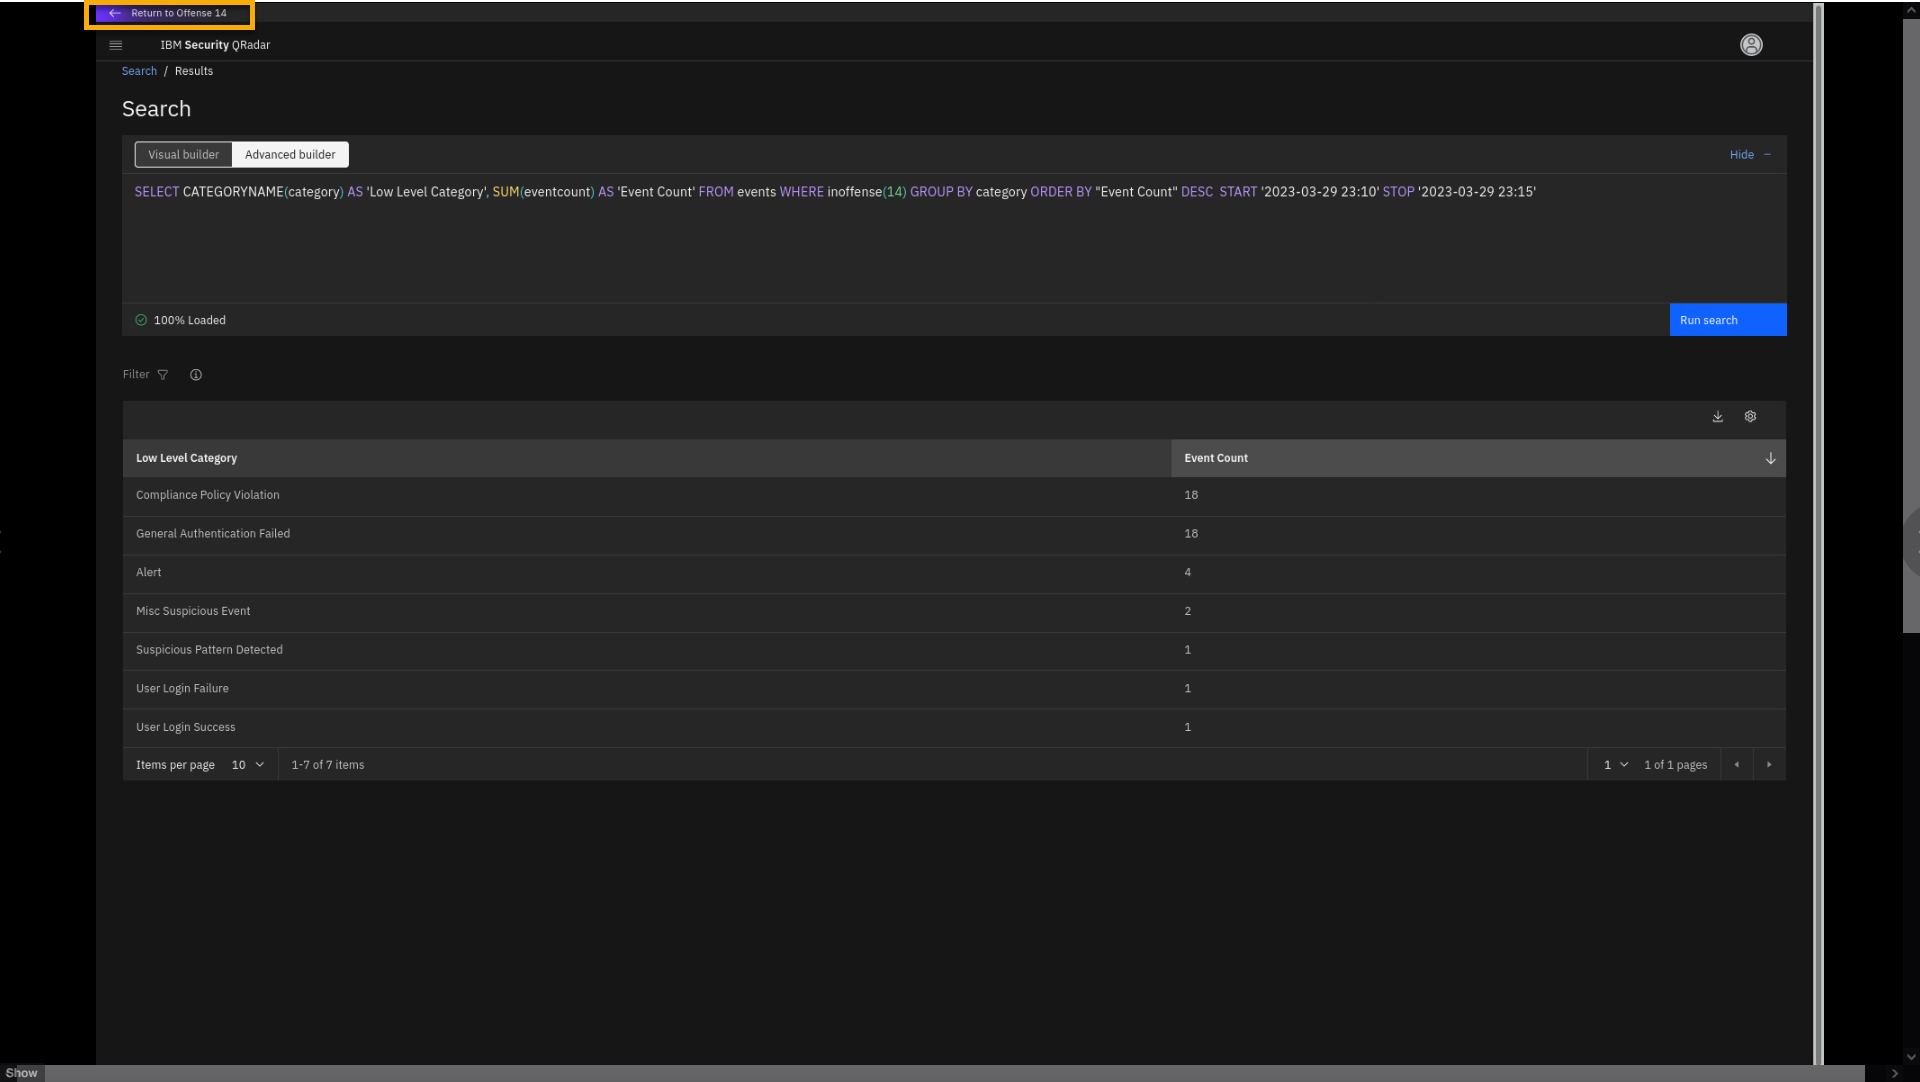
From the offense details page, click the number of events in the Categories.
QRadar uses event categories to group incoming events for processing.
The event categories are searchable and help you monitor your network.
Each event that occurs on your network has associated high-level and
low-level categories. Thus, the events are aggregated and can be
searched by those categories. -
Review the search results.
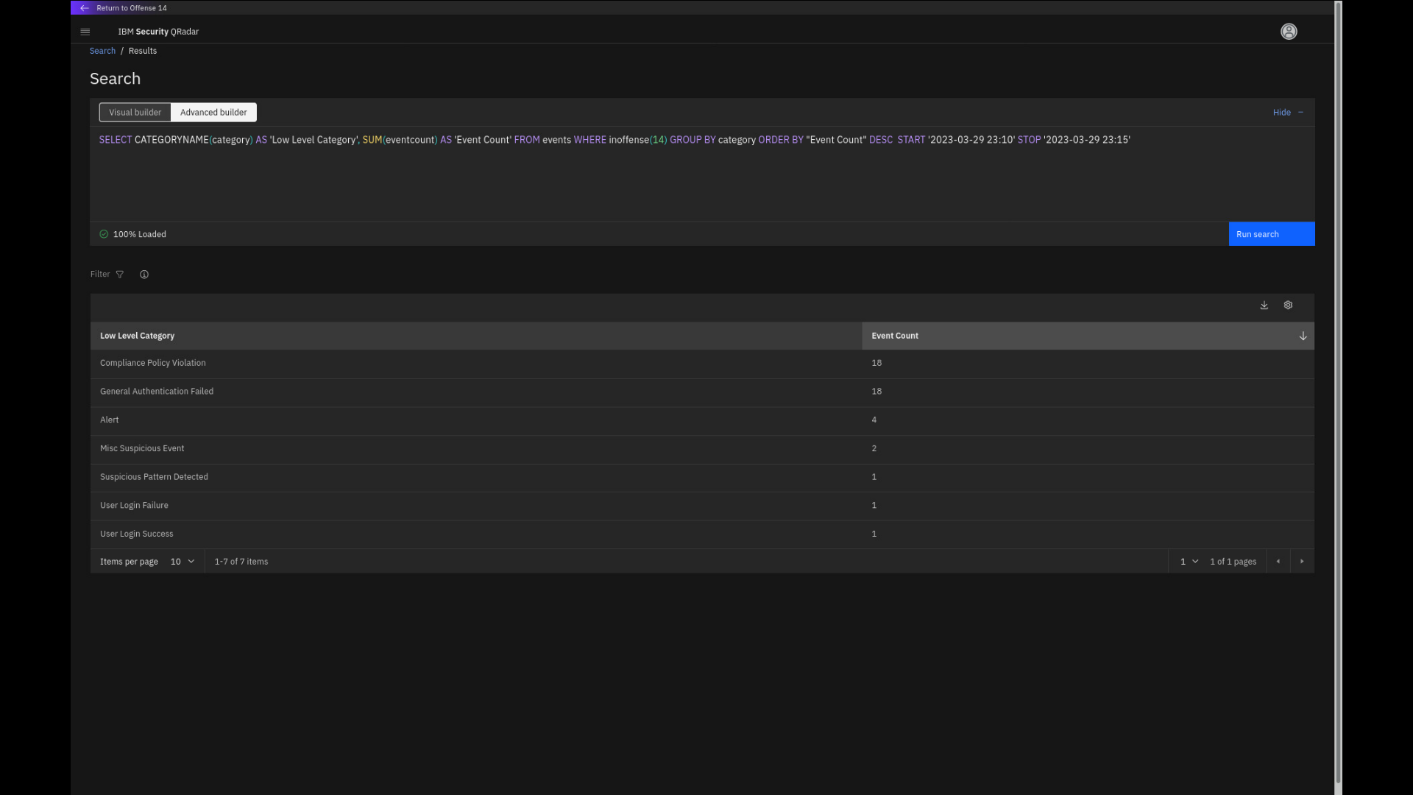
When you examine the Low Level Categories that contributed to this
offense, note that the single event in the User Login Success
category indicates an urgency to immediately investigate this offense in
more detail, especially with the context of the high amount of prior
chained General Authentication Failed category events. -
To close the Events Categories list, click Return to Offense
<n>.Note: The offense number might vary.
Before we drill down into the events that contributed to this offense
and dig out all details about what has happened, let's analyze some
of the offense insights. -
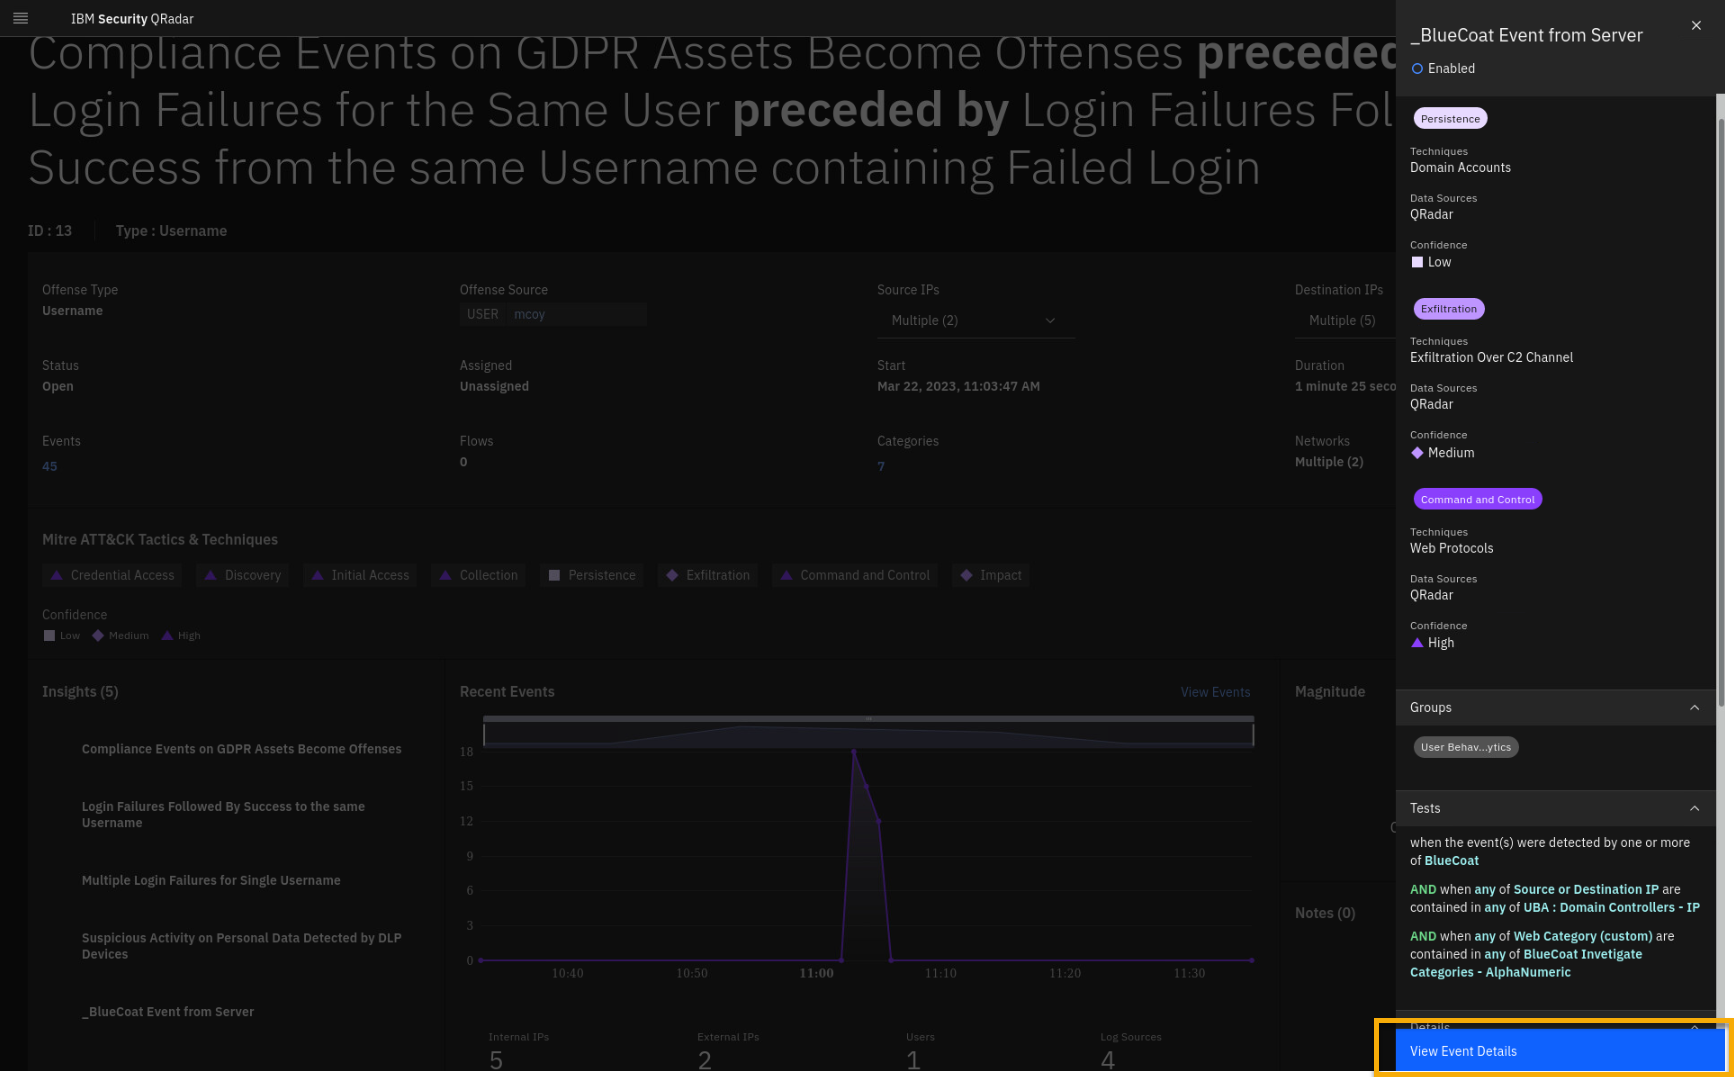
Click the _BlueCoat Event from Server insight.
By looking at the Tests definitions, you see that the insights are
triggering because network traffic is detected between the domain
controller and one or more web categories that have been flagged as
potentially malicious inside the BlueCoat Investigate Categories
reference set. To better understand what has happened, we must look at
the events associated with this insight. -
Click View Event Details.
-
Review the events associated with the BlueCoat log source.
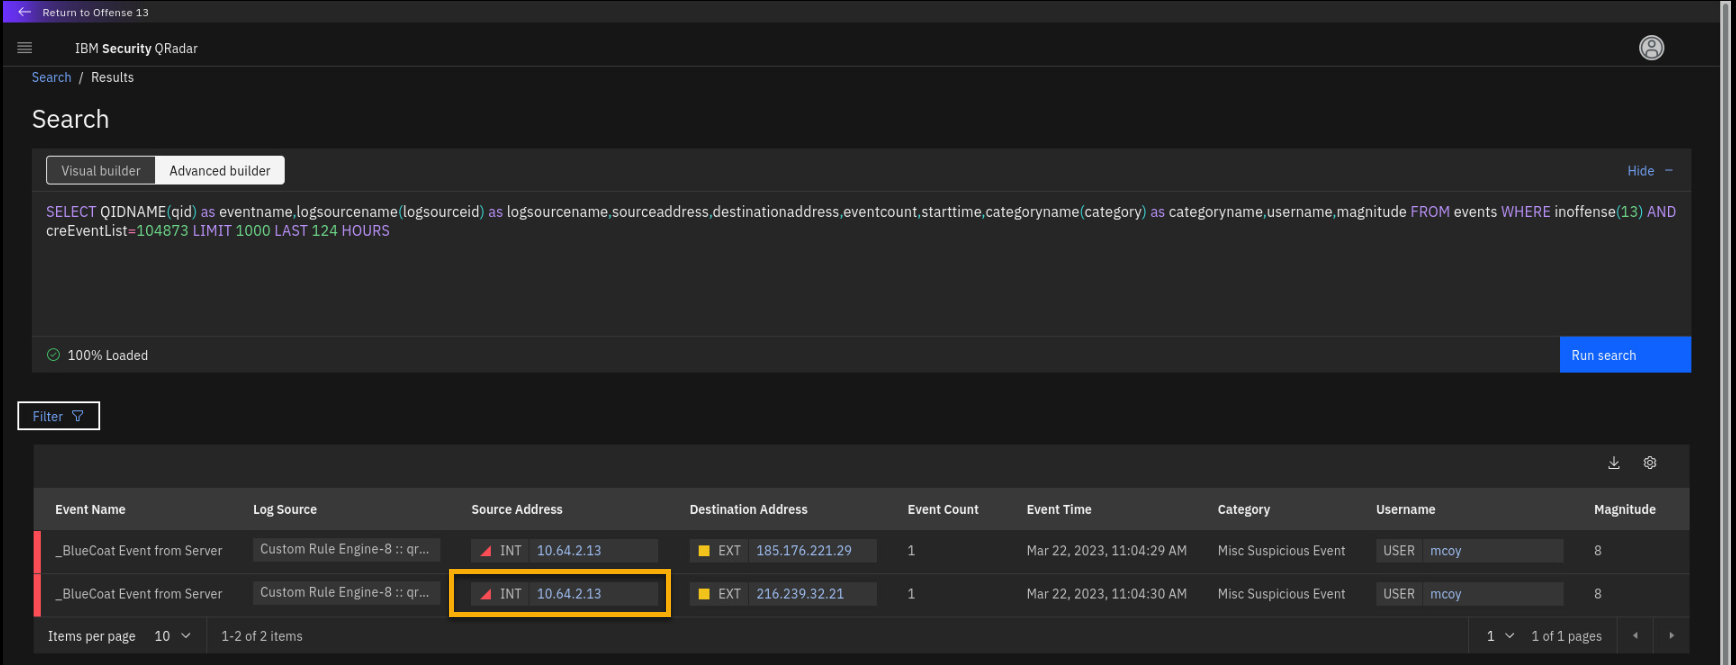
The events associated with the BlueCoat insight are pulled from QRadar
using the automatically formed AQL query. You can see that there are two
remote sites communicating with the internal IP address 10.64.2.13. -
Click the internal IP address 10.64.2.13.
-
Review the Domain Controller asset.
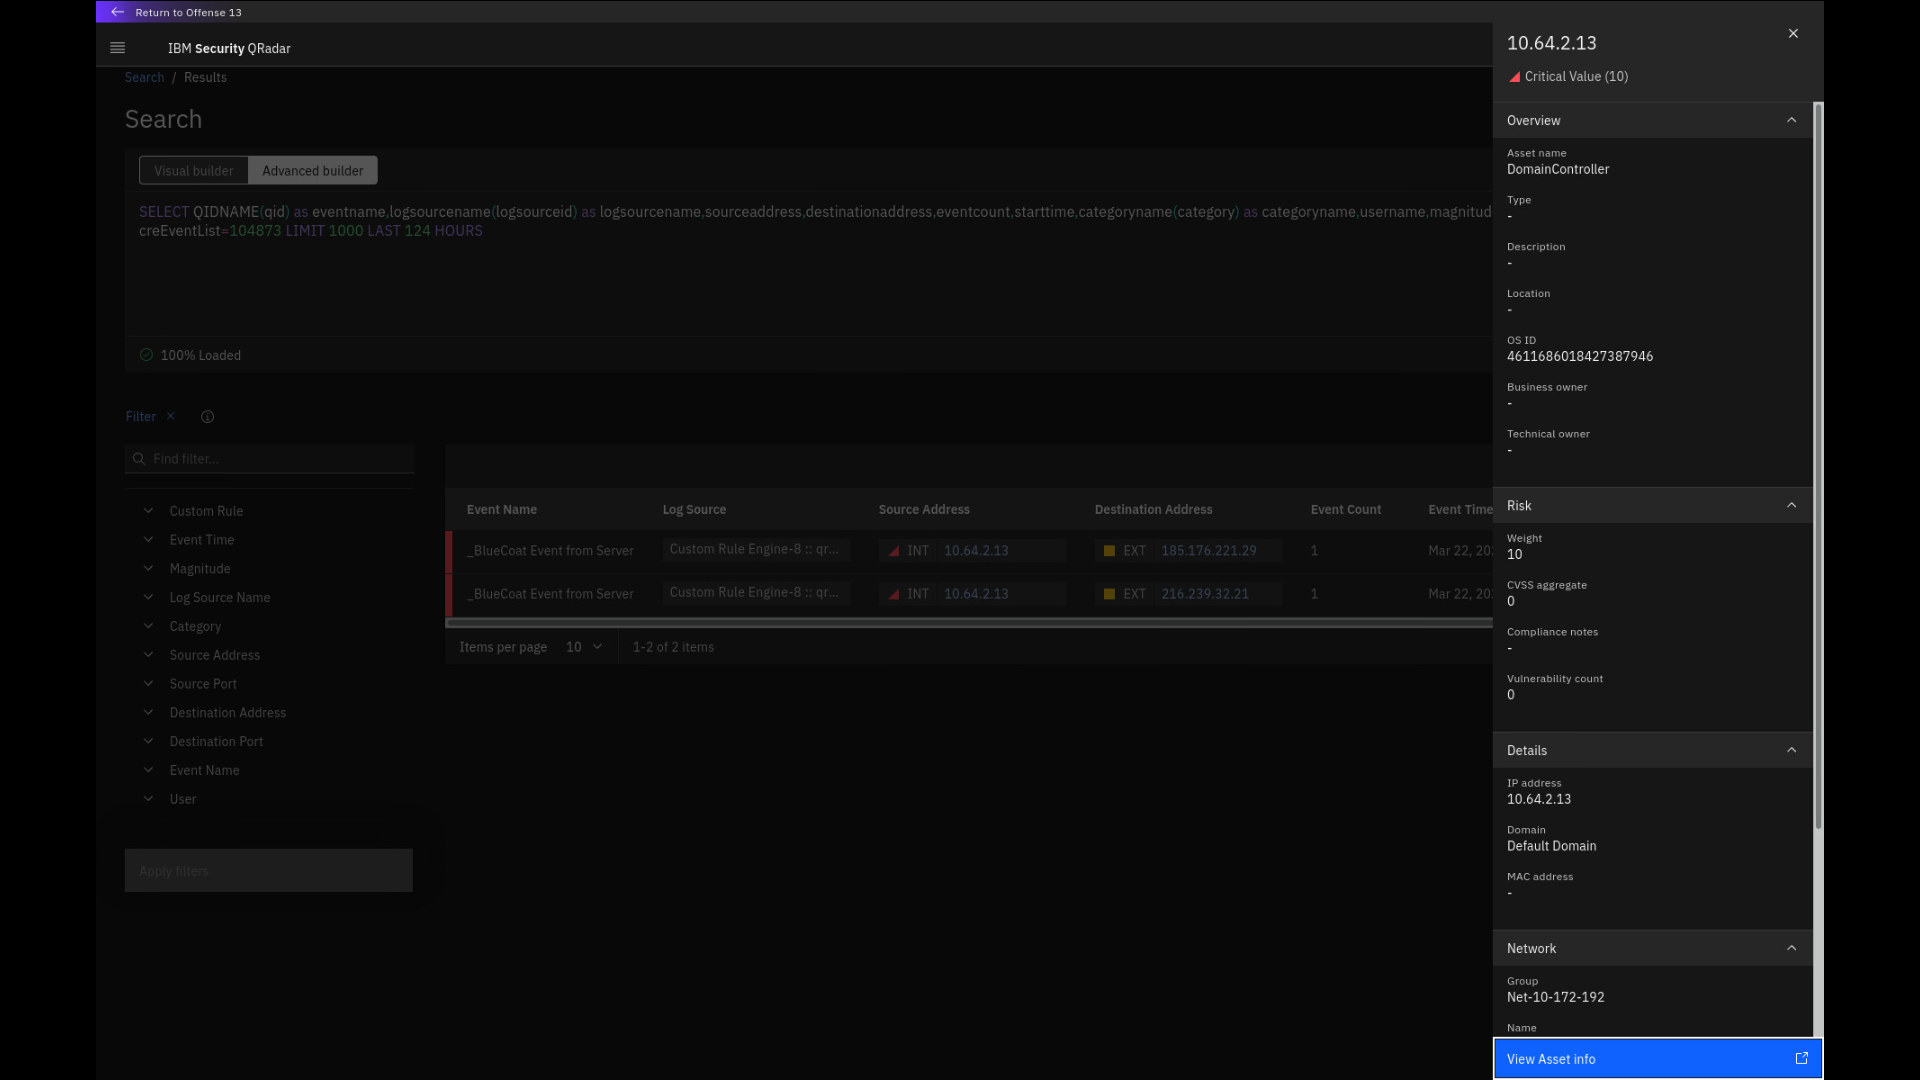
Note that the internal IP address is classified as Domain Controller and
has a risk weight of 10. A security analyst would know that there is no
plausible reason for direct interaction between external networks and a
domain controller. Next, let's look at one of the external IPs. -
Close the side asset panel and click the external IP
216.239.32.21.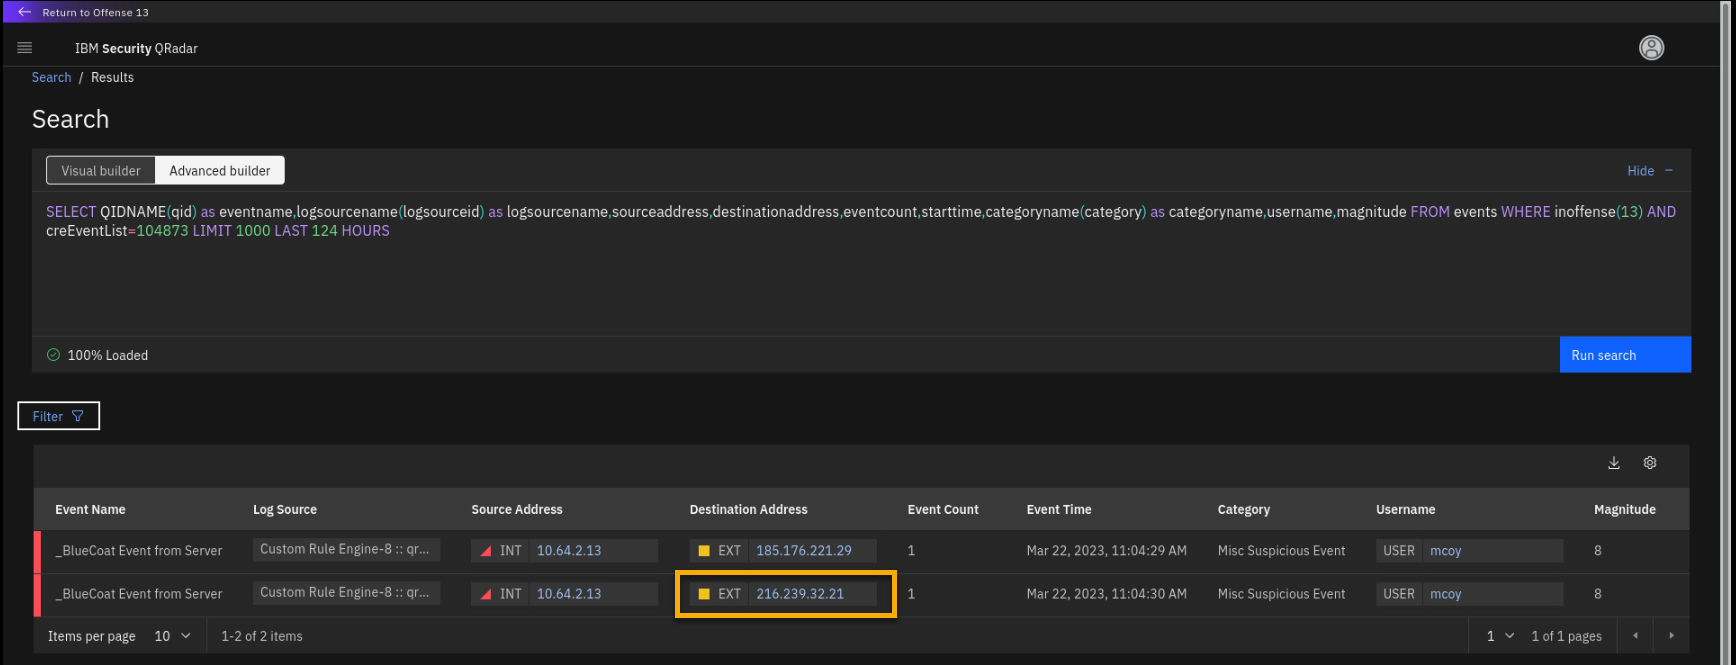
-
Review the IP address side panel.
Note that this IP address depicts a low X-Force risk score at this time.
This is real-time information pulled from the IBM X-Force Exchange
database. However, to investigate how this IP address was behaving over
the past, you can click View X-Force info. -
Click View X-Force info.

-
Review the X-Force Exchange page with the IP address historic data
that is presented in a new browser tab.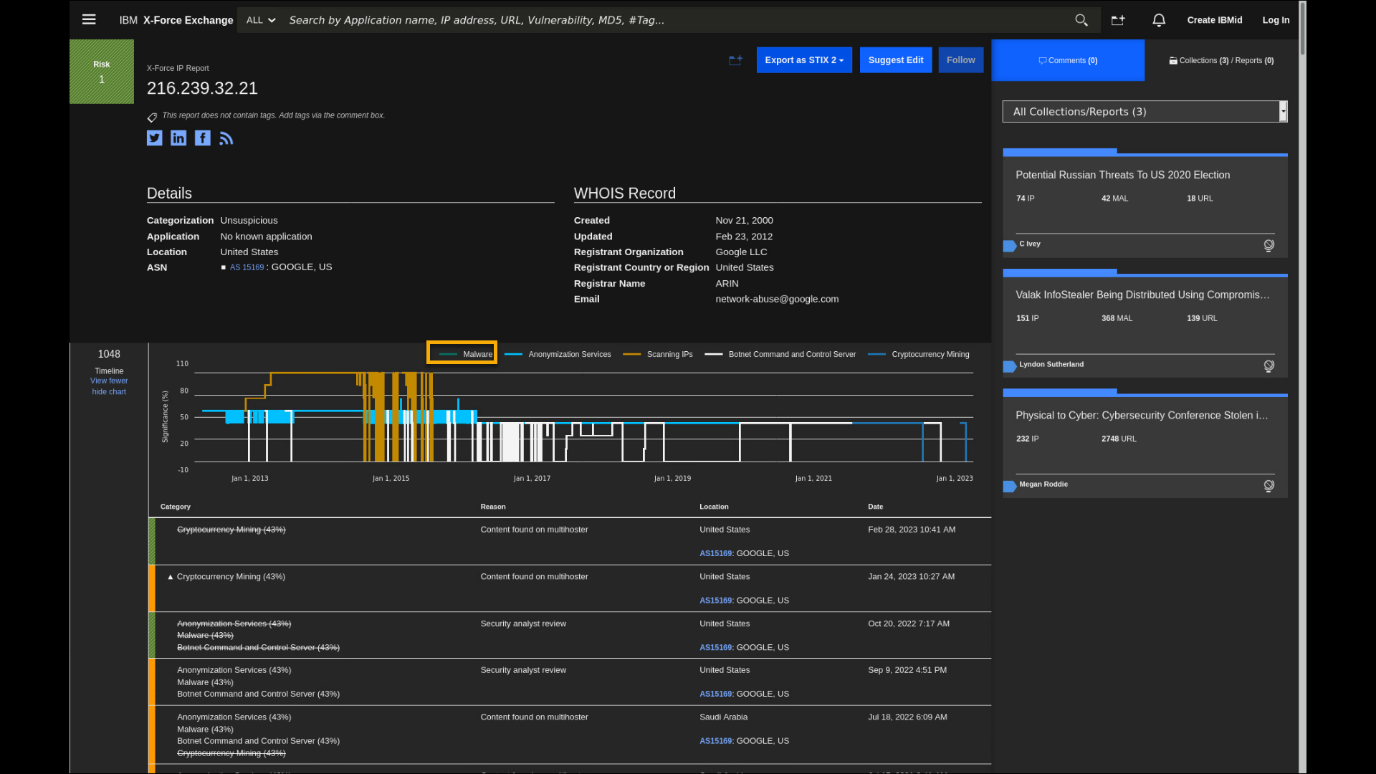
The X-Force Exchange database keeps historic records of malicious
activities in the public IP address space. Right now, this IP address is
clean, but back in time (when this demo was originally developed) we see the
IP address has multiple issues related to spam, botnet, and malware
activities. The IP address was also part of multiple collections that
were used to track different threat campaigns. All this data is
integrated with QRadar SIEM and can be used to improve detection and
investigation of malicious activities. -
Close the X-Force Exchange window and the IP address side panel.
-
From the search page, go back to the offense by clicking Return to
Offense <n>.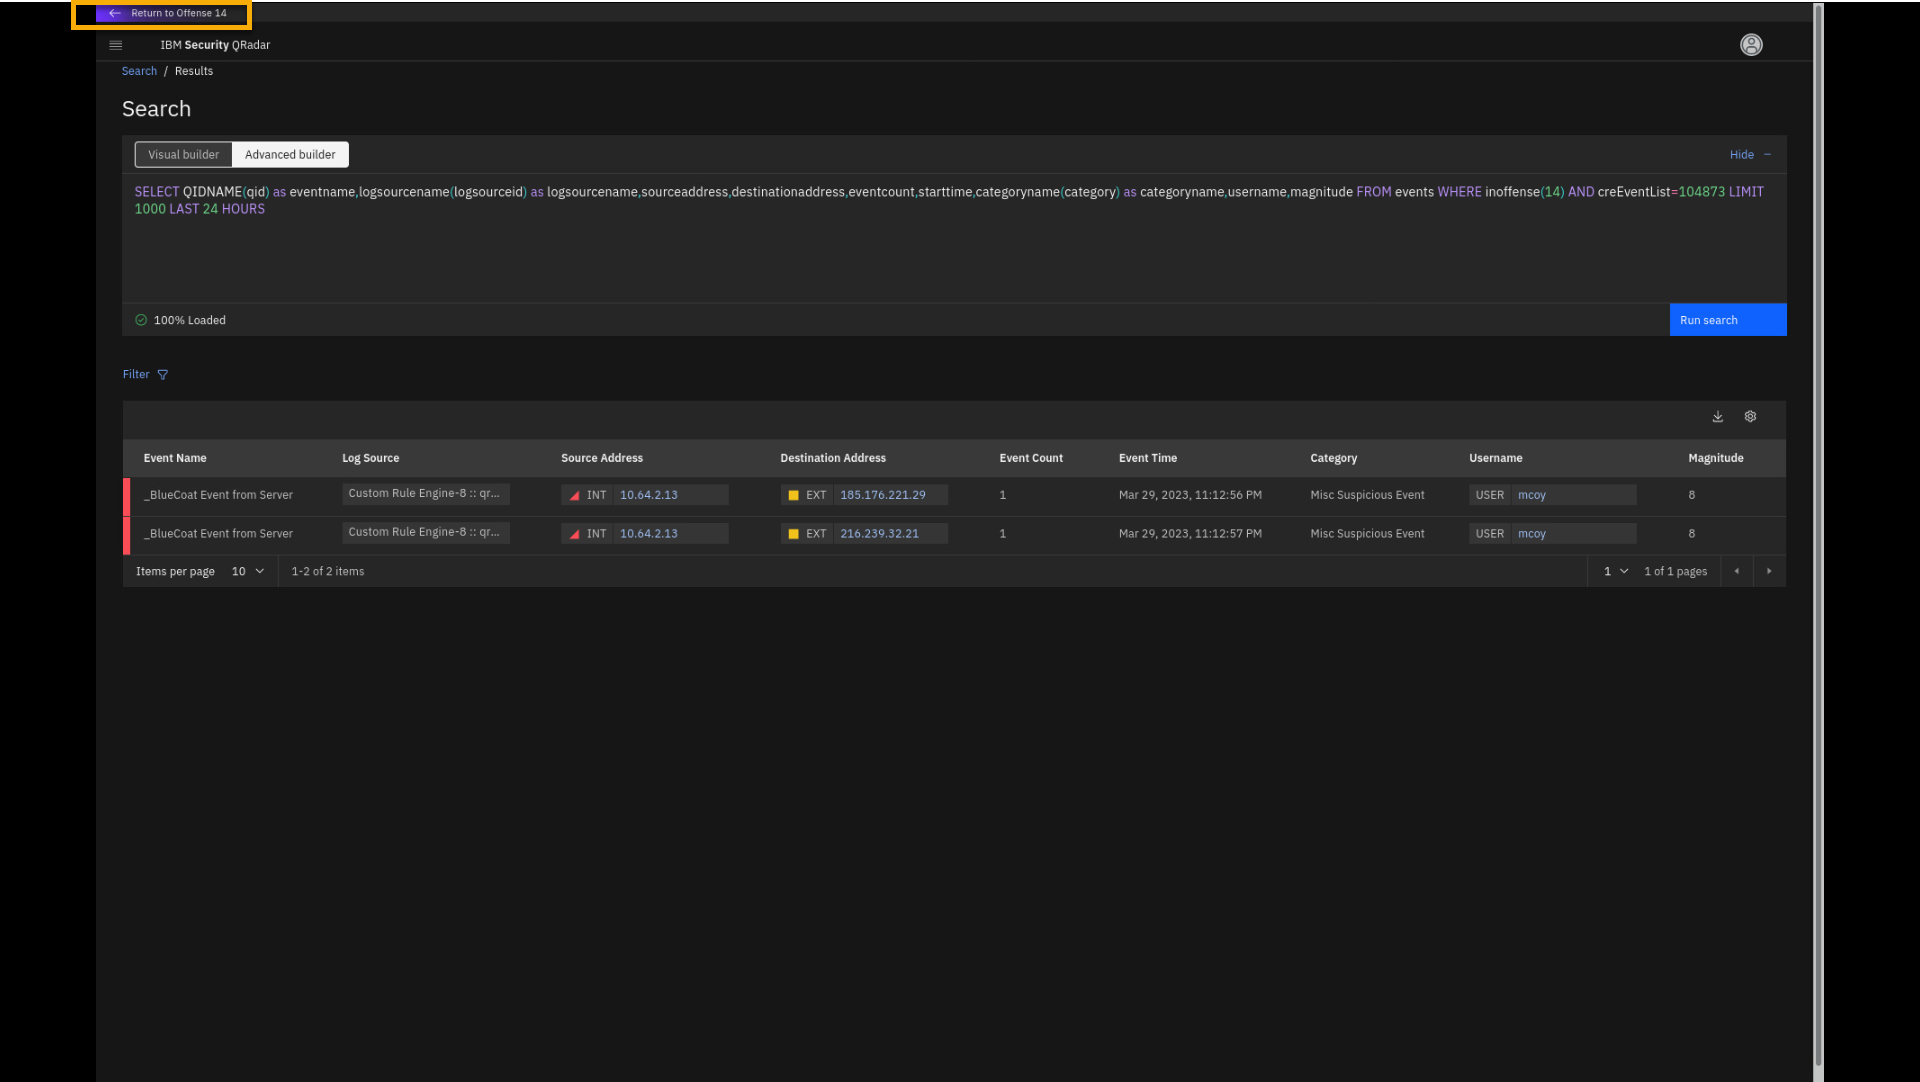
Let's review the next insight in this offense, Suspicious Activity on
Personal Data Detected by DLP Devices. -
Click the Suspicious Activity on Personal Data Detected by DLP
Devices insight.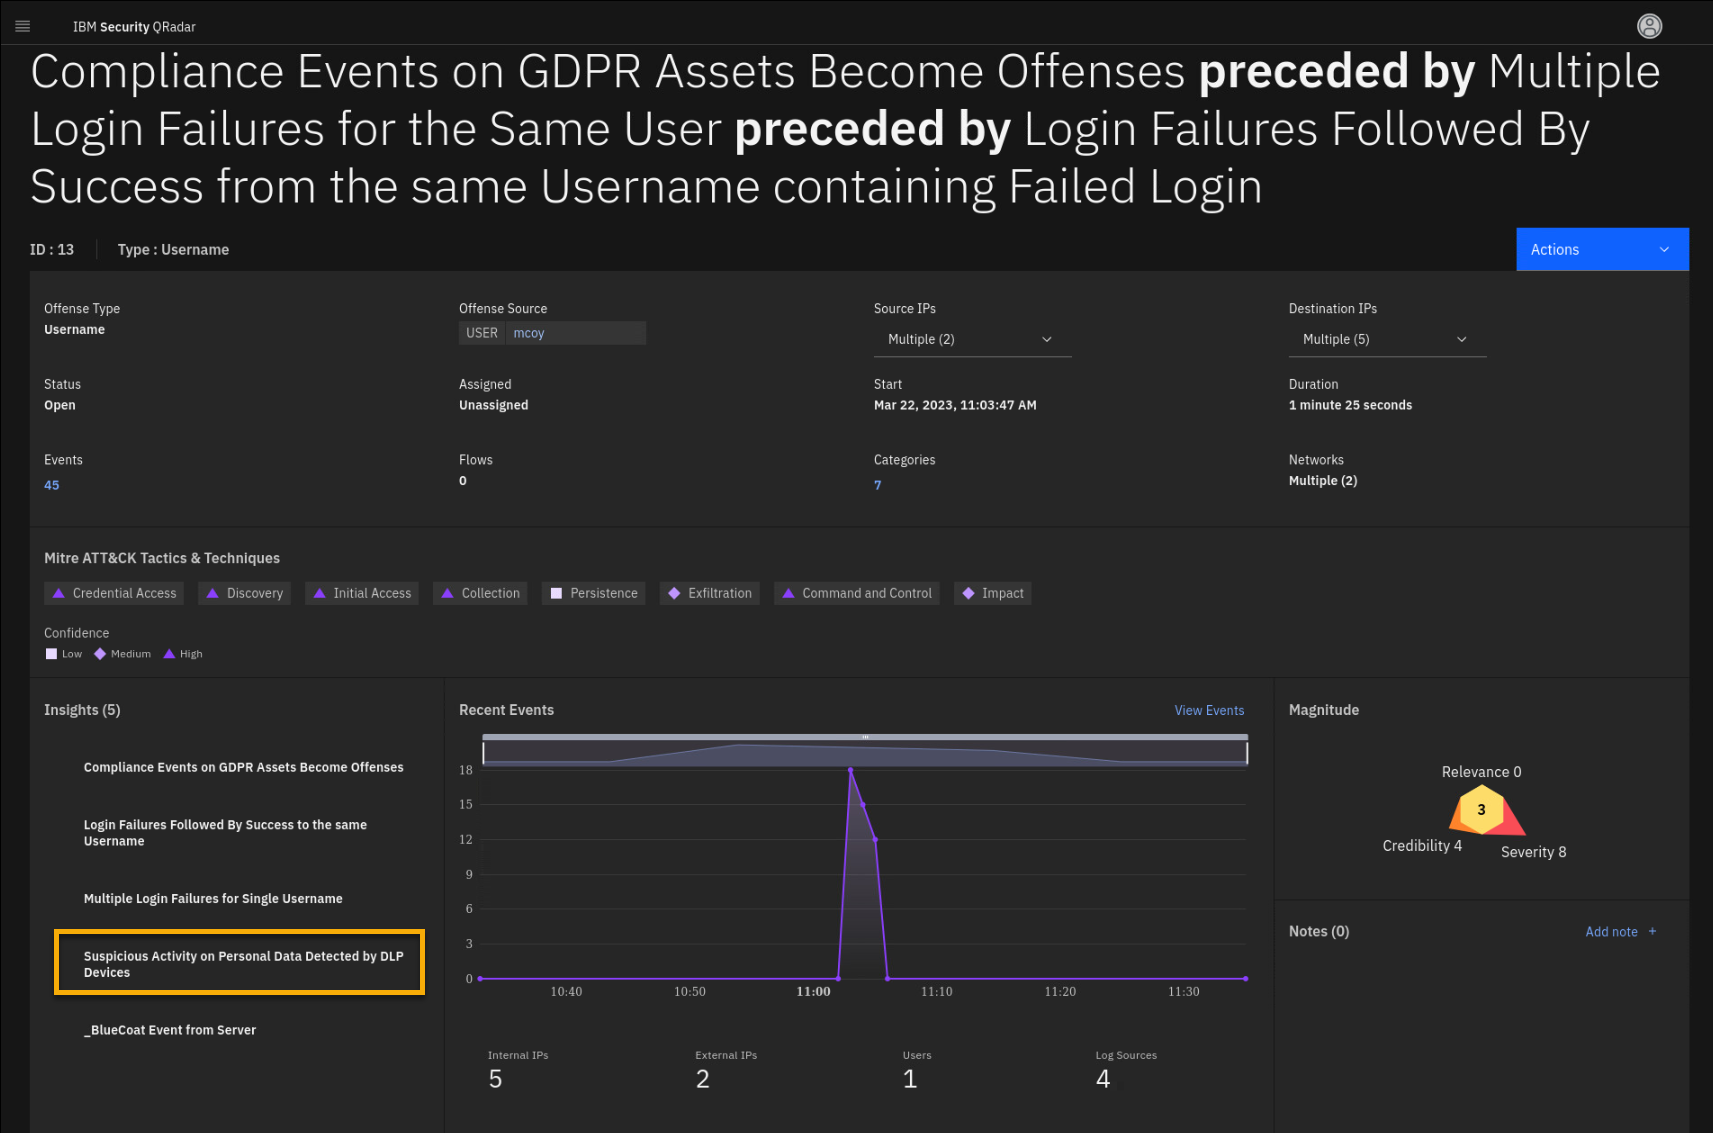
-
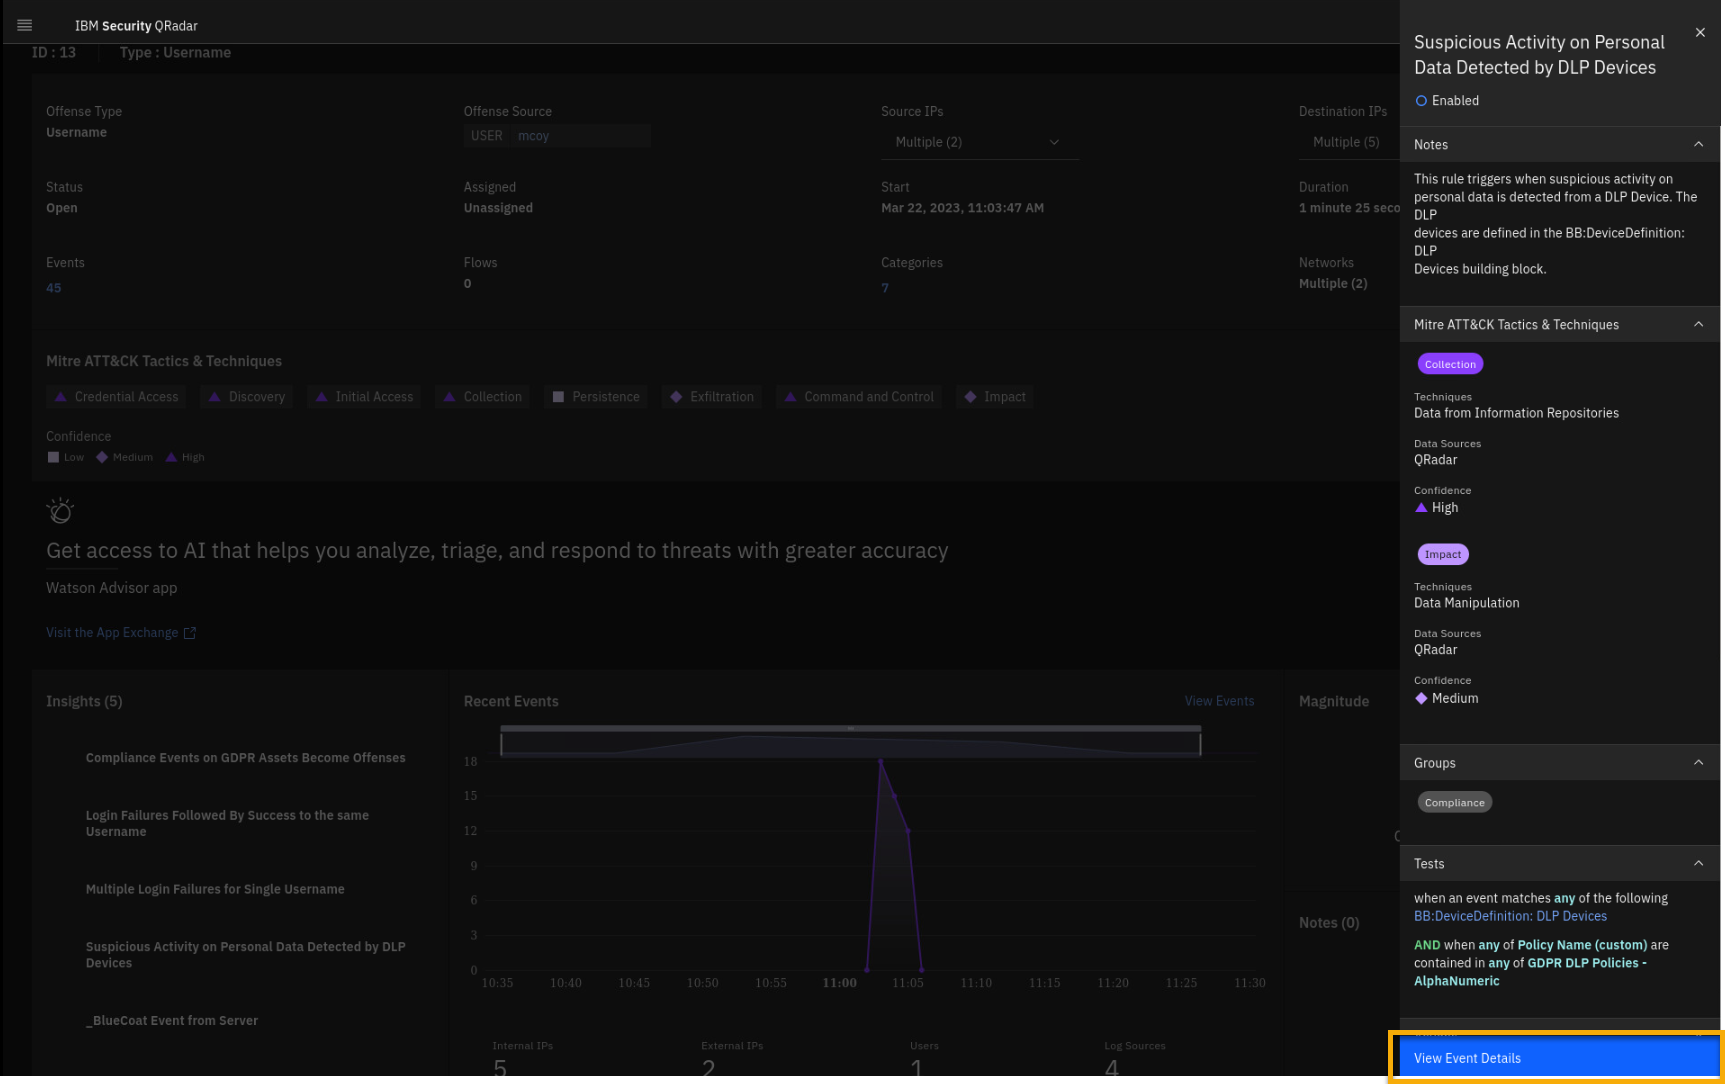
Review the Notes and Tests sections related to this insight.
Looking at the Notes section and the Tests related to this insight, you
realize that the test triggers if a DLP (Data Loss Prevention) service
detects a policy or rule defined in the GDPR DLP Policies reference
set. We will look at those tests and the insights in more detail a bit
later using the Use Case Manager app, but now let's review the events
related to this test and the offense. -
At the bottom of the side window, click View Event Details.
The new search is automatically formed showing the Guardium events that
observed activities between internal systems. The destination systems
are marked red, which means those are critical assets. -
On the Event Details screen, click the critical IP 10.4.0.26
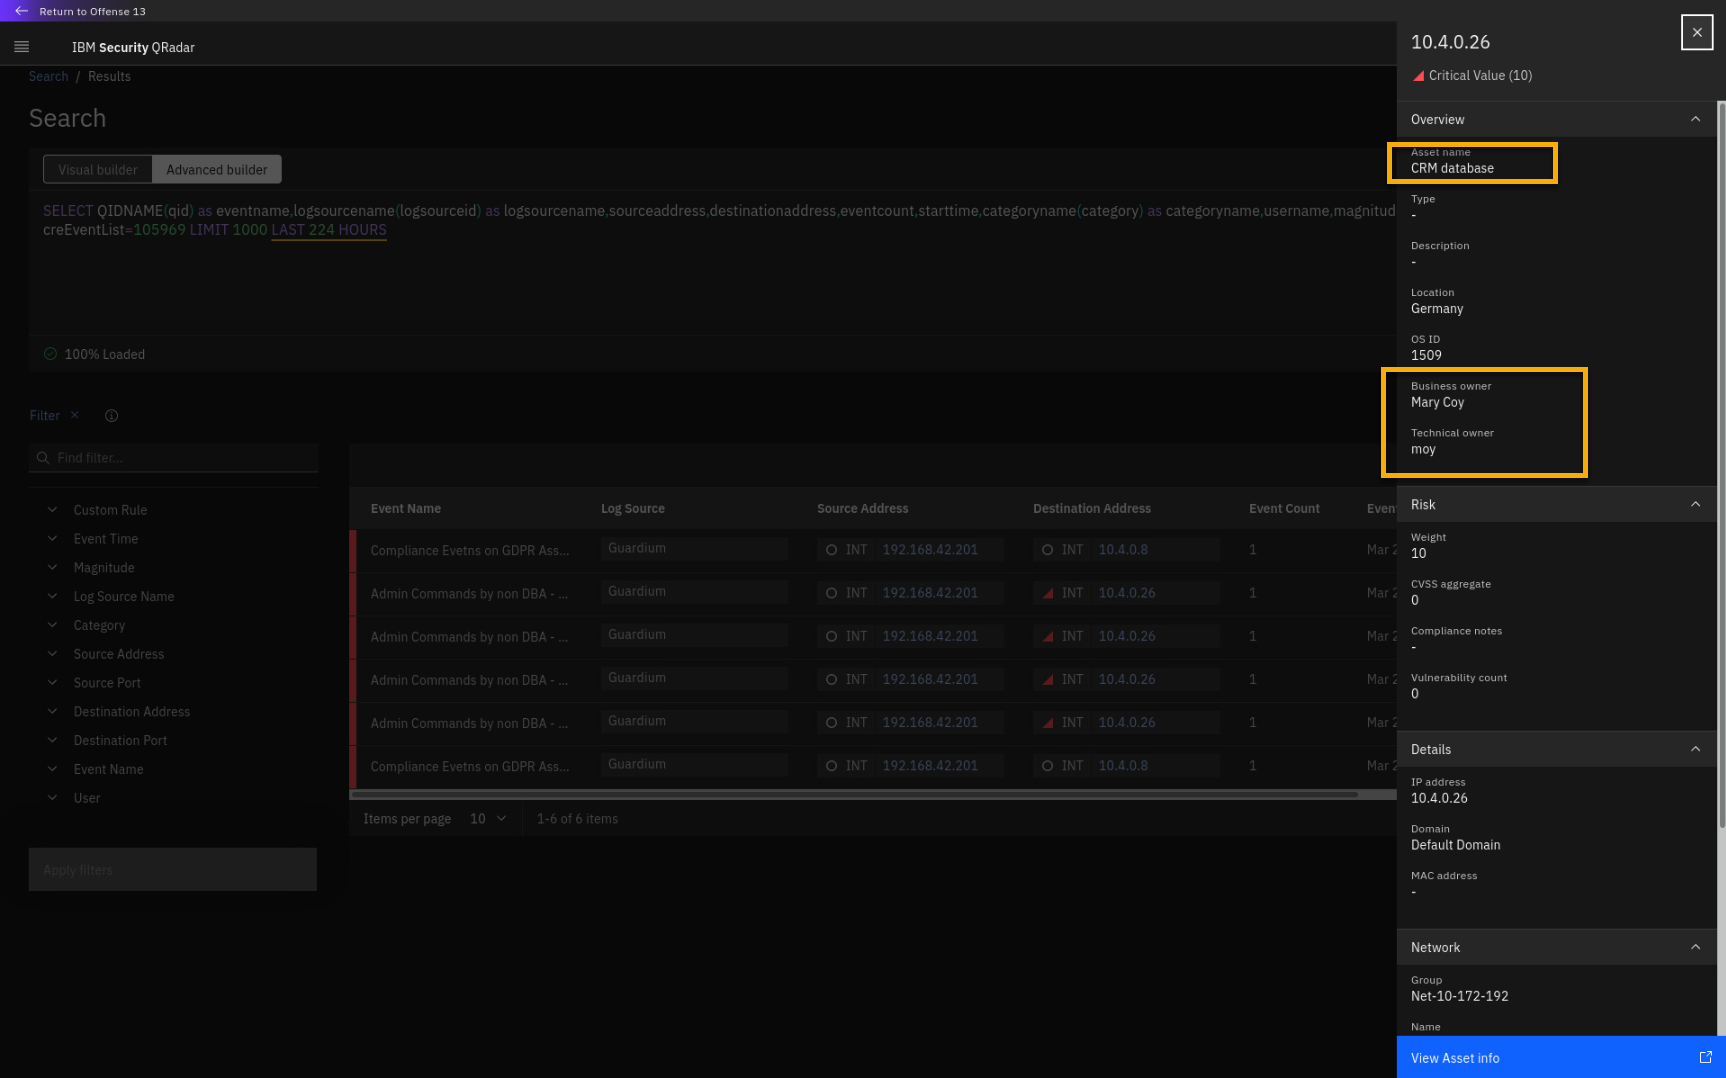
This asset is labelled as a CRM database and the owner is Mary Coy, who
is also involved in this offense. This either indicates malicious
insider threat activity or an outside adversary using stolen
credentials. Let's continue the investigation. -
Exit the asset details pane and go back to the search results
window.Let's look at the Admin Commands by non DBA - Alert event in more
detail. -
Click Admin Commands by non DBA -- Alert.
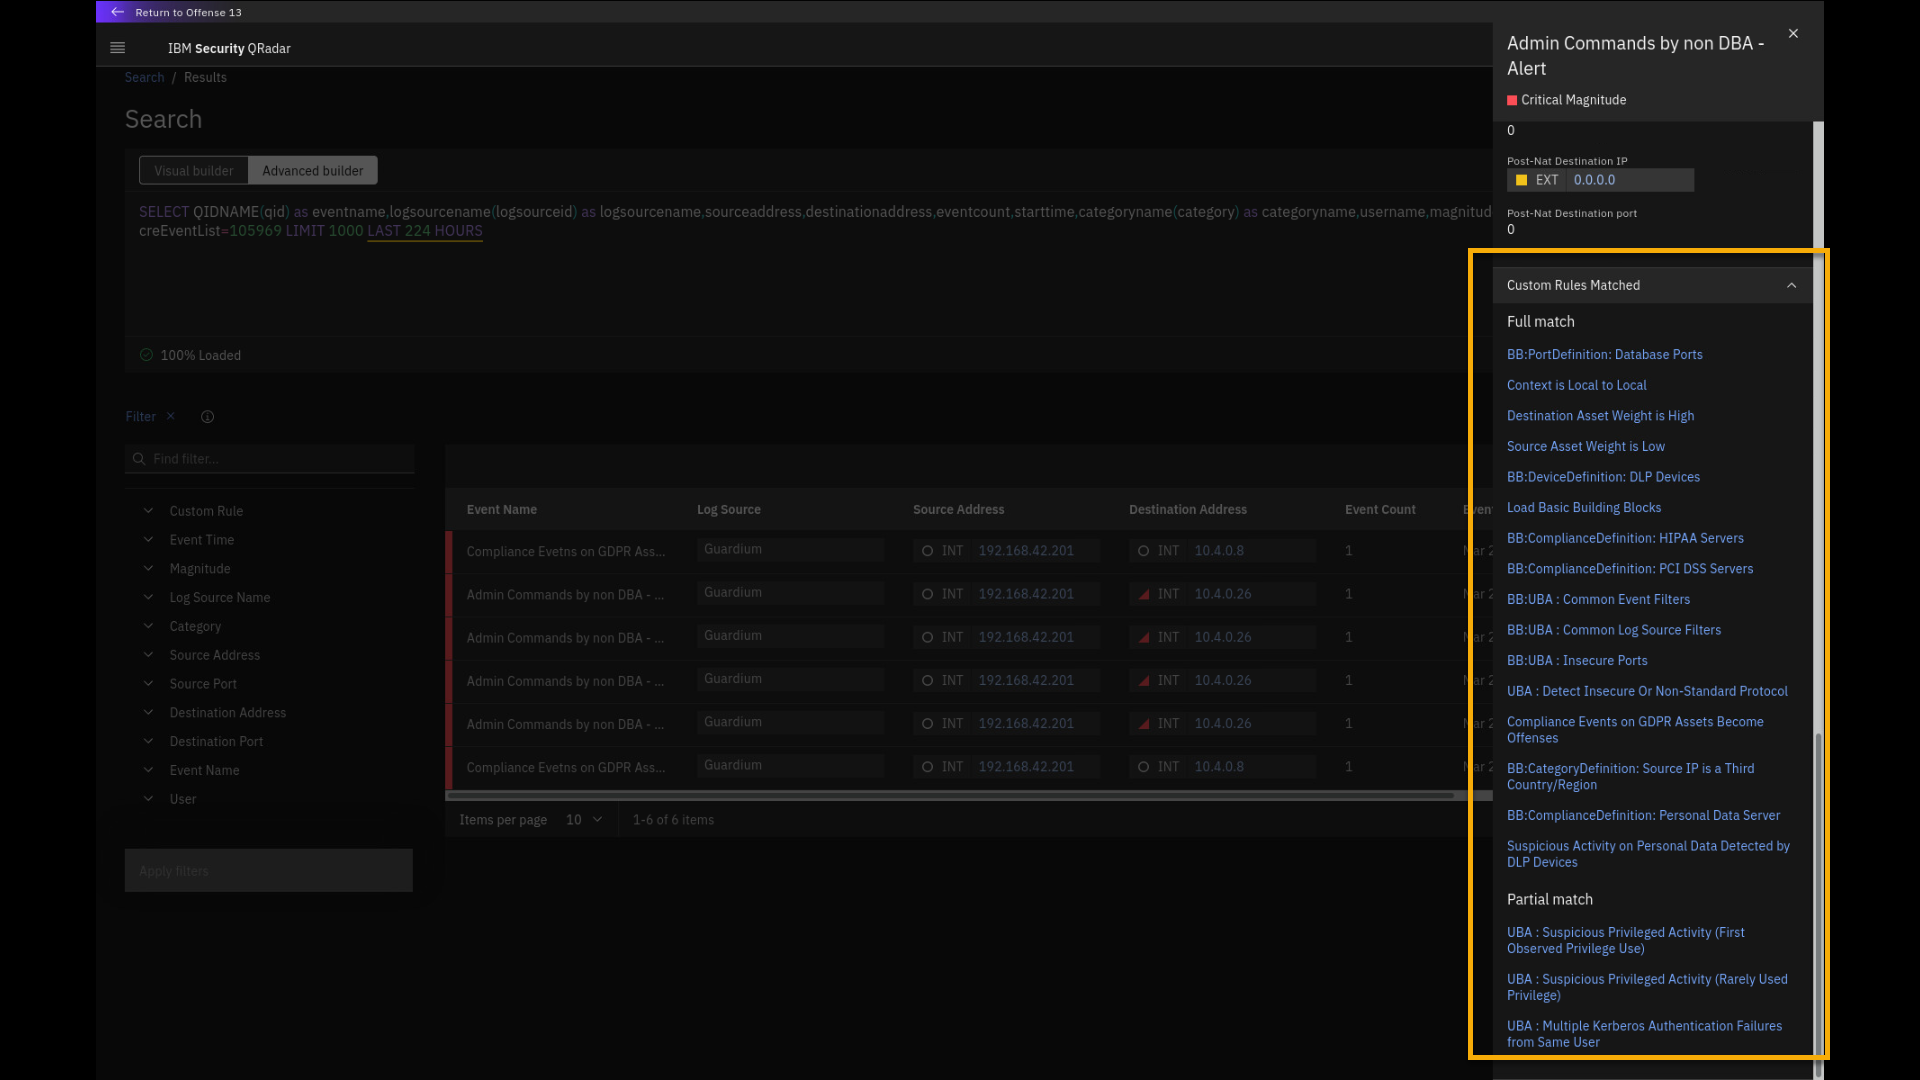
This Guardium event is marked critical. If we scroll to the bottom of
the event details pane, we can see what insights (QRadar rules and
building blocks) were fully or partially matched in this event. Any
matched rules or building blocks can contribute to an offense or create
a new one.You can also see the full payload, how the event is received by QRadar
from Guardium. -
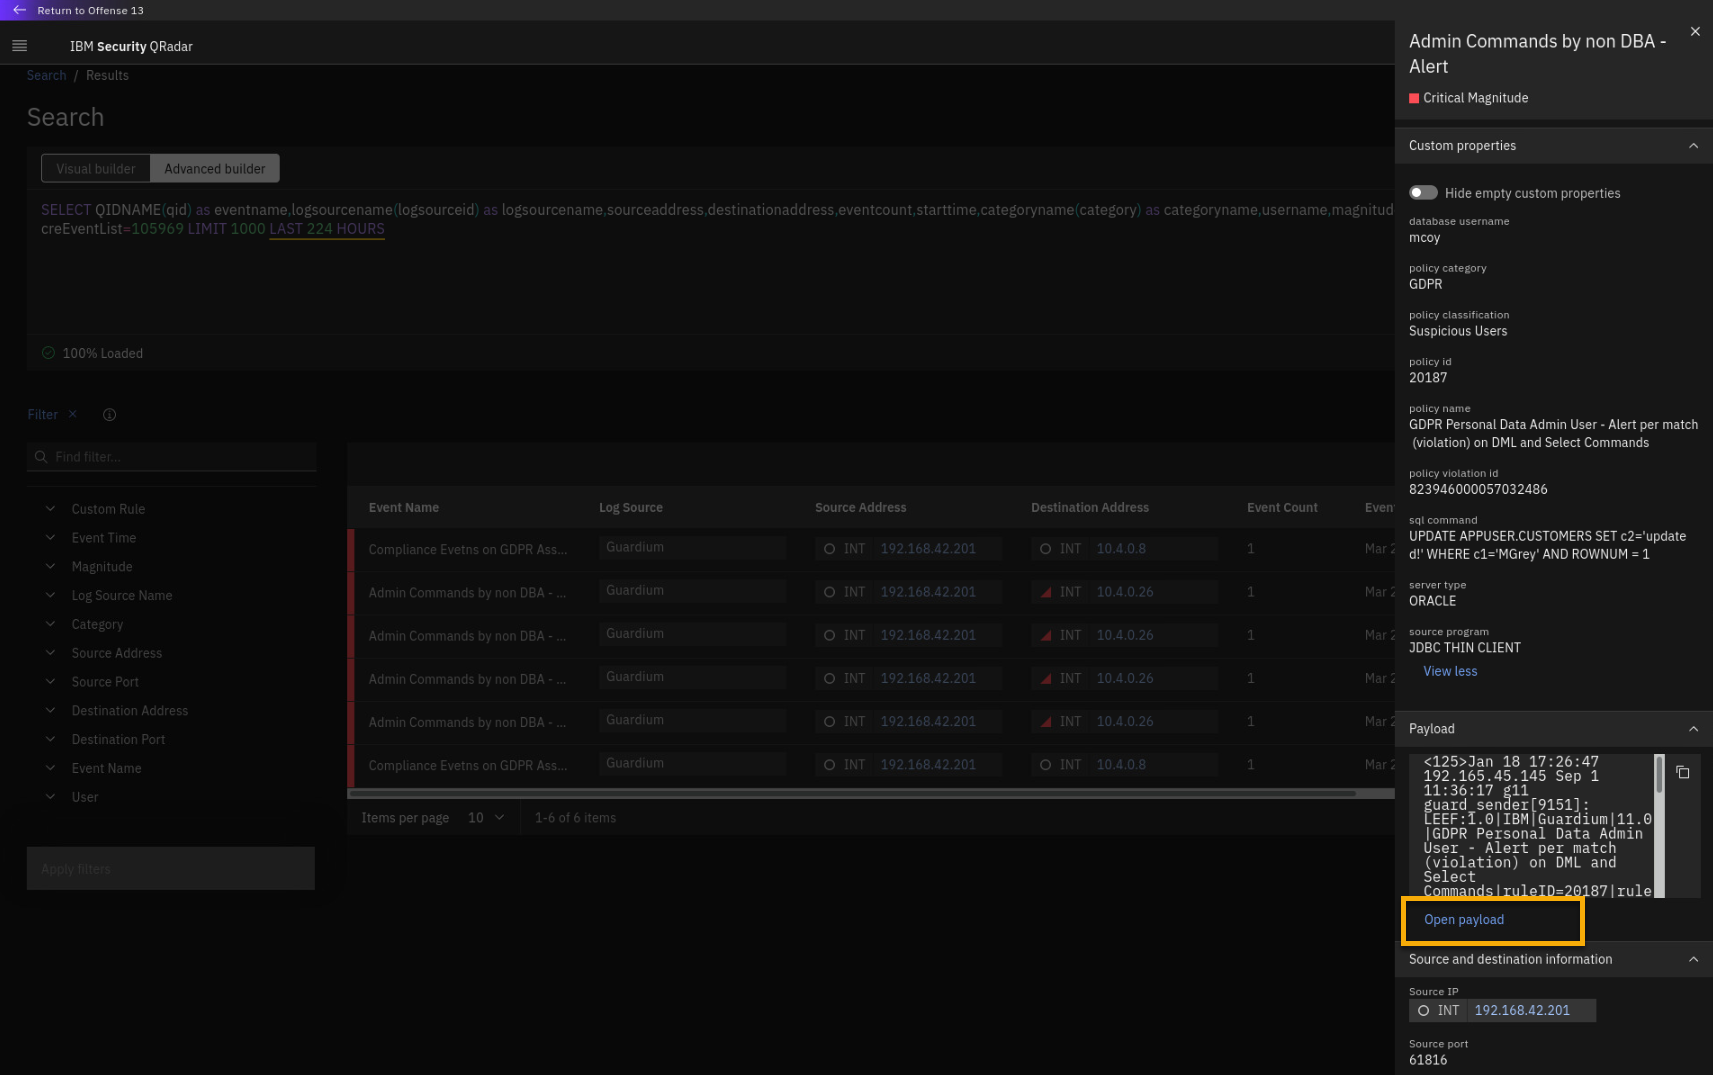
If not already expanded, expand the Custom Properties section.
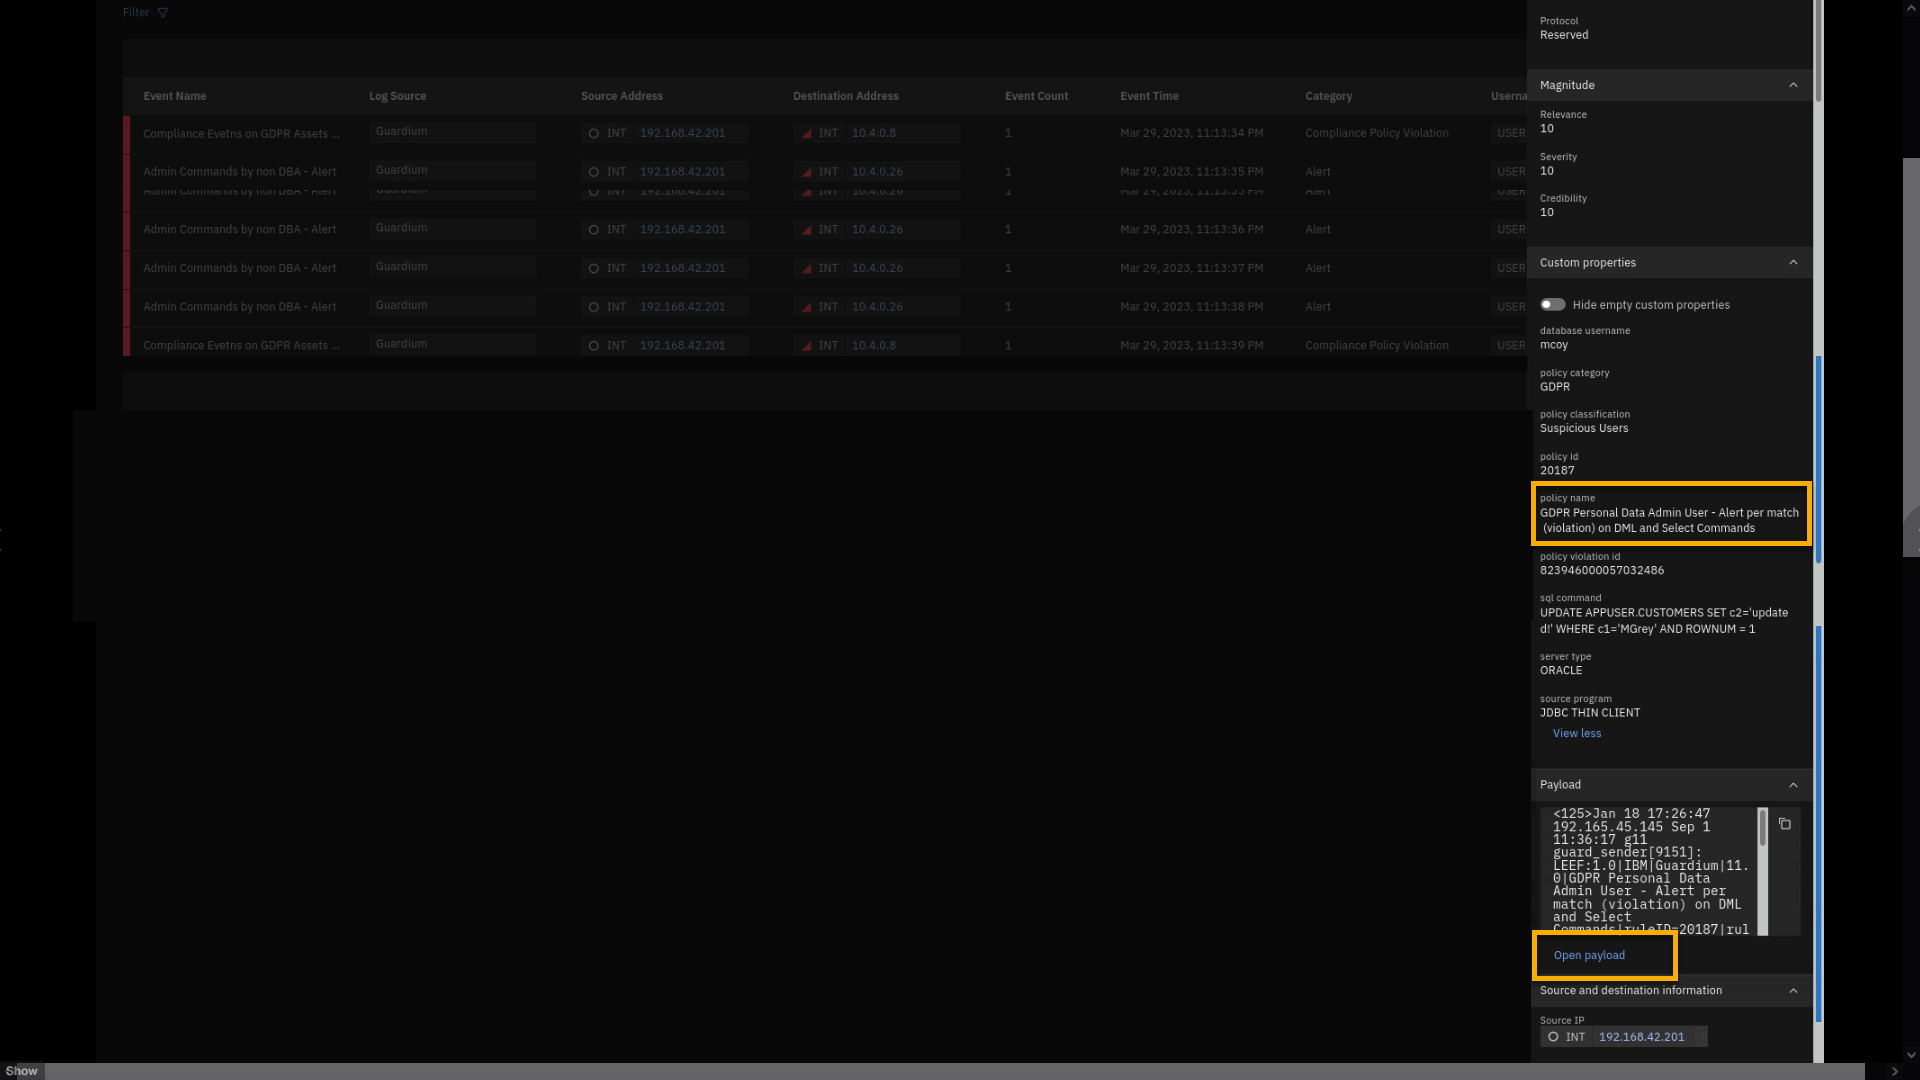
In the Custom Properties section, you can see what parameters
are extracted from the event payload. One of them is the policy name --
GDPR Personal Data Admin User -- alert per match (violation) on DML
and Select Commands. Make note of this policy name, because we will
reference it later in the lab and demo.You also see the user, mcoy, who executed the database SQL command.
-
Click Open payload.
-
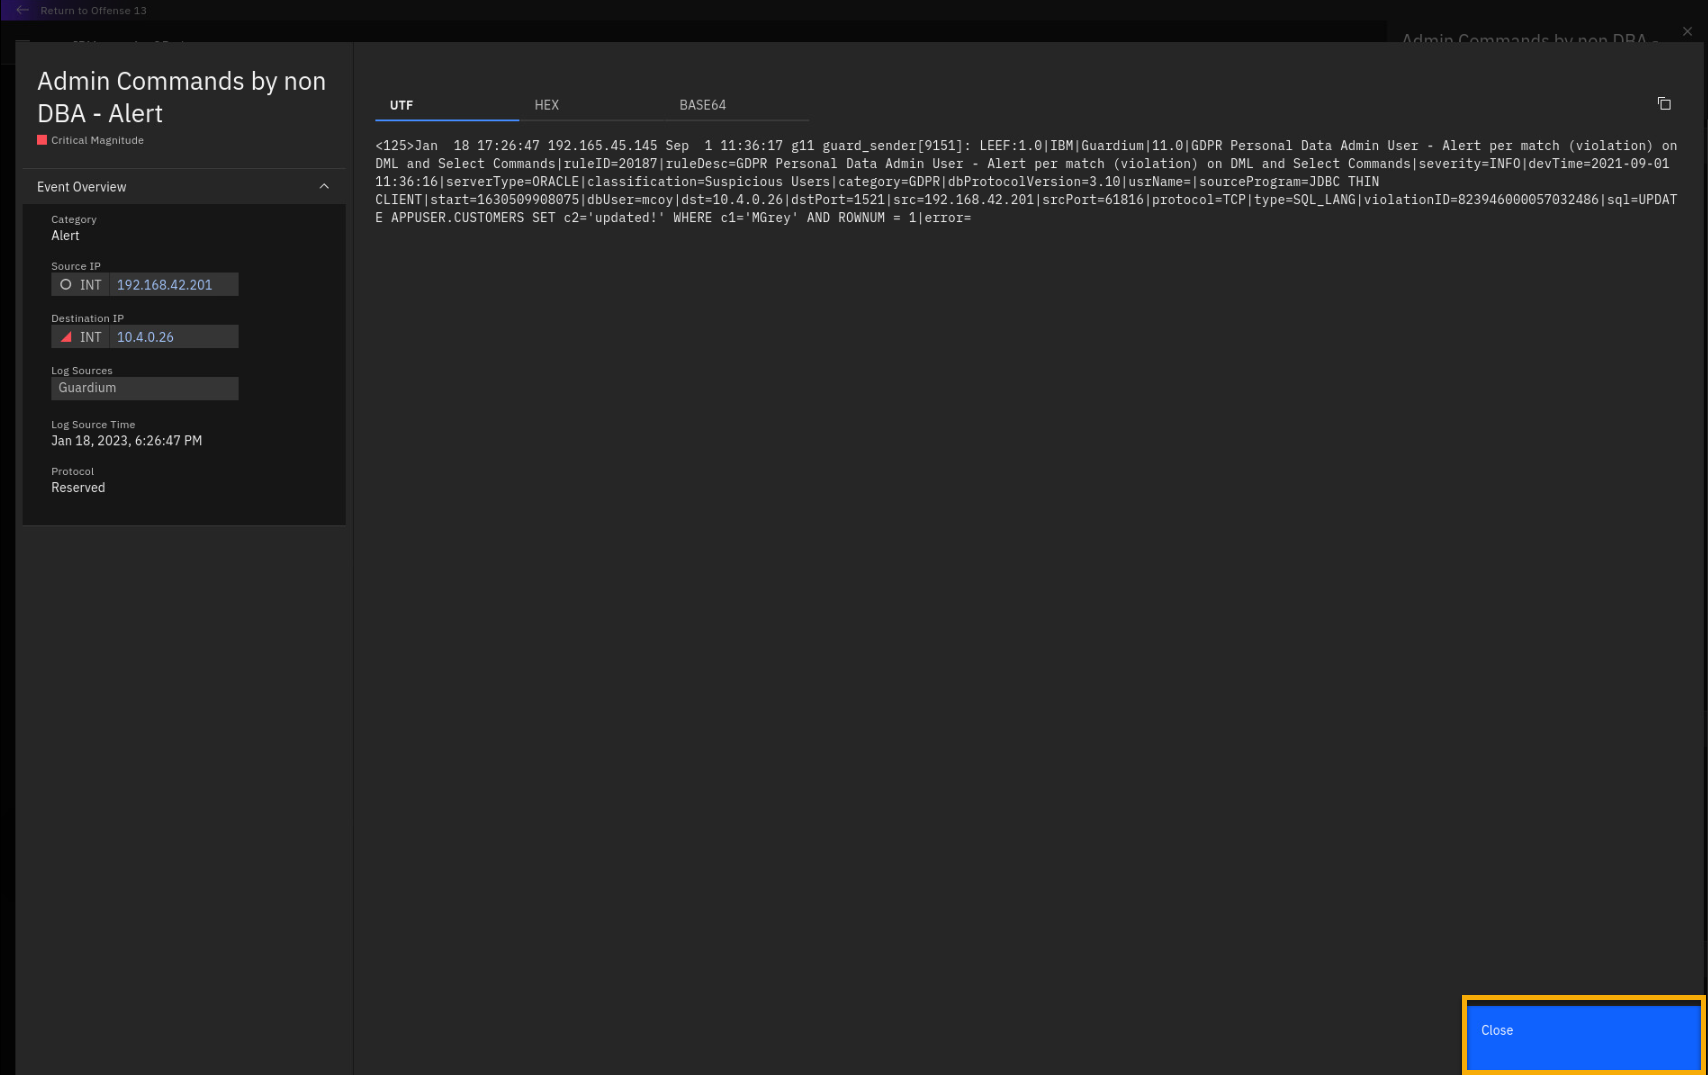
Review the payload details page.
This will be on the quiz
On this page, you can see how the raw payload looks. If you identify some
relevant data in the payload, you could create an additional custom
property to extract the information, which you can use in the rules
processing the events.This eases the daily activities for your Security Analysts because they
no longer need to review a lot of raw payloads. Instead, QRadar
automatically extracts important fields in the custom properties and
uses the custom rules engine, tests, and insights to digest the
information for the analyst, packaging all pieces of information into a
more human-readable package, which we call an offense. -
Close the payload details page.
Let's go back to the offense.
-
Close the side panel, too.
-
From the Search page, click Return to Offense <n>.
Note: The offense number might vary.
We can continue to examine every insight and analyze them in more depth.
But, even by reading the Insights titles, we can see the unfolding
attack story: the Domain Controller was communicating with remote IP
addresses with a bad reputation. Then the mcoy account executed
suspicious activity on the CRM database -- maybe data was exfiltrated.
And then, the account tried to log in to another system and eventually
succeeded. All this data was collected in 45 events. The offense
chaining feature summarizes the threat in the offense title by
combining multiple insights into one offense connected with the word
proceeded by.Based on the detailed offense analysis, an analyst can perform a variety of actions on the offense, such as closing false positives or escalating the offense to an incident response or a ticketing system.
-
Click Actions to list the actions that can be performed on the offense.
If the offense is deemed false positive, the analyst should close it. It is not considered a good practice to defer or not perform offense closure because QRadar gets trained based on the offense closing reason the analyst specifies. Closing offenses also helps with performance.
If you do not properly manage the offenses, they may expire. If necessary, an analyst can also freeze an offense to avoid expiration.
In this case, the incident is a real threat and requires an incident response. Thus, you can send the offense information to QRadar SOAR for
further incident response. That action is beyond the scope of this lab.Therefore, leave the offense in the current active state.
-
Close the action popup menu.
So far, we have demonstrated how a security analyst can use offenses to
analyze information that QRadar has received and processed. We performed
detailed offense analysis and highlighted important artifacts, such as
index, magnitude, event categories, insights, and events.
Let's now take a close look into QRadar use cases and rules with the Use Case Manager app.
Analyzing rules with the Use Case Manager app
The compliance and threat landscapes are constantly evolving. Also, as your organization grows, new assets and network traffic patterns are added to your IT environment.
In order to keep up with these ever-changing challenges, your Security team must be able to constantly and consistently adapt and augment QRadar SIEM default rules and building blocks.
Using the Use Case Manager app, you can deploy, manage, and modify the rule set on your QRadar deployment in one place.
Use Case Manager (or UCM) has many filters that can help you analyze your rule set and review and analyze rule dependencies. It integrates the MITRE ATT&CK framework and shows QRadar deployed rule coverage for different tactics and techniques.
Finally, UCM can help you with tuning rules in your QRadar deployment.
Let's review the Use Case Manager app.
-
Go to the main Menu and select Use Case Manager.
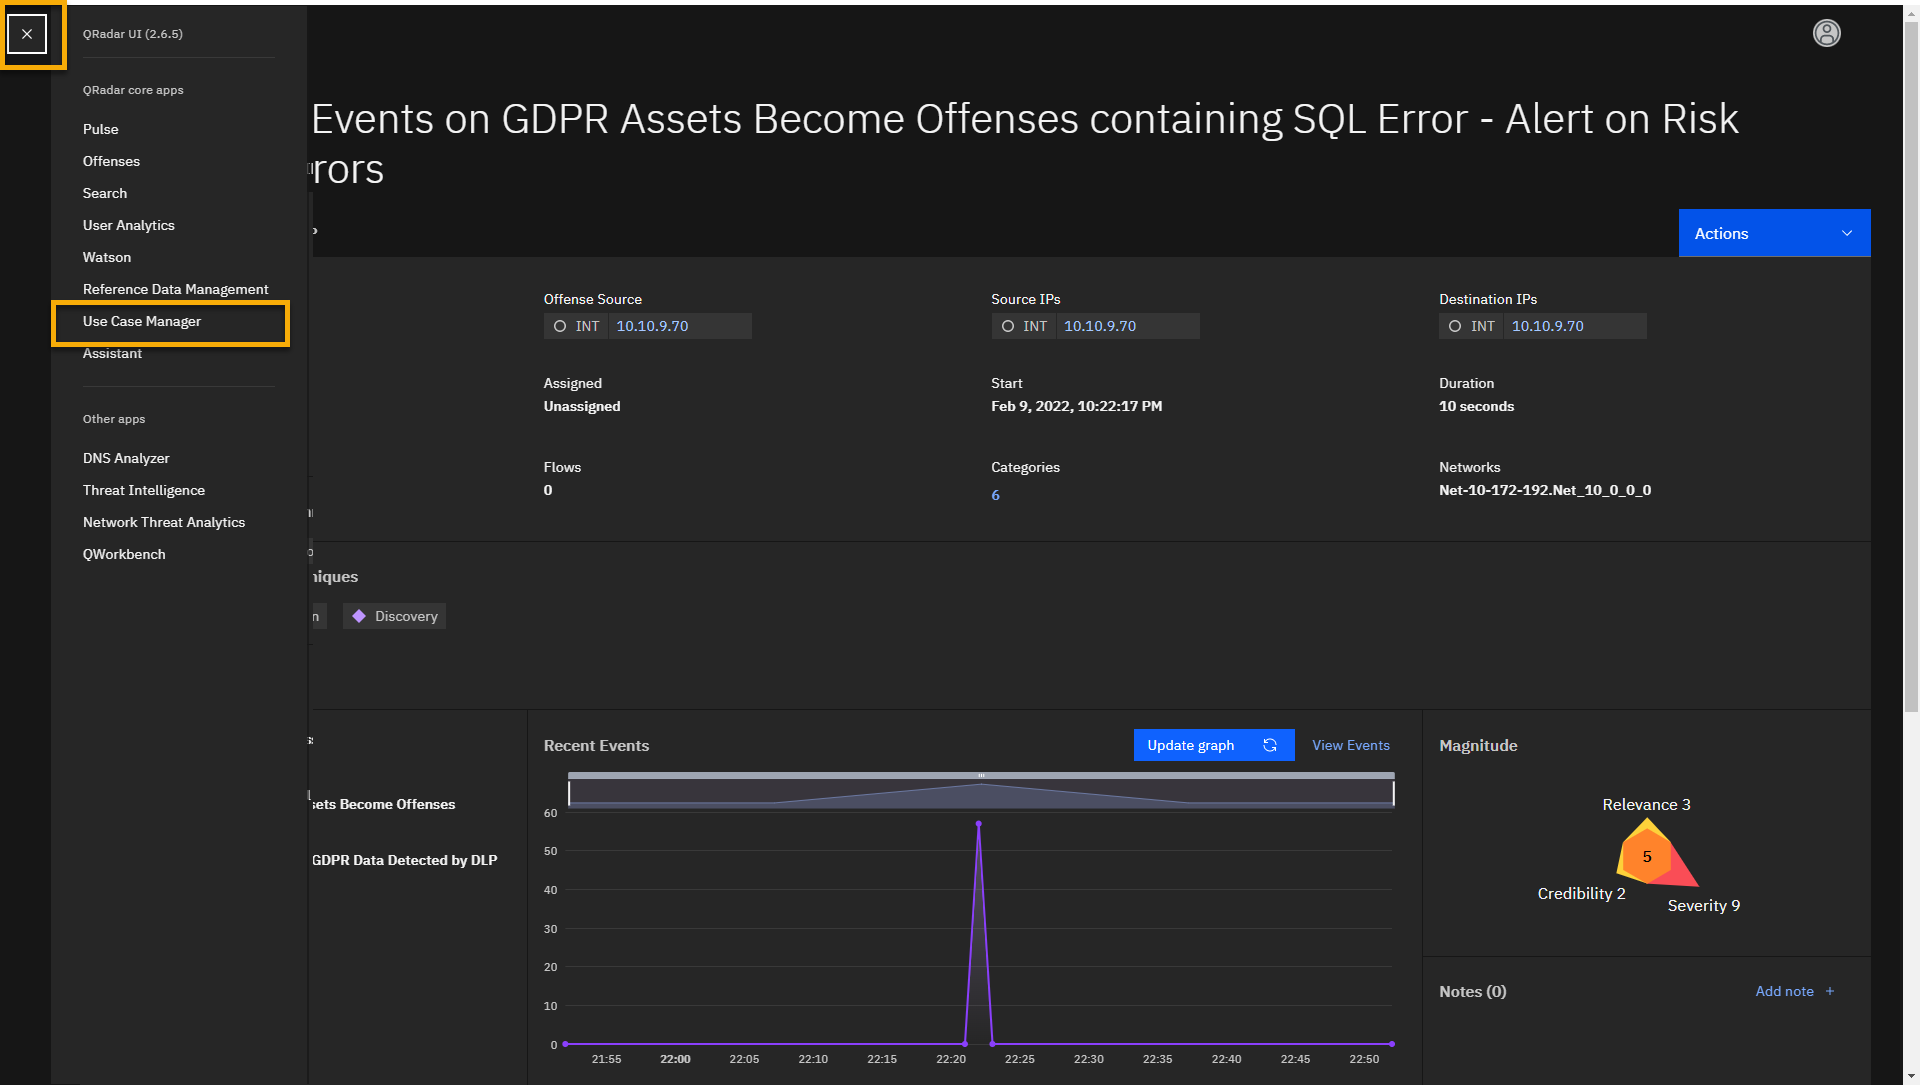
The UCM app loads Use Case Explorer. The explorer helps you to search
and review the rules and building blocks based on many filtering
options. Usually, you will start by loading some of the template
filters. -
Click the Select template icon.
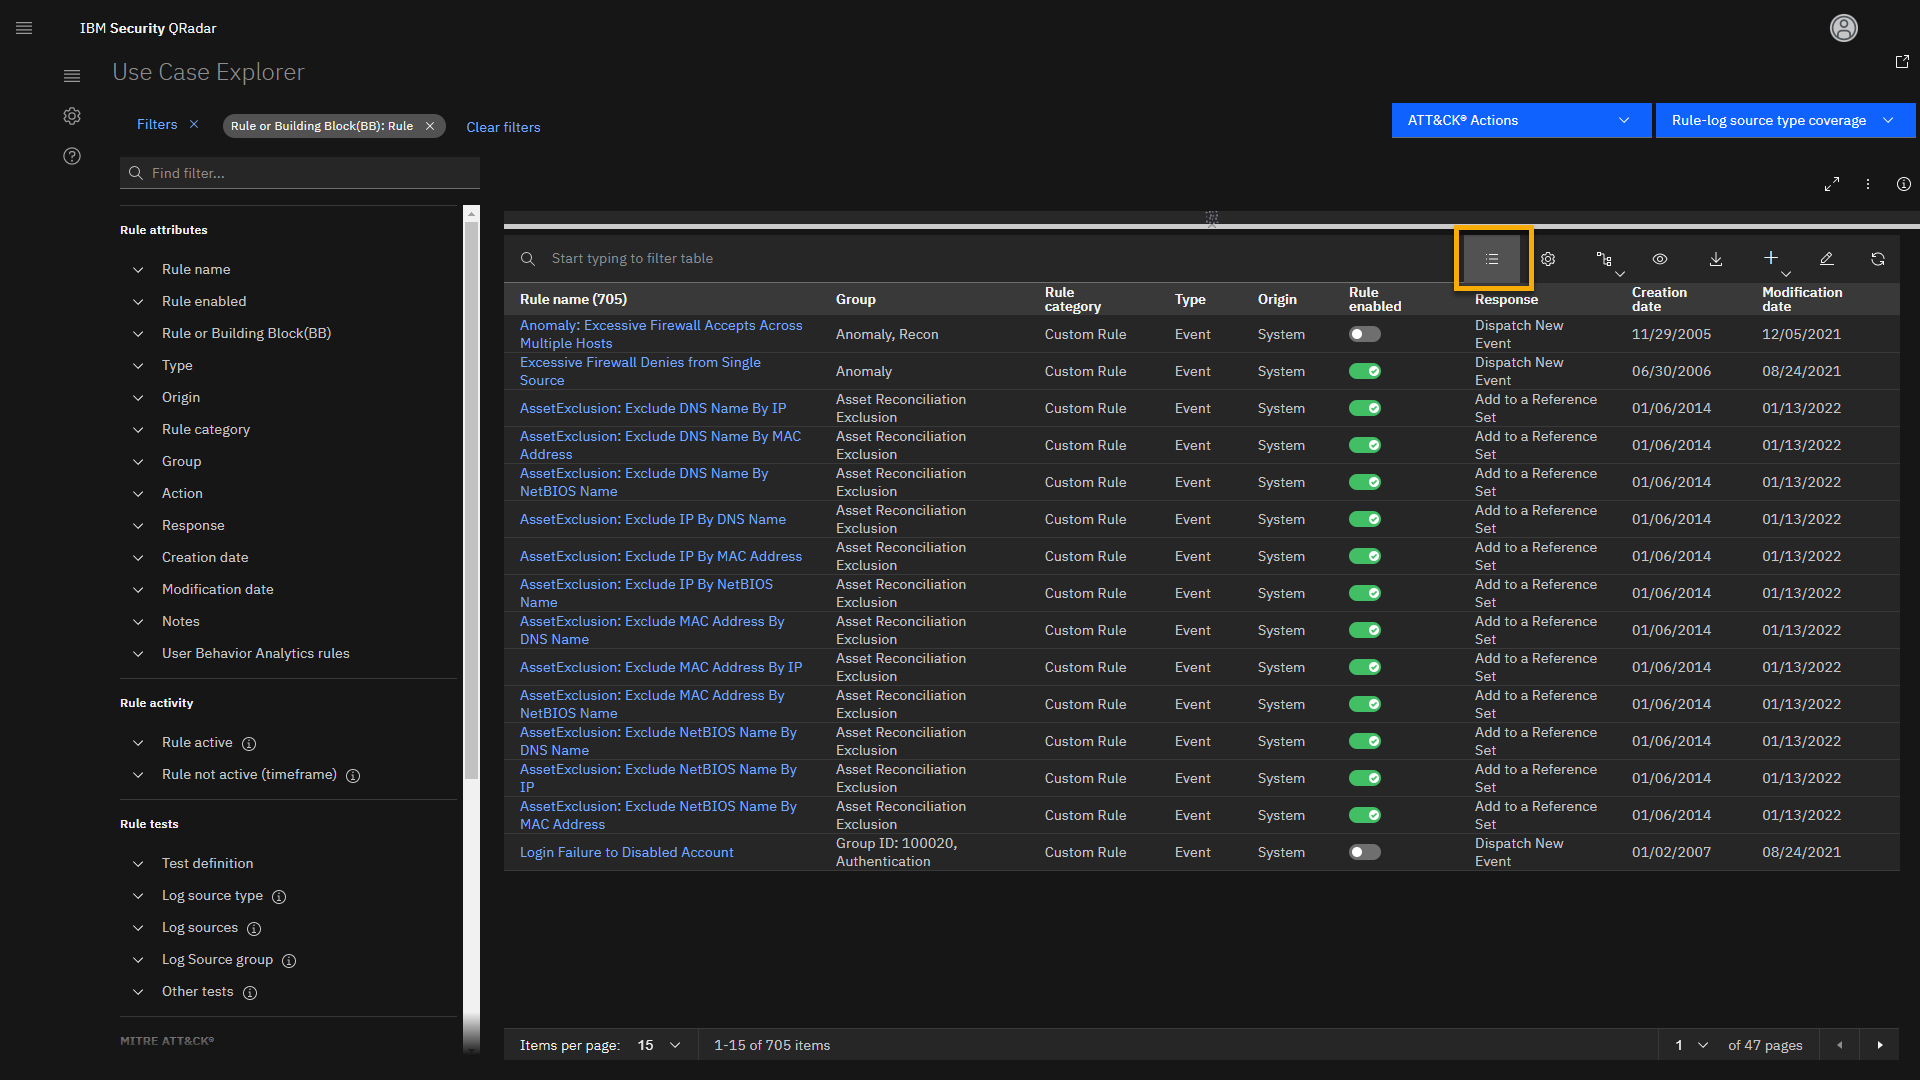
This opens the Select Template screen where you can pick one of the
preconfigured templates. Note that you can select your preferred filter
combination and add your own custom template to the list.Let's load all rules that we have installed in QRadar.
-
Click Default template -- All rules.
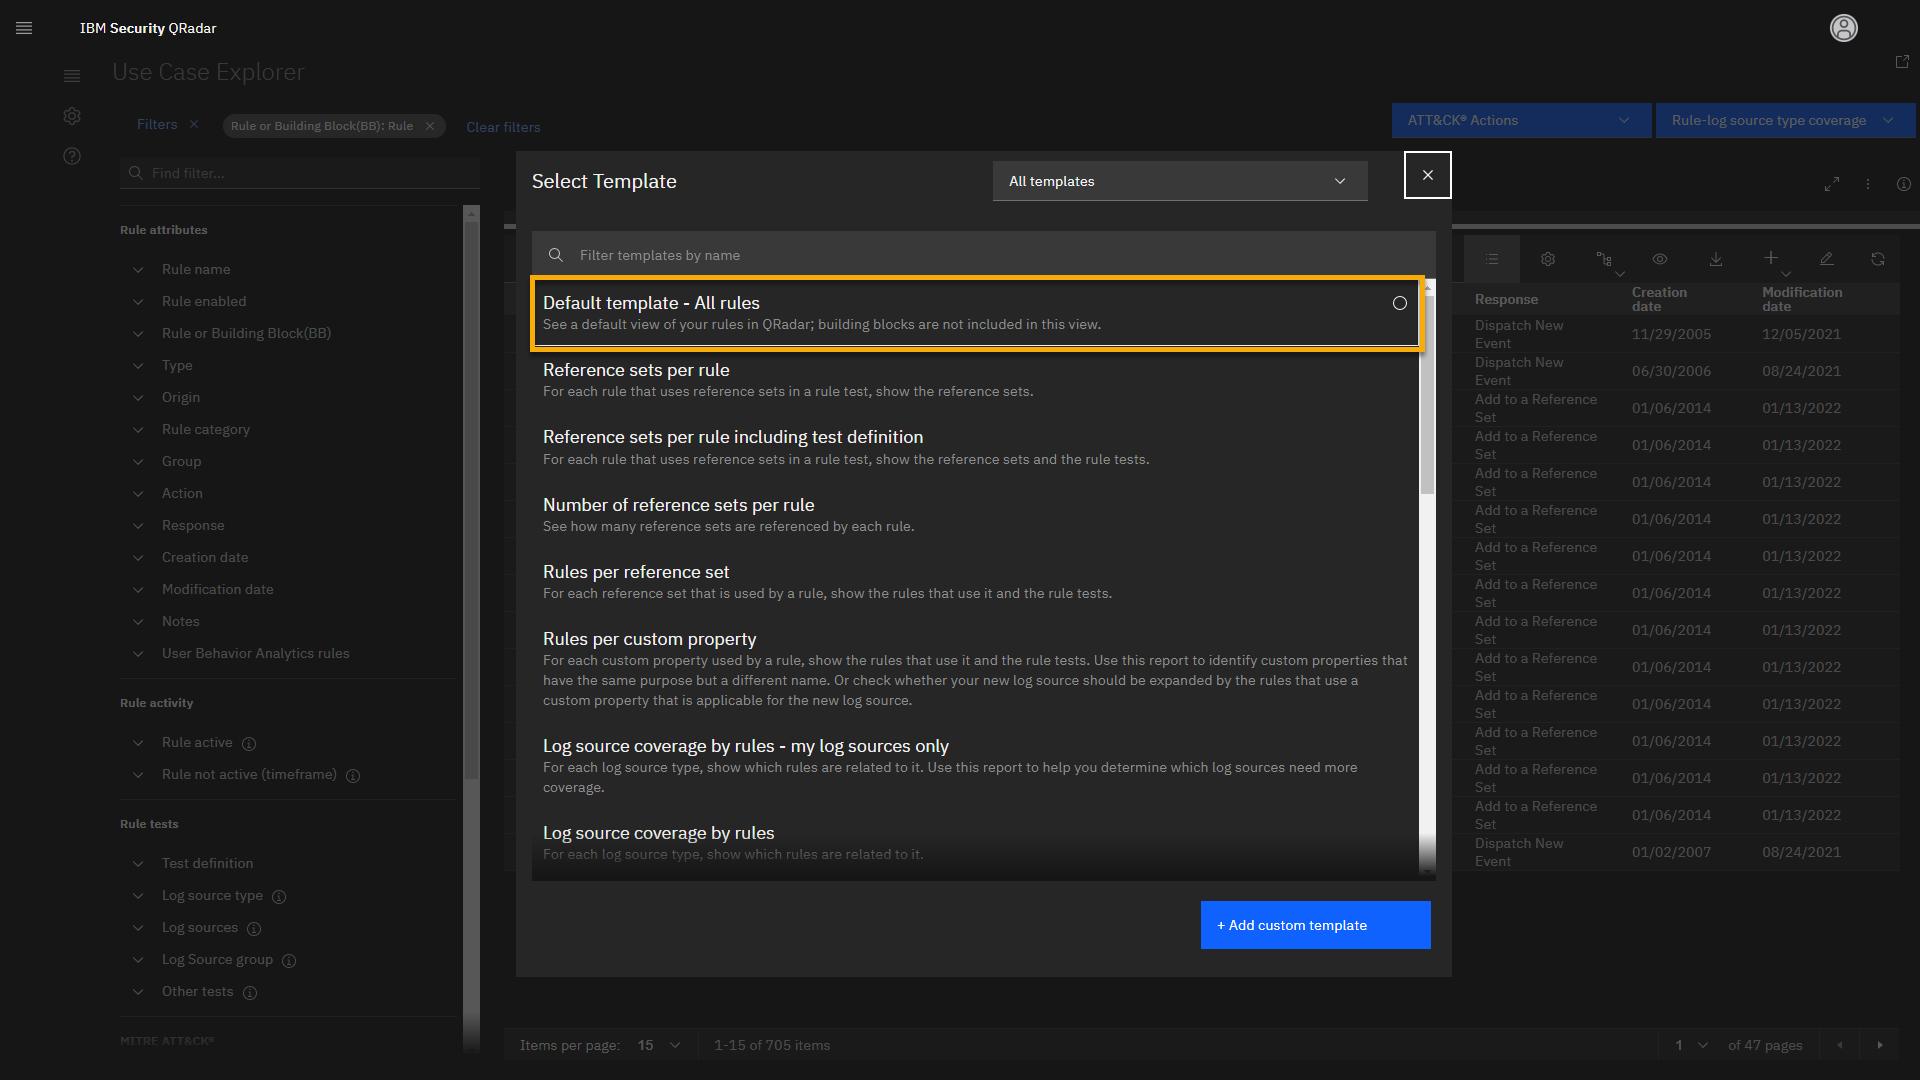
This view has almost 400 different rules. The view contains many filters
that can help you search for specific use cases. For example, you can
visit the use cases related to compliance regulations. -
In the Filters menu, expand the Group, then click
Compliance.
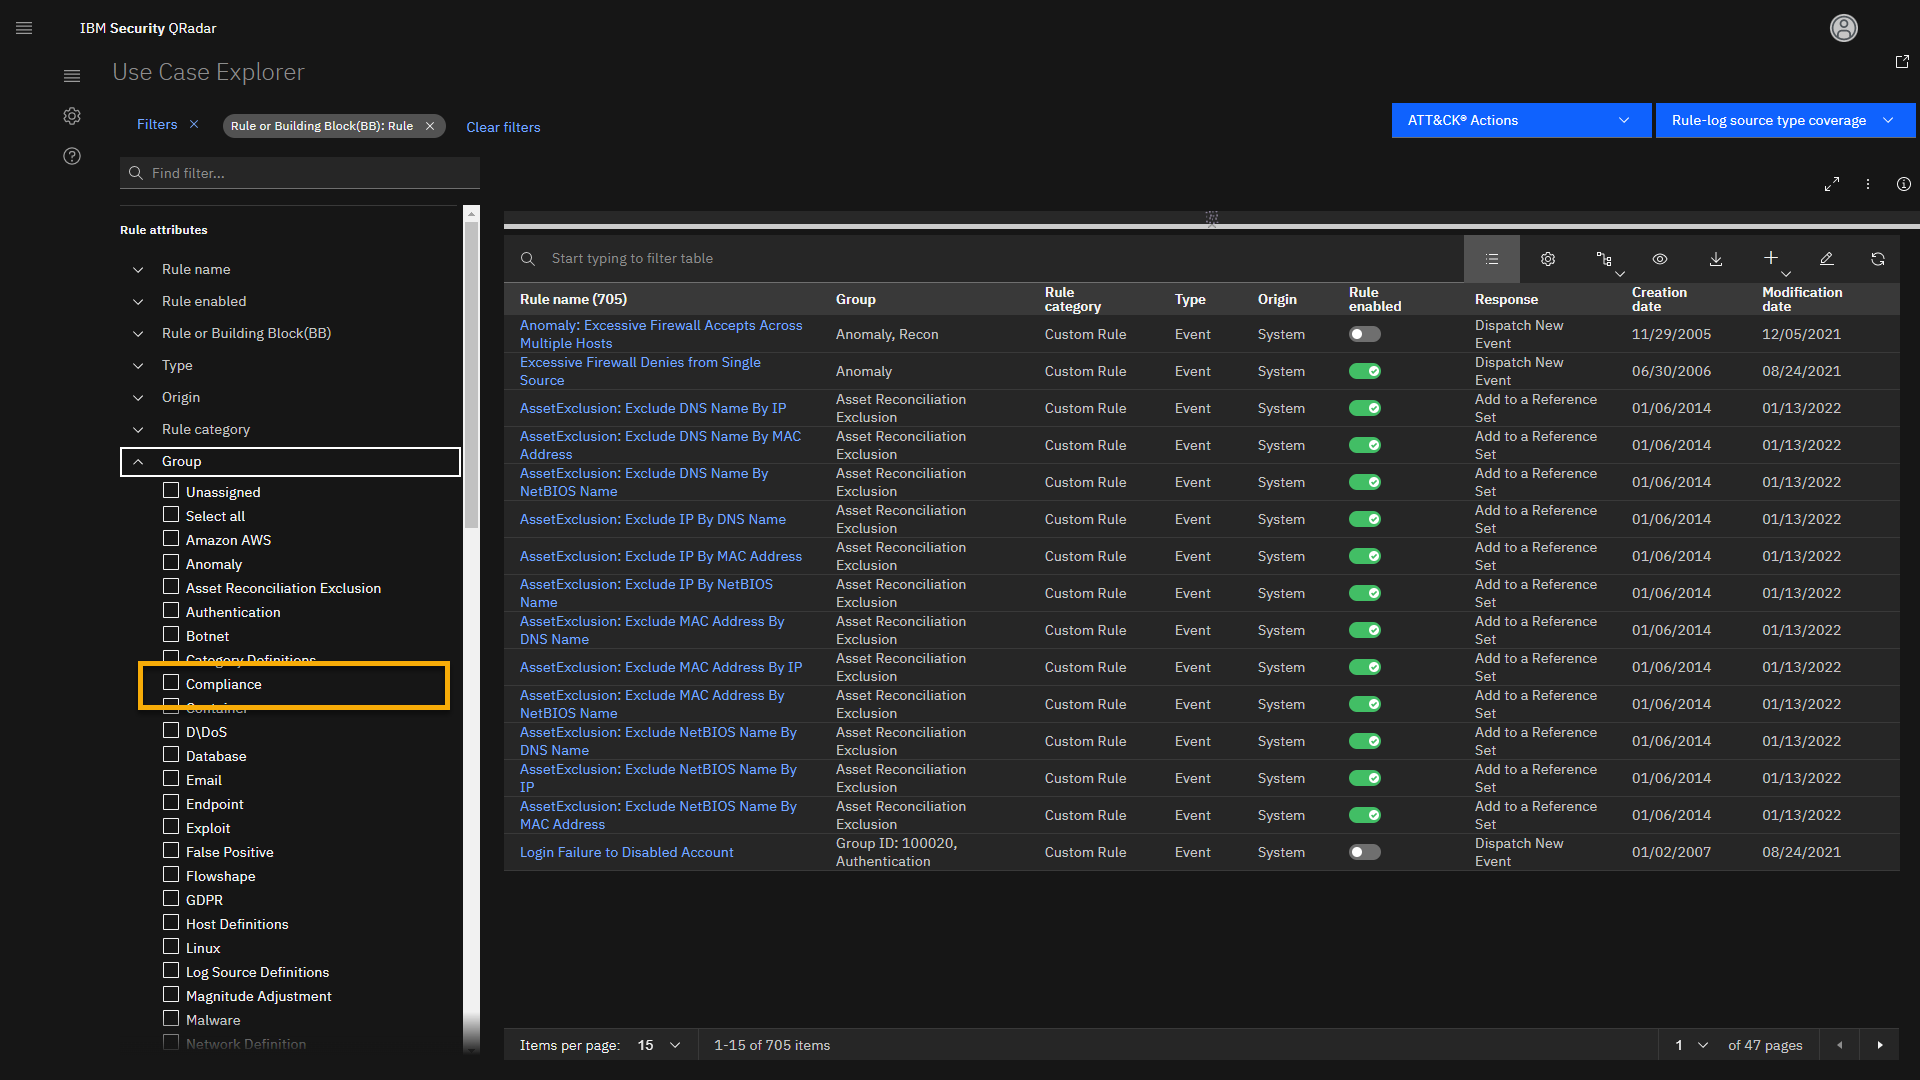
Observe that a new filter highlighted in white is added to the filter
list. To activate the filter, you must click Apply Filters. -
Click Apply Filters.
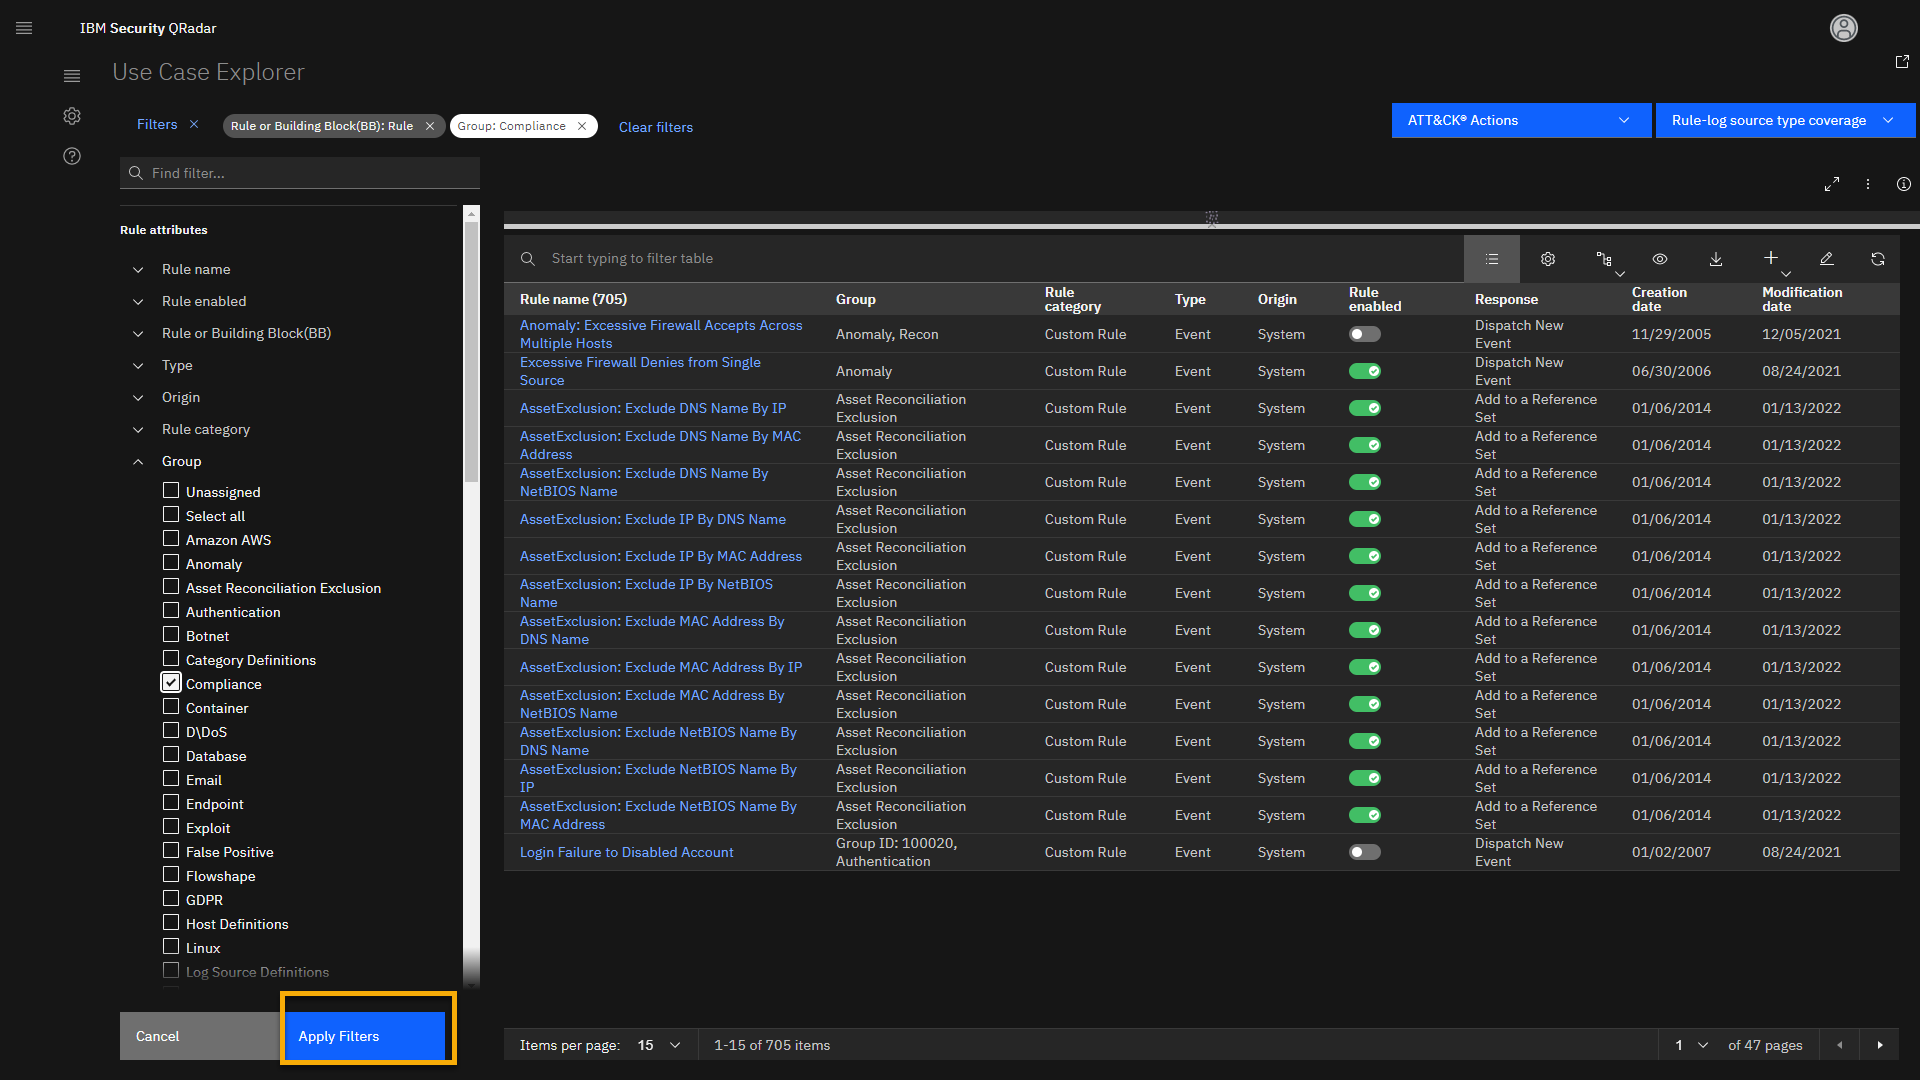
This filter combination loads 50 different rules and building blocks
related to configuring QRadar to assist with coverage for different
compliance use cases such as HIPAA, PCI, SOX, GDPR, and so on.The new applied filters show up at the upper part of the screen. Note
that the Group: Compliance filter has changed color. You can always
use Clear filters to start your analysis and research from the
beginning.Using the search bar, you can narrow your results.
For example, let's look at rules related to GDPR use cases.
-
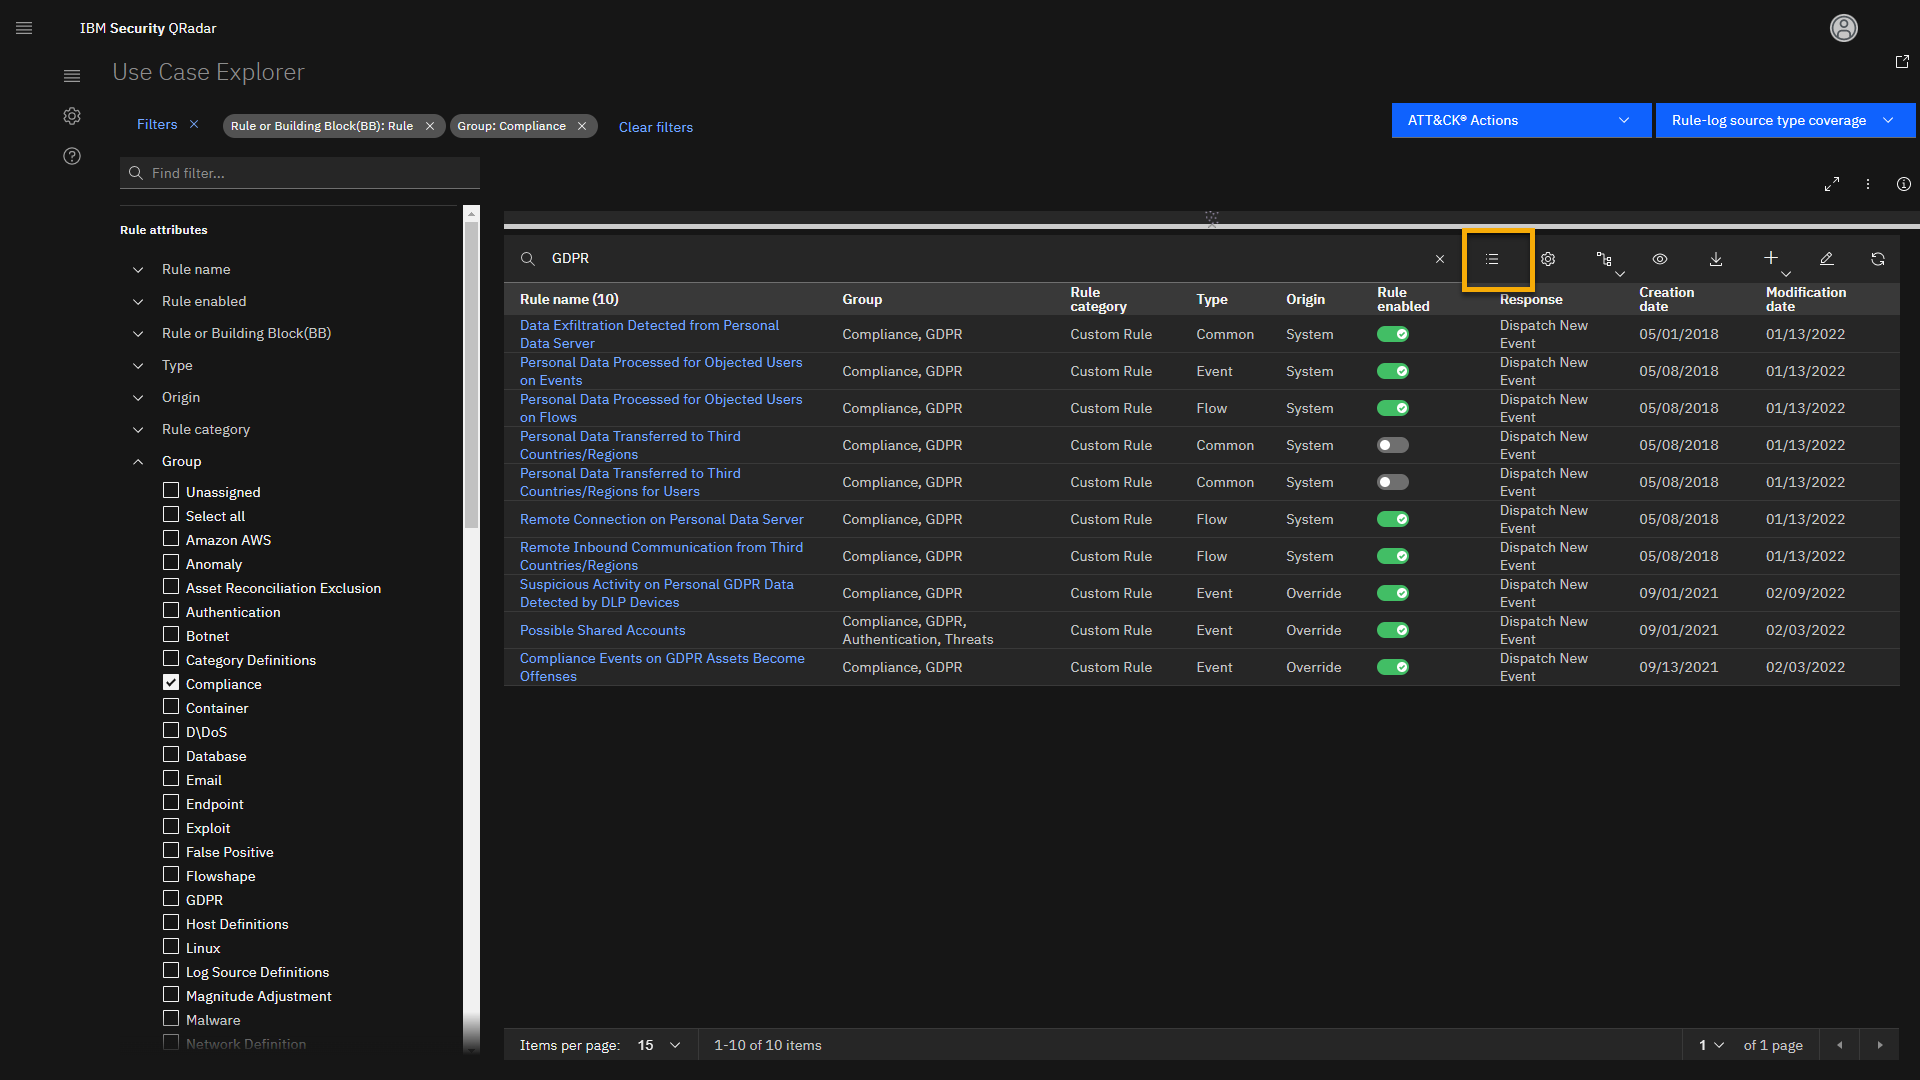
Click the search bar and type GDPR.
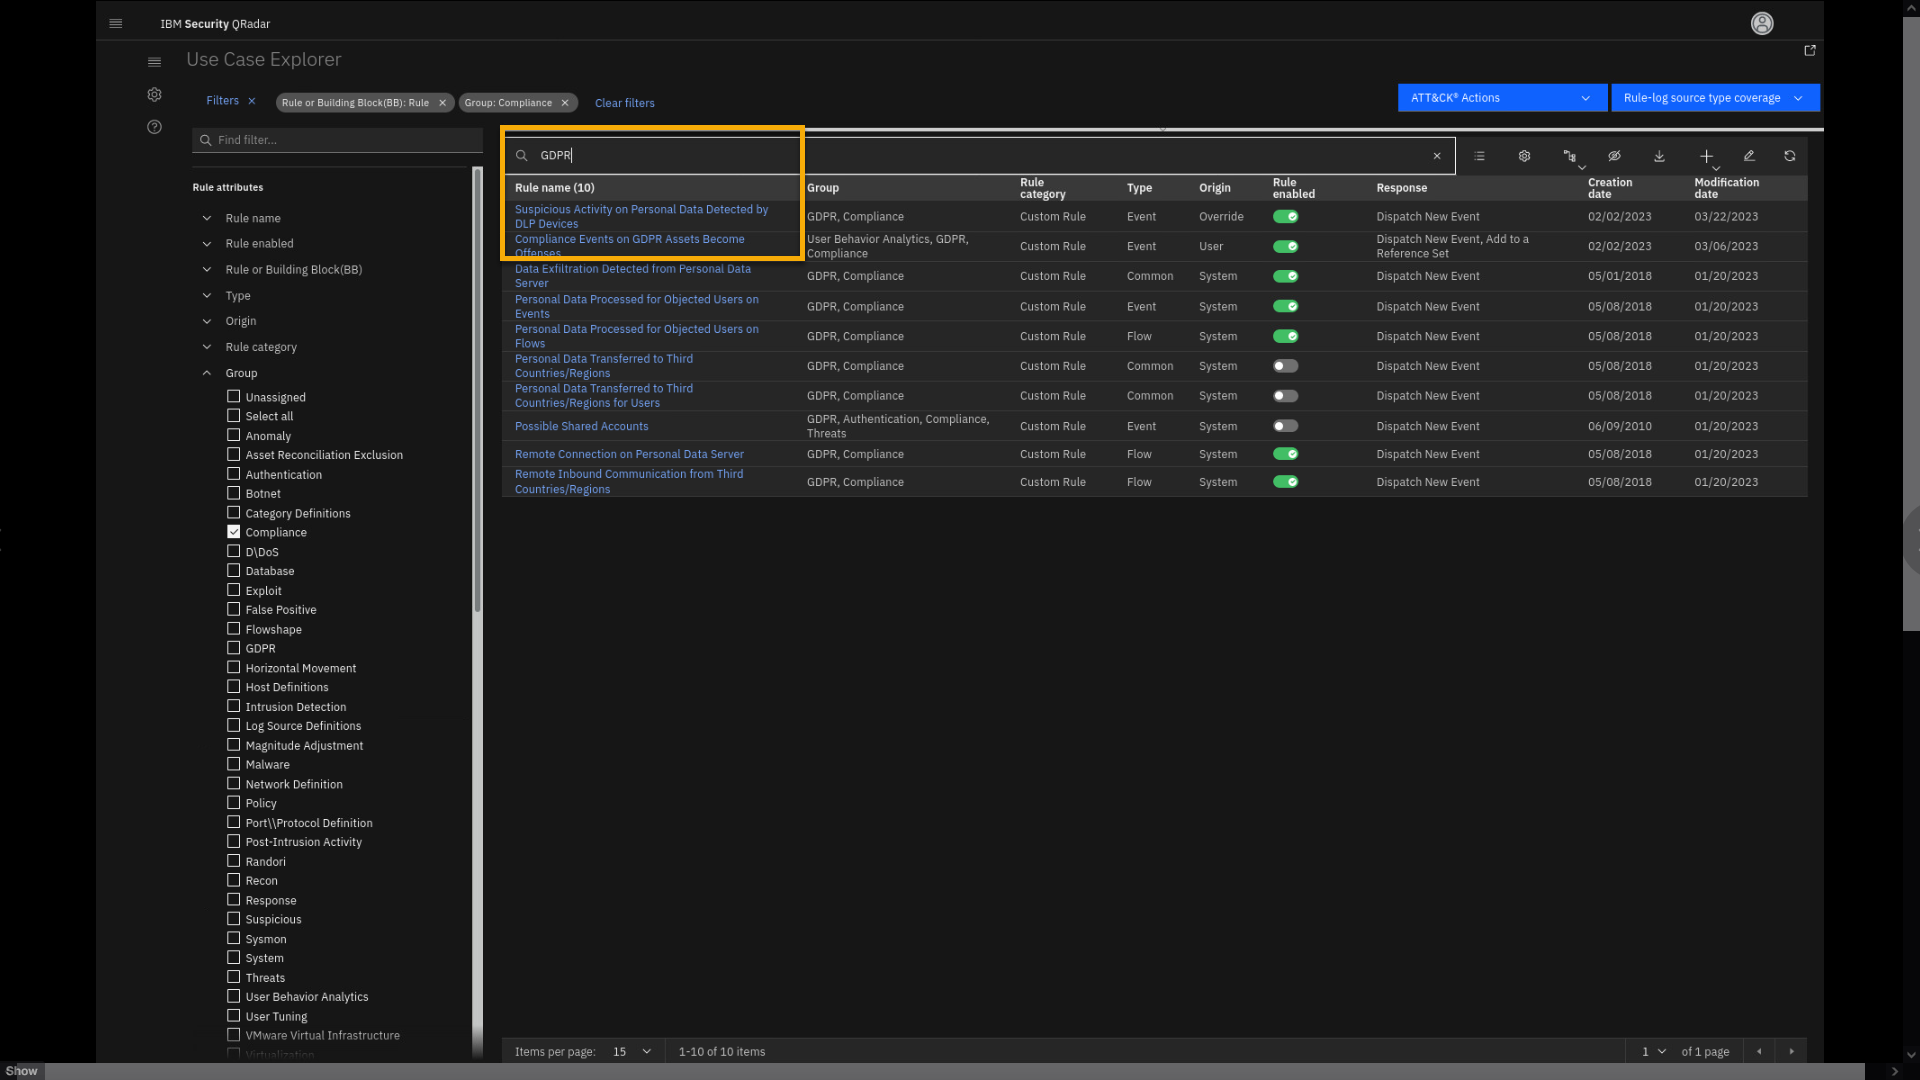
As a result, the rule list narrows the search to 10 rules related to
GDPR compliance. Notice that the list also contains our two rules (or
insights) that we demonstrated in the first part of the lab. Let's now
analyze the Suspicious Activity on Personal Data Detected by DLP
Devices rule (or insight) in more detail. -
Click the Suspicious Activity on Personal Data Detected by DLP
Devices rule. -
Review the displayed offense in the graph, then collapse the section
for Offense created by current rule in a certain time.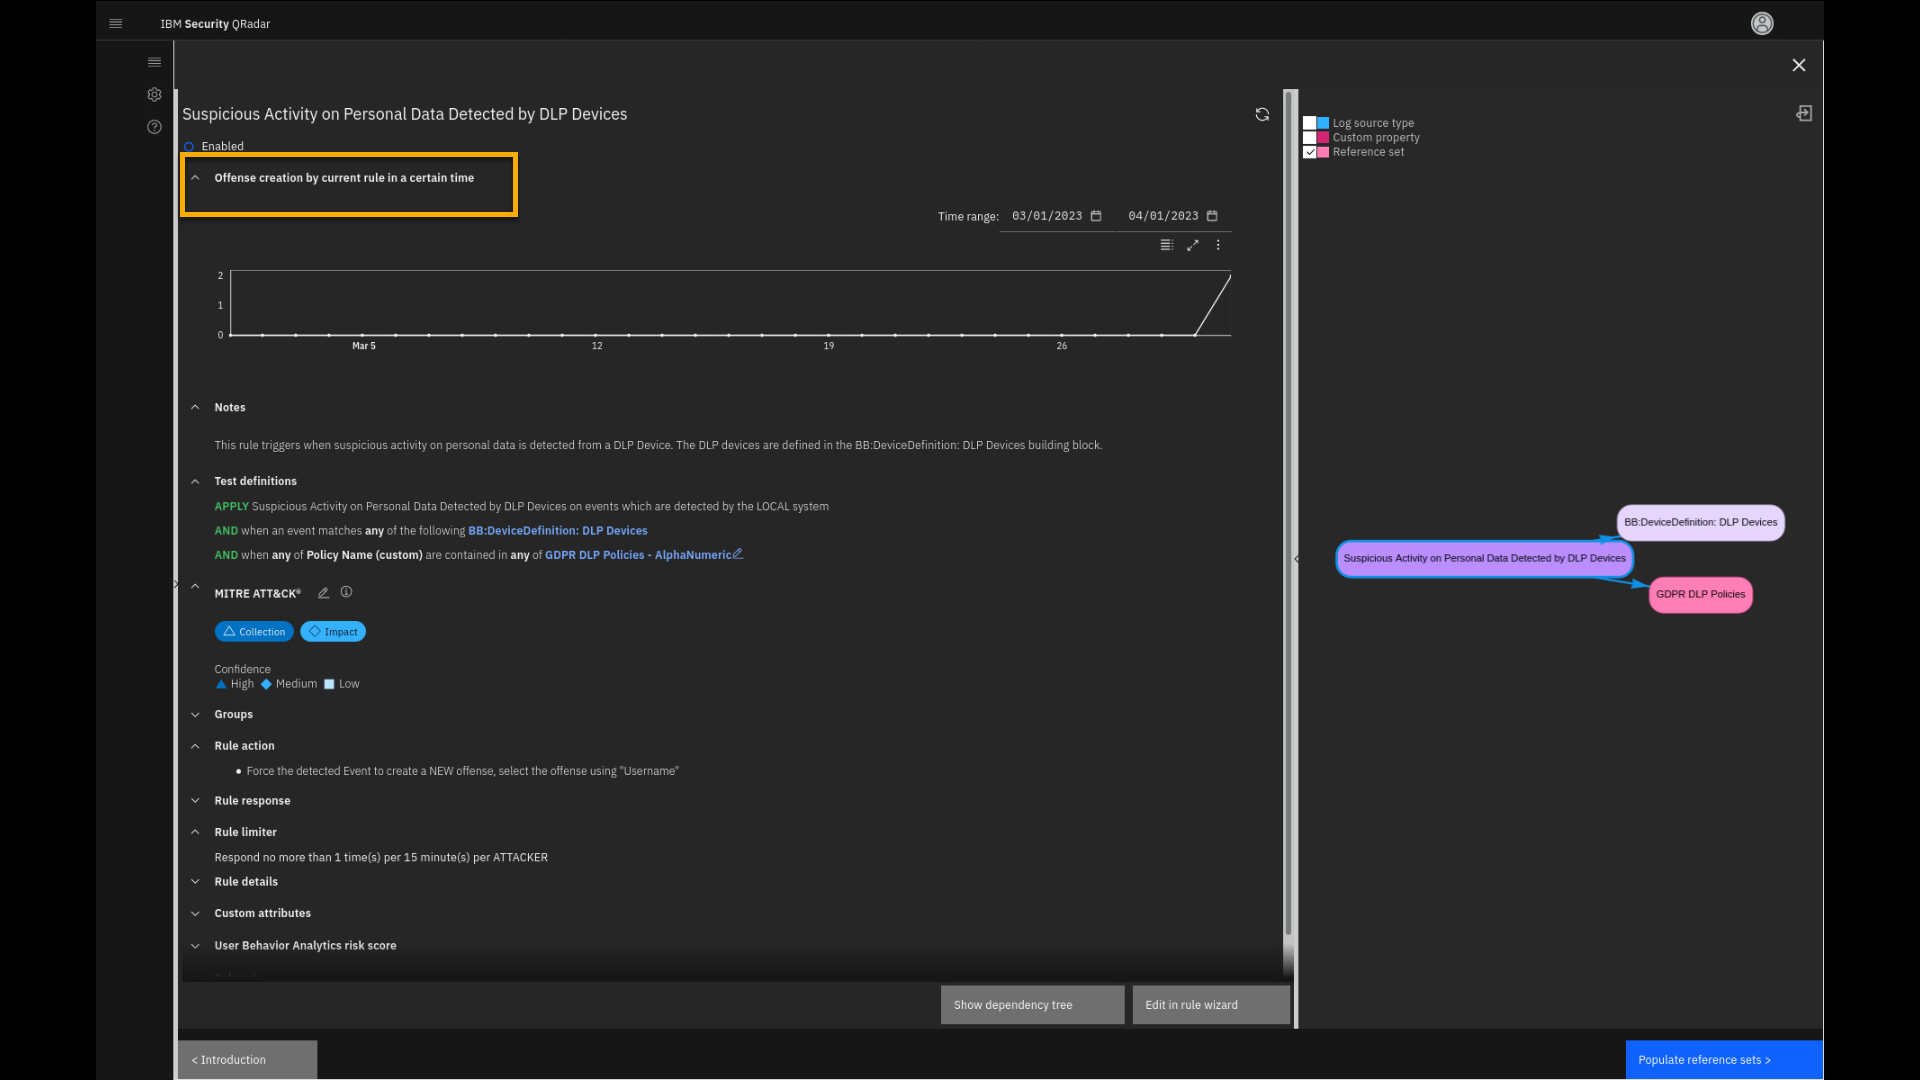
The new page loads, where we see the rule summary data. The section for
Offense created by current rule in a certain time shows how many
offenses the rule has contributed to during a specific time range. In
the Notes section, we see the description of the rule. Also, we see
the Test definitions we had already analyzed earlier in the demo.
You also see default MITRE ATT&CK coverage for this rule, which you
can edit and adjust if needed.The main region shows additional relevant information about the rule.
The Rule action section describes what happens if the rule triggers.
In the Rule response section you see that the rule creates a new
event and an offense with appropriate risk levels and event categories.The Rule limiter helps reduce noise if the events occur too
frequently. -
Scroll down if needed and click Log Source Types.
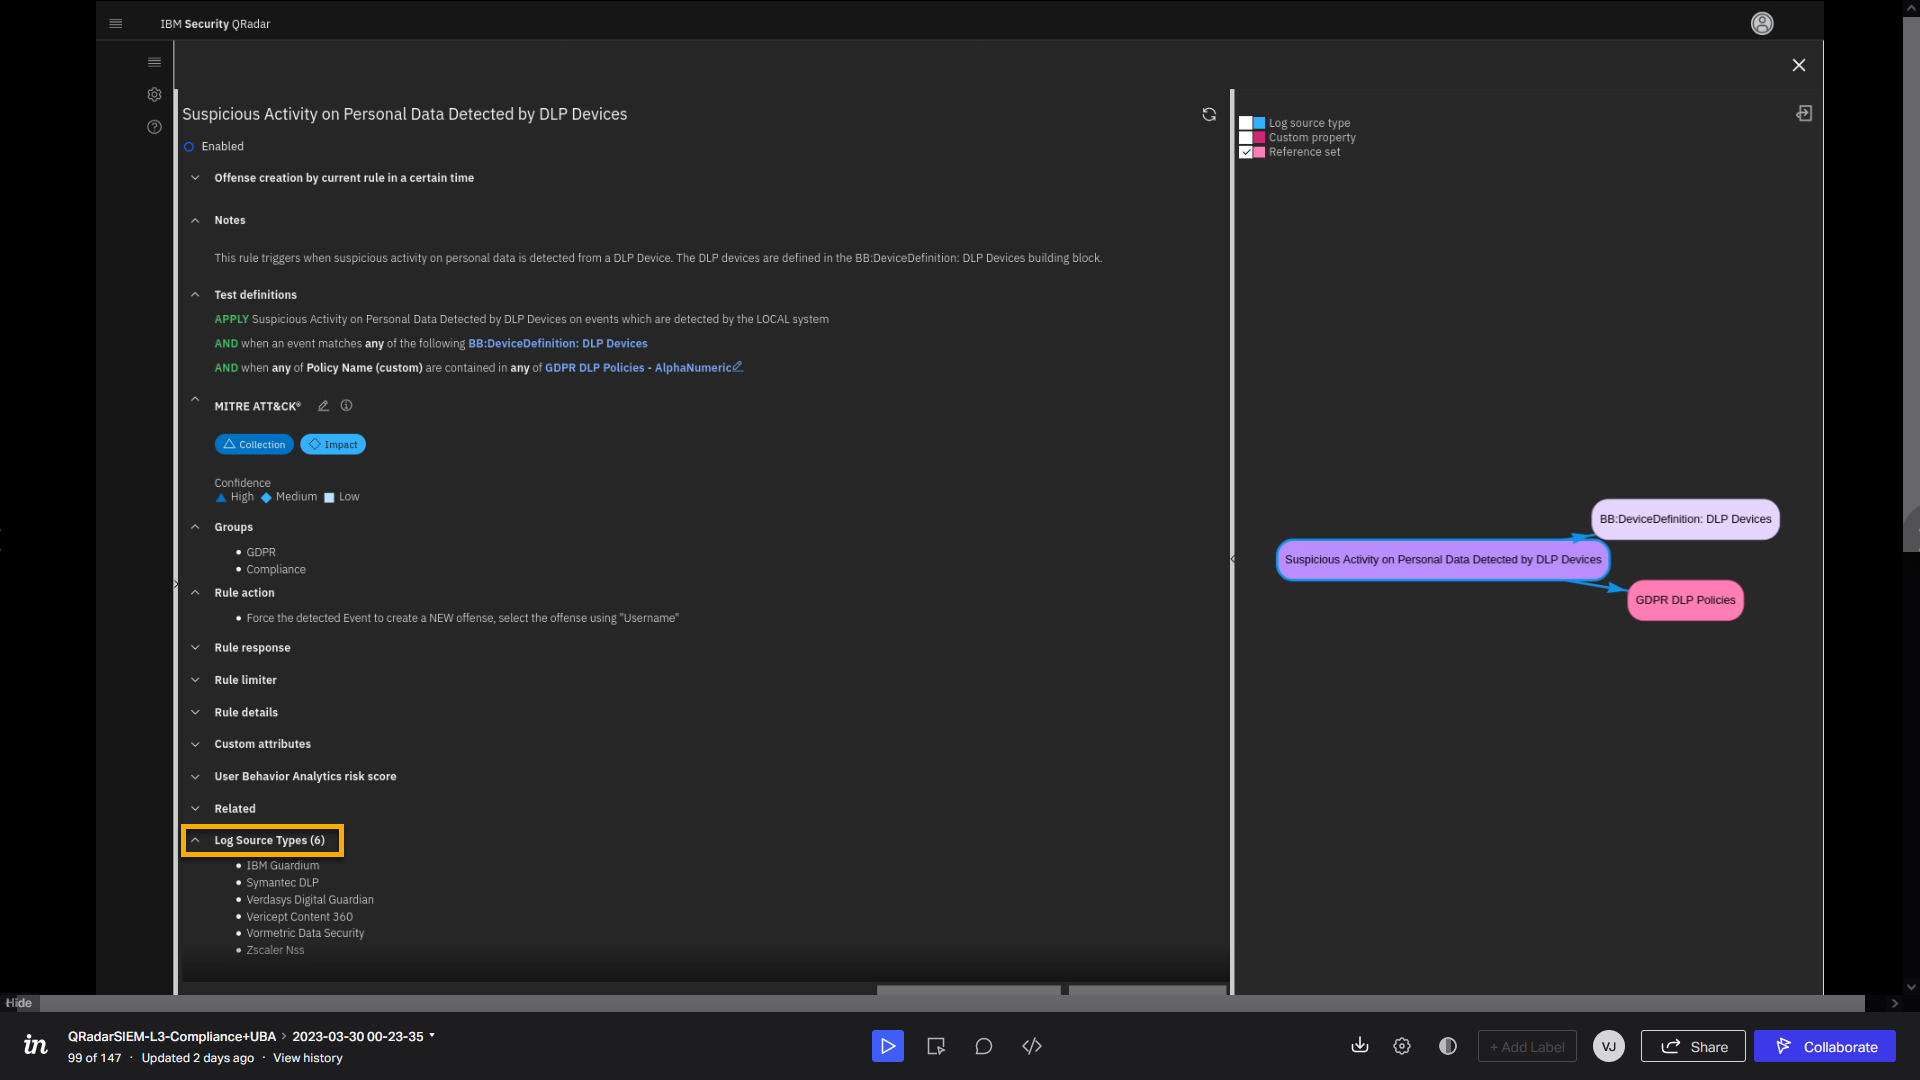
Also interesting is that you can review what type of log sources are
associated with this rule. We see one of them is IBM Guardium.Let's now focus on the right part of the page. Here you see the
relationship graph among different elements of the rule. -
In the relationship graph, select Log Source type and Custom
property.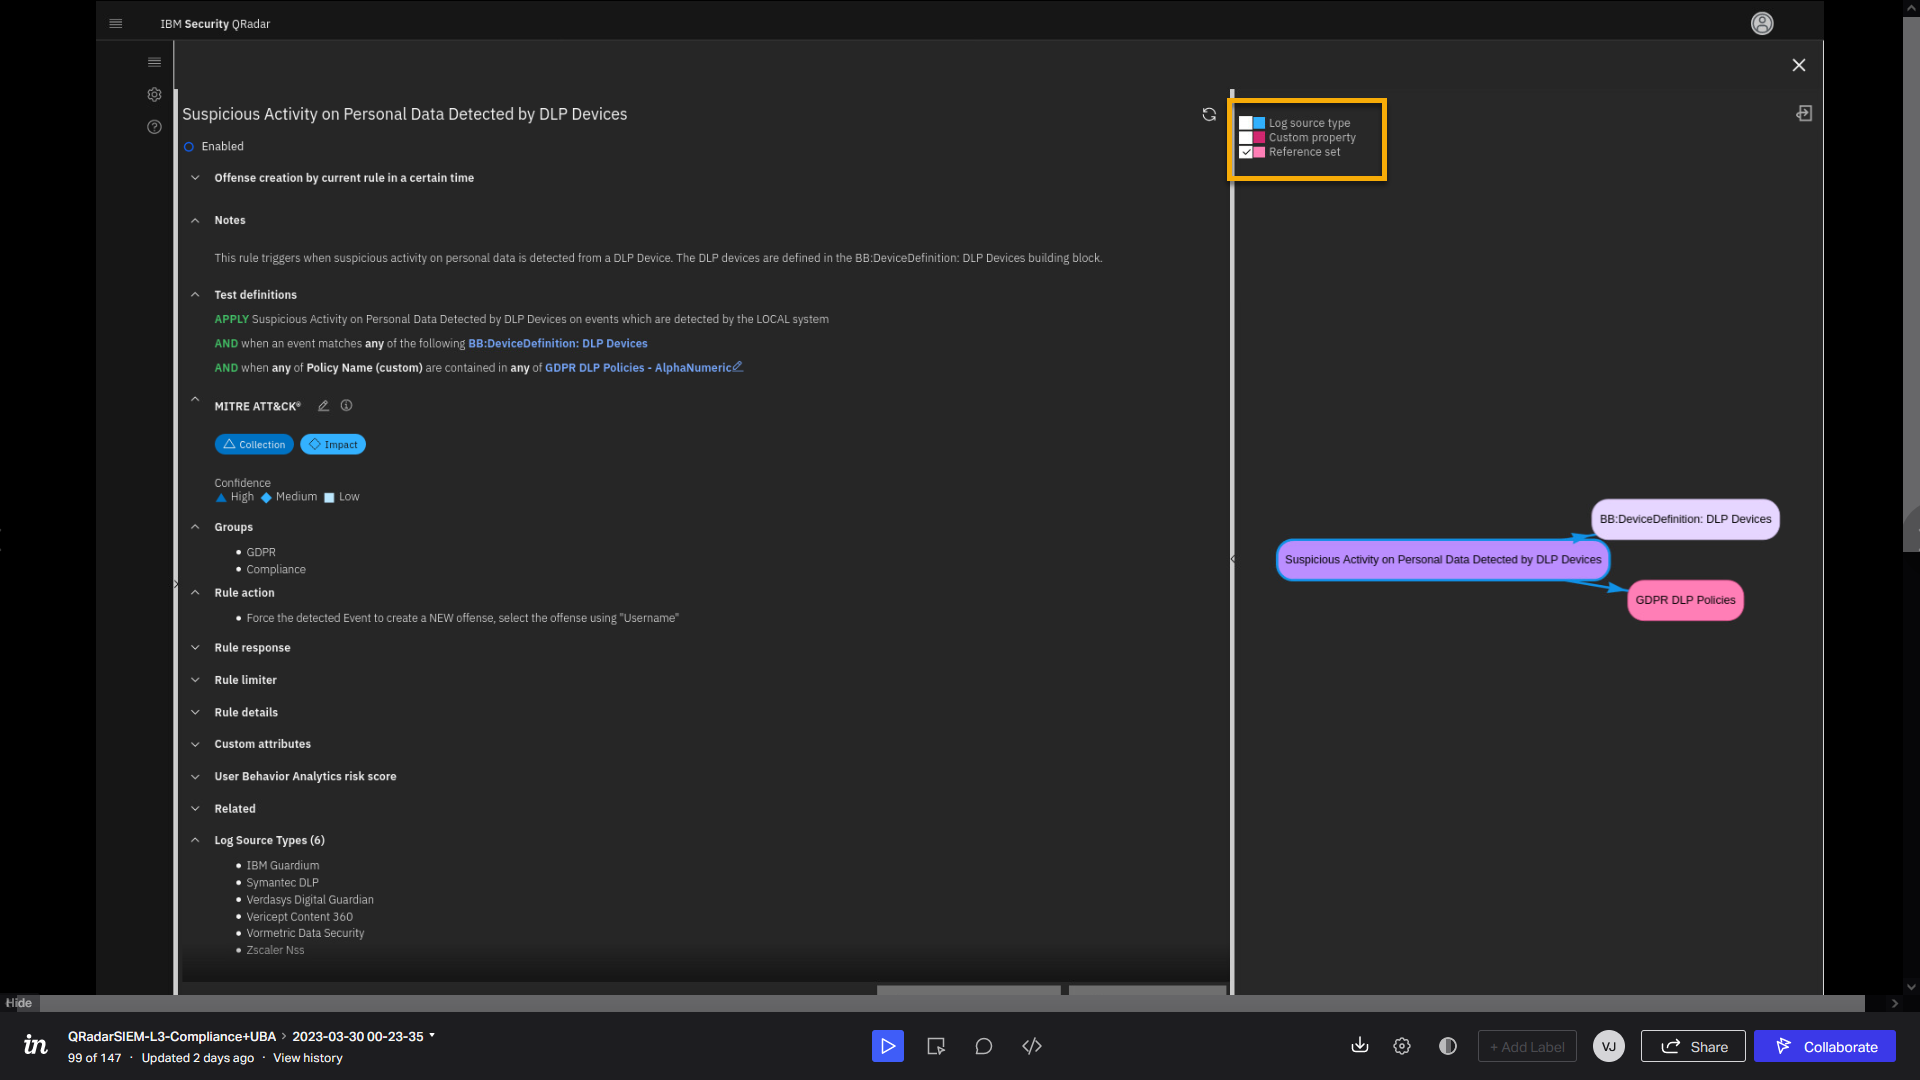
We can drill into the dependency analysis by selecting the Device
Definition: DLP Devices building block. -
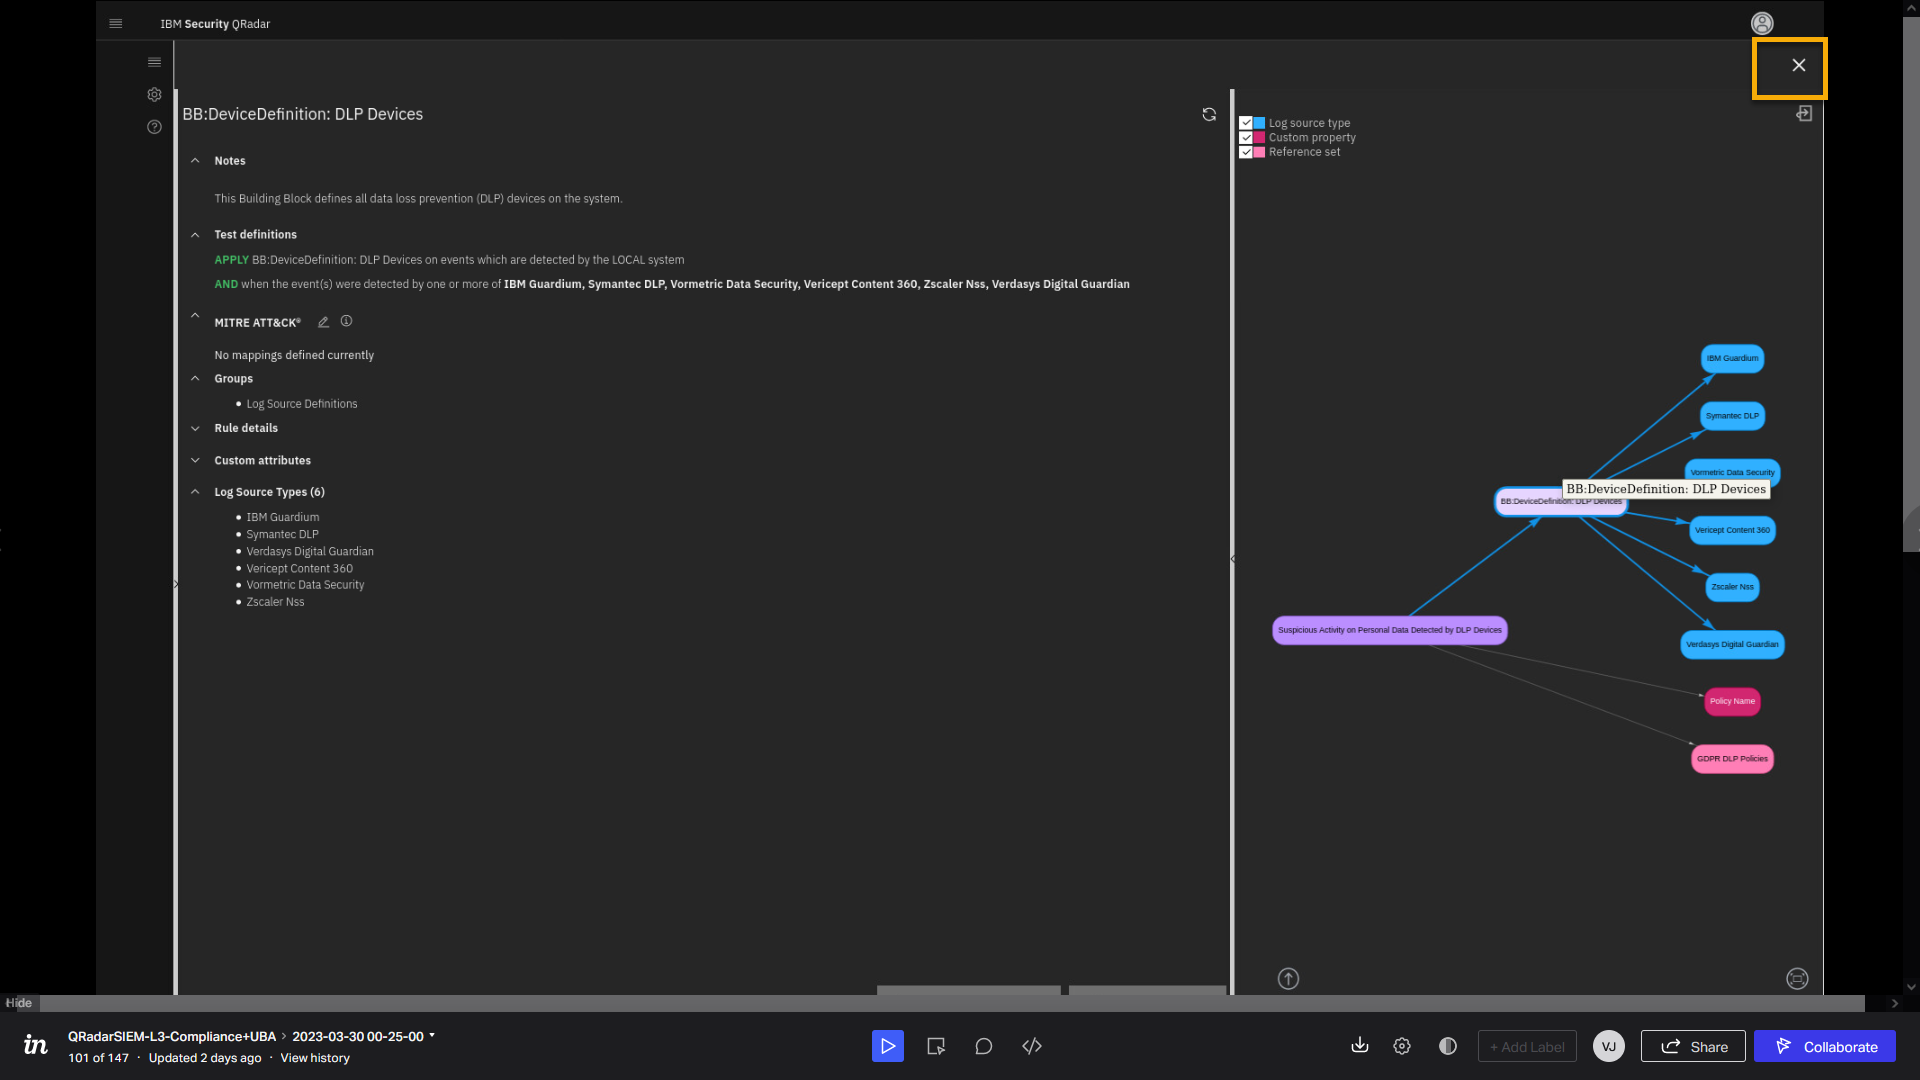
In the relationship graph, select BB:Device Definition: DLP
Devices.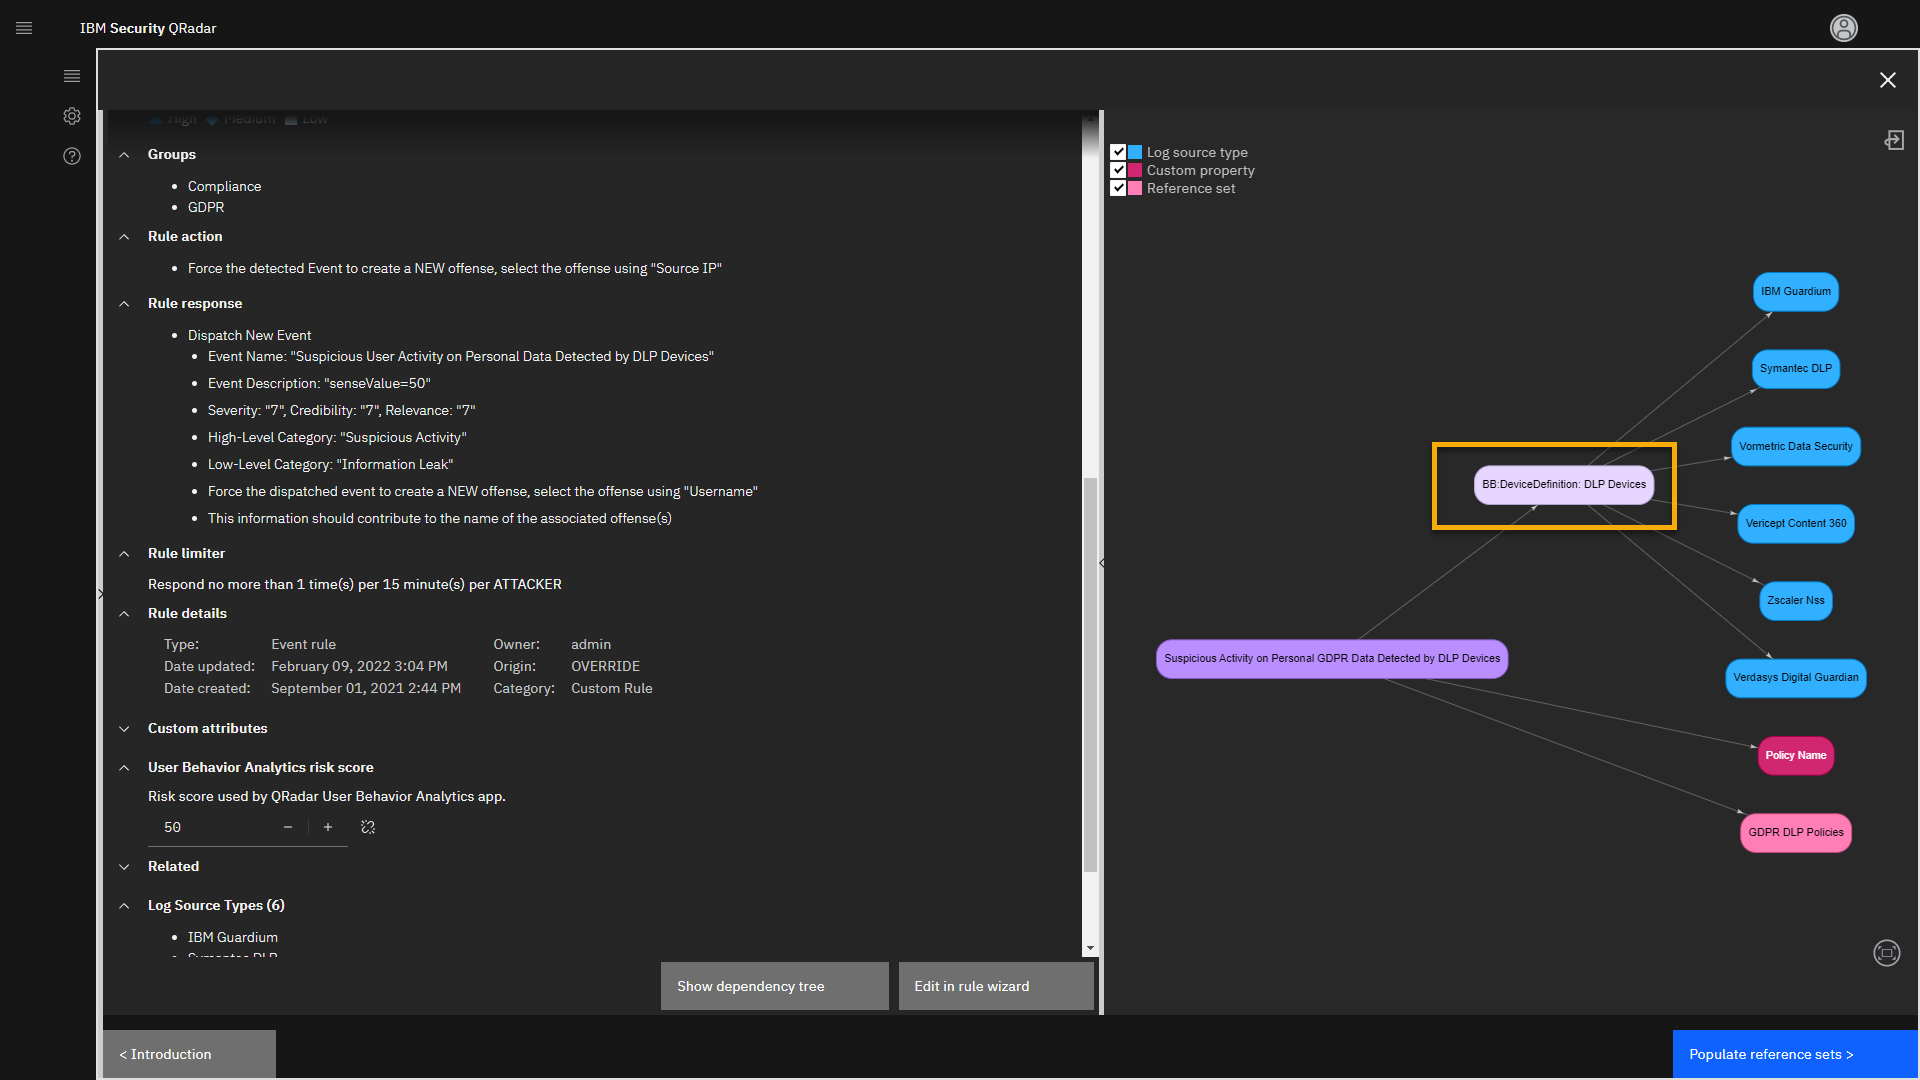
This action opens the description of the building block on the left side
of the screen.The Building Block is a special type of rule that can trigger once and
can be reused for unlimited times in other rules. It is
a nested rule that improves QRadar performance because it is tested only
once but can be used multiple times.From the test definitions, you see that the IBM Guardium log source on
the local network is recognized as one of the DLP devices. -
Click Populate reference sets.
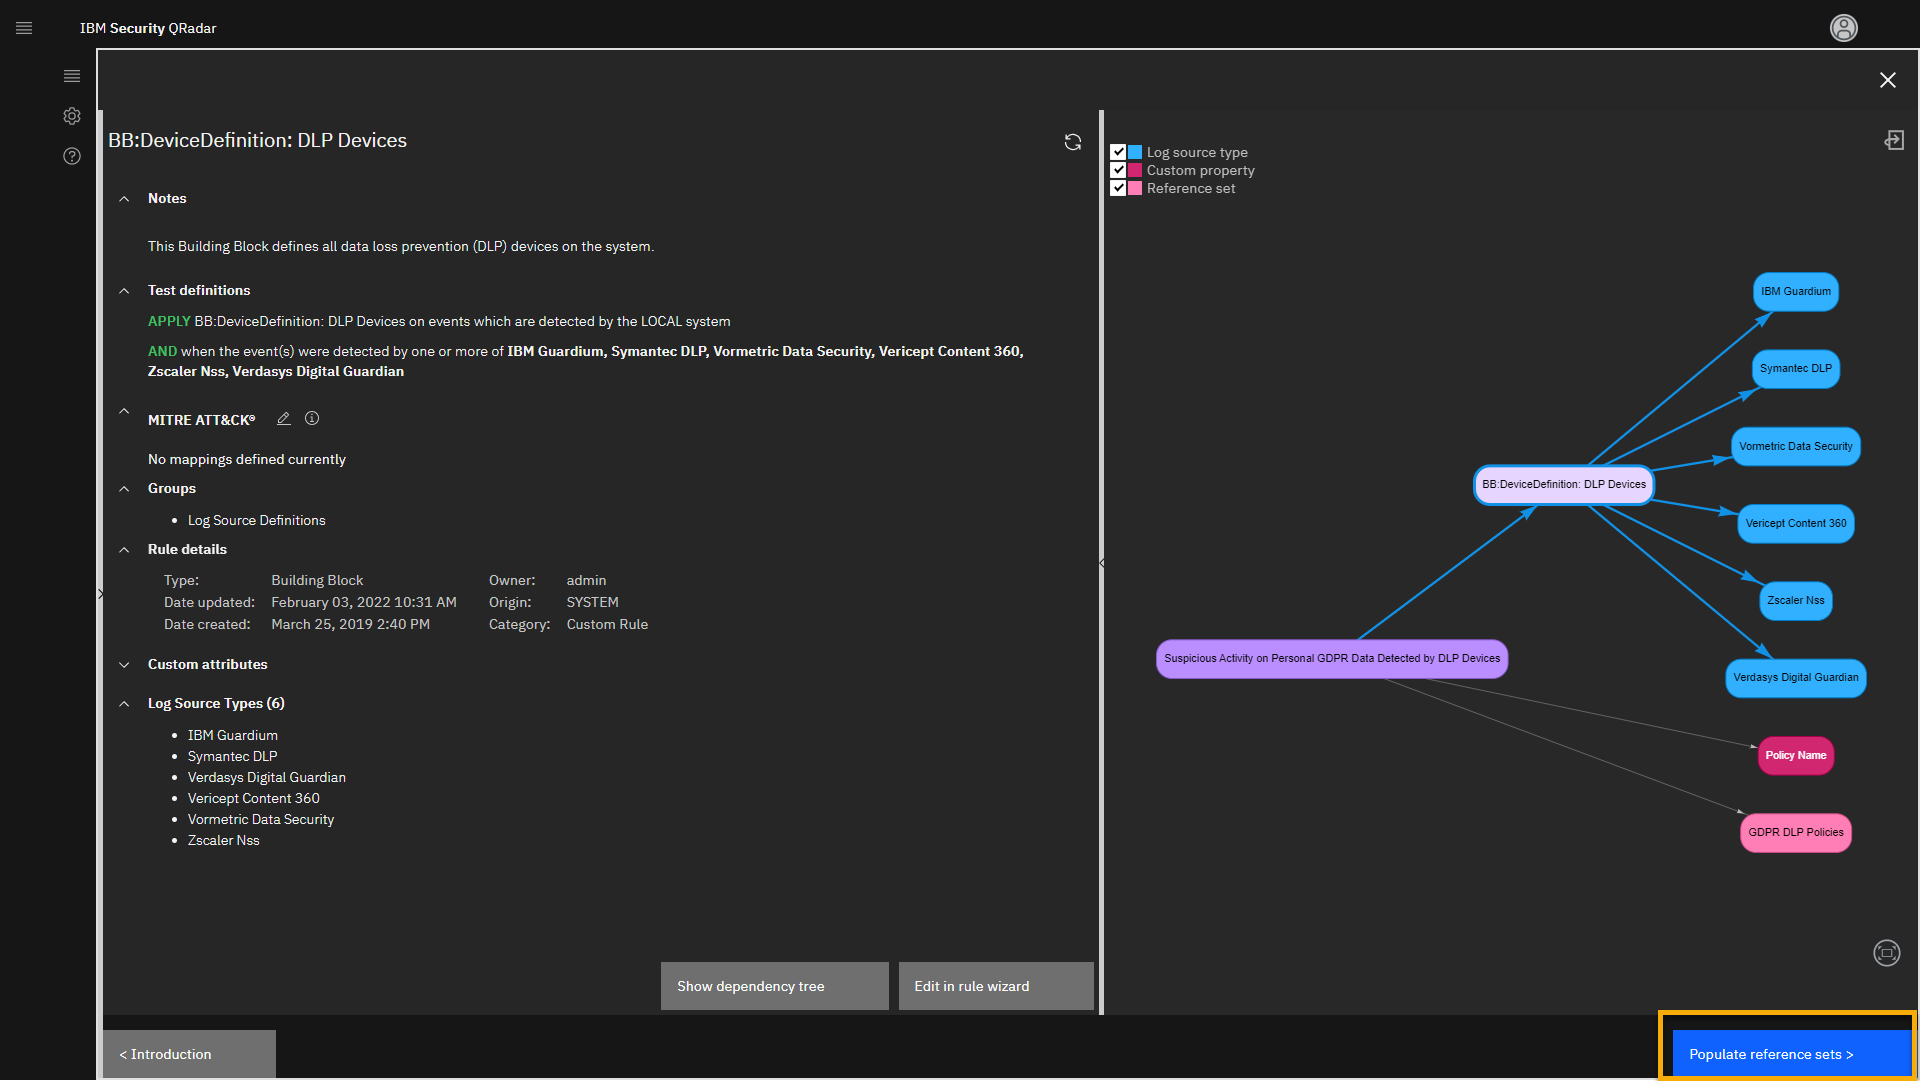
The screen focuses on the reference set. Let's review it.
-
In the middle of the screen, click GDPR DLP Policies --
AlphaNumeric.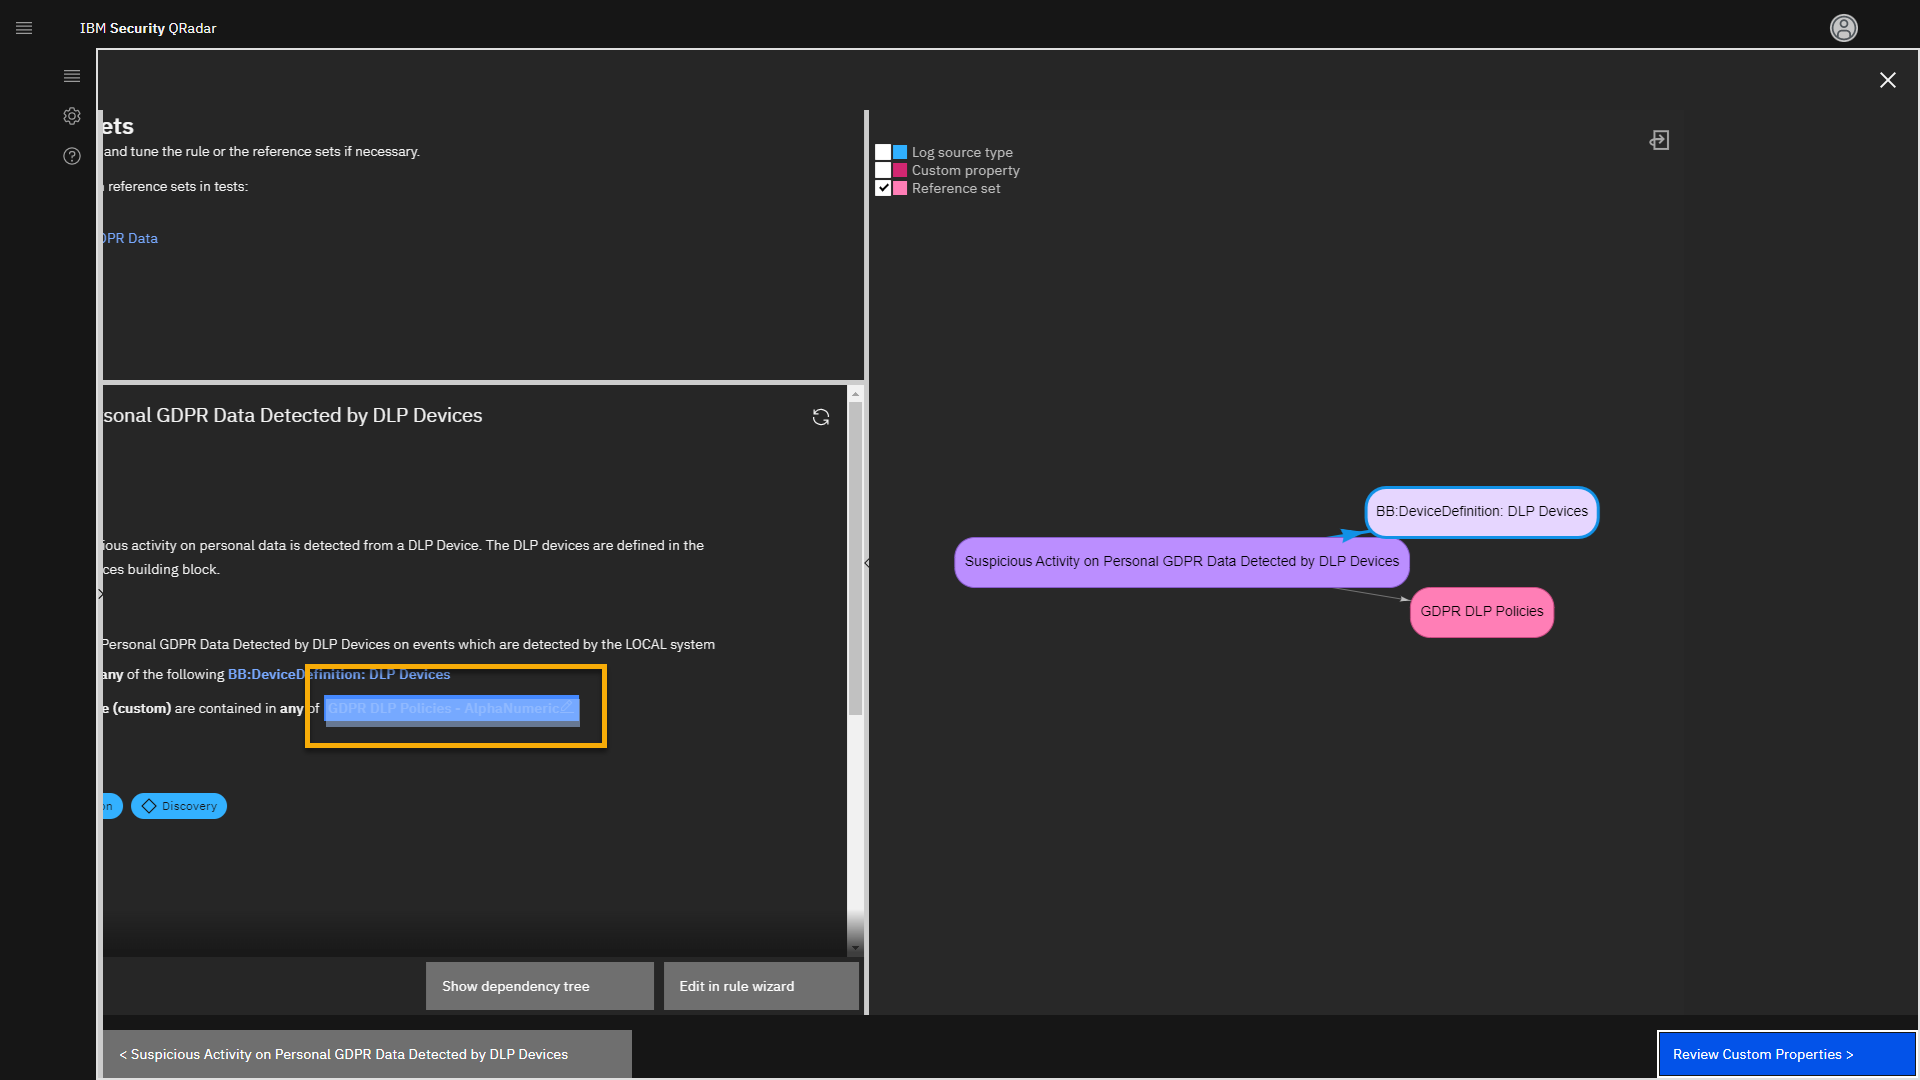
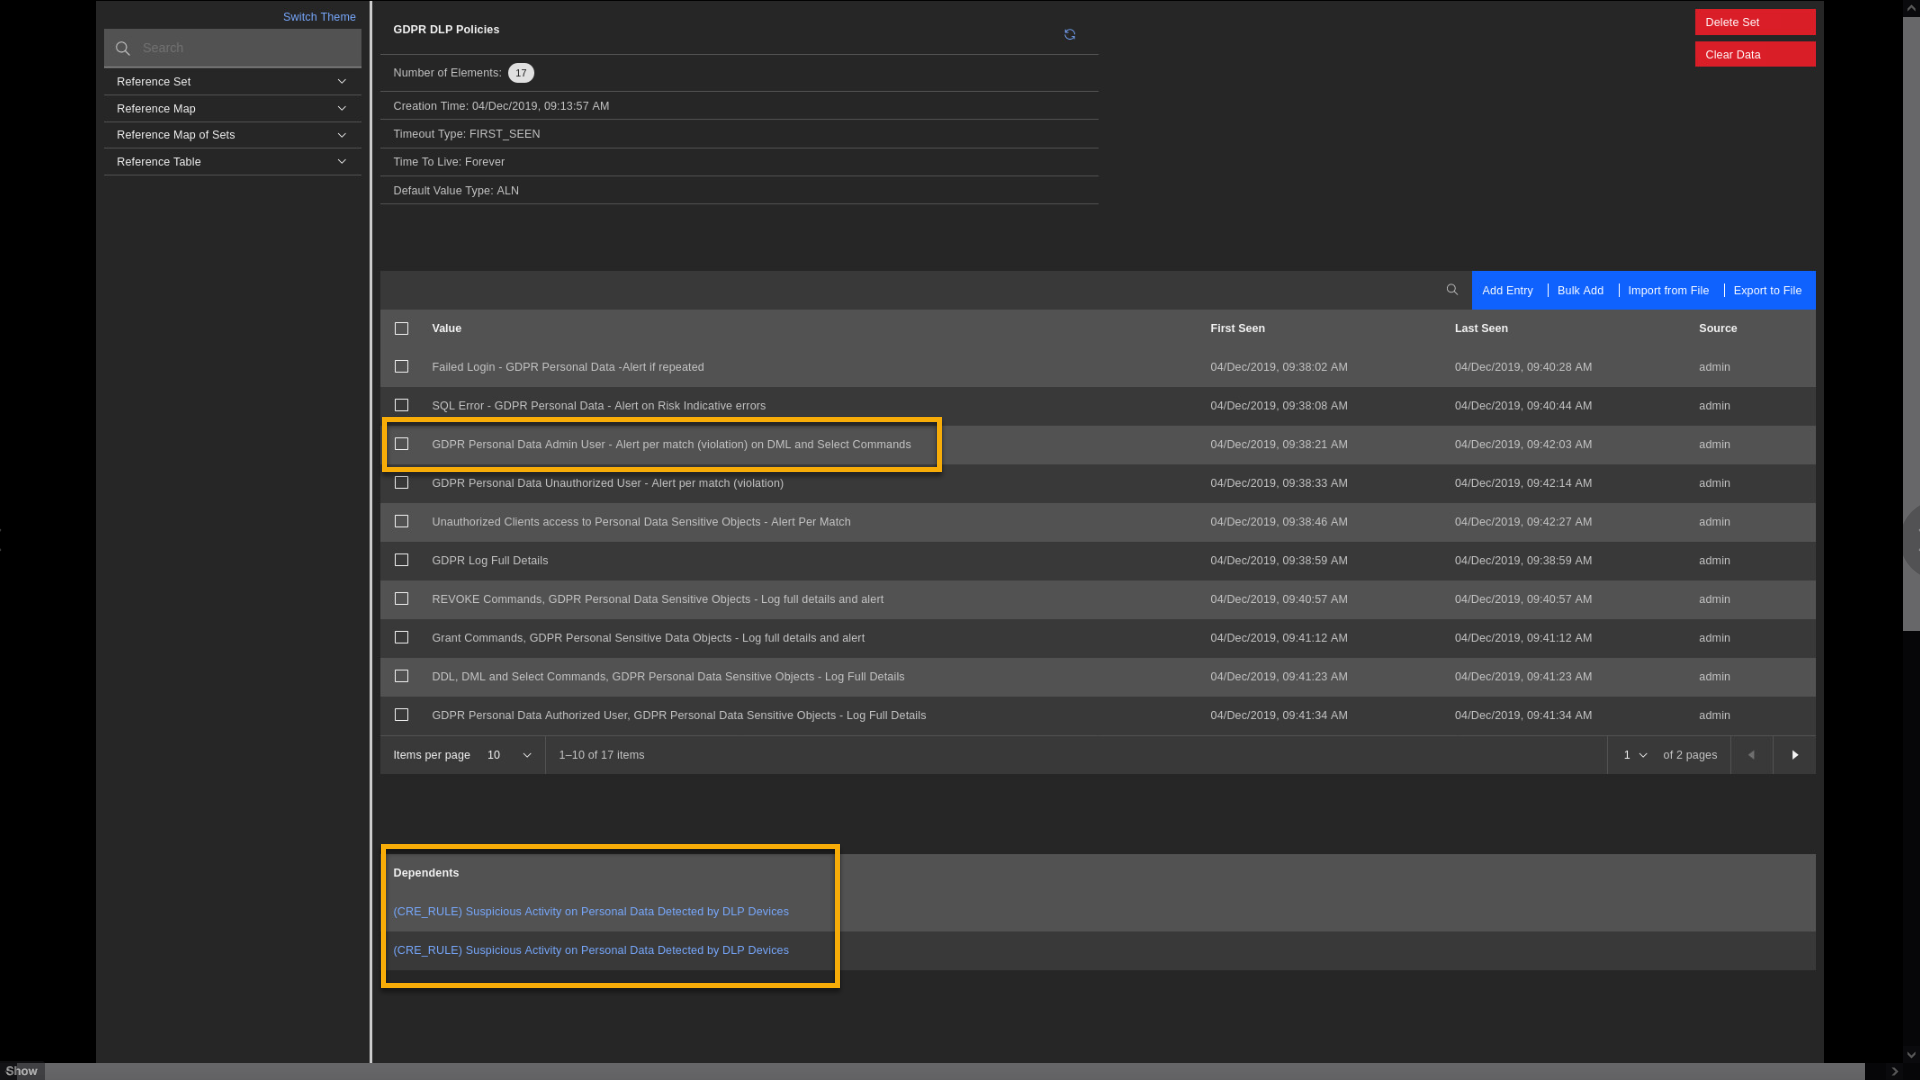
Reference Data Manager - overview
This action opens a new app called the Reference Data Management app
on a new browser tab. This app manages your reference data collections
that are used in the rules (use cases). Those reference data collections
can be multidimensional, but the most used type is a simple list, also
known as reference sets. One of the reference sets is the GDPR DLP
Policies. We see that it currently has 17 elements, and those are
different events that can be observed on DLP devices, such as IBM
Guardium. If you need to expand your coverage to other DLP events, add
more line items to this reference set.
Notice that one of the listed polices is the Guardium policy that we
analyzed earlier in the GDPR offense -- GDPR Personal Data Admin User
-- Alert per match (violation) on DML and Select Commands.
Let's also review another reference set that we discussed earlier in the
demo: Personal Data Servers. For more efficiency, click in the search
field and type Personal.
-
In the left part of the screen, click Search and type Personal.
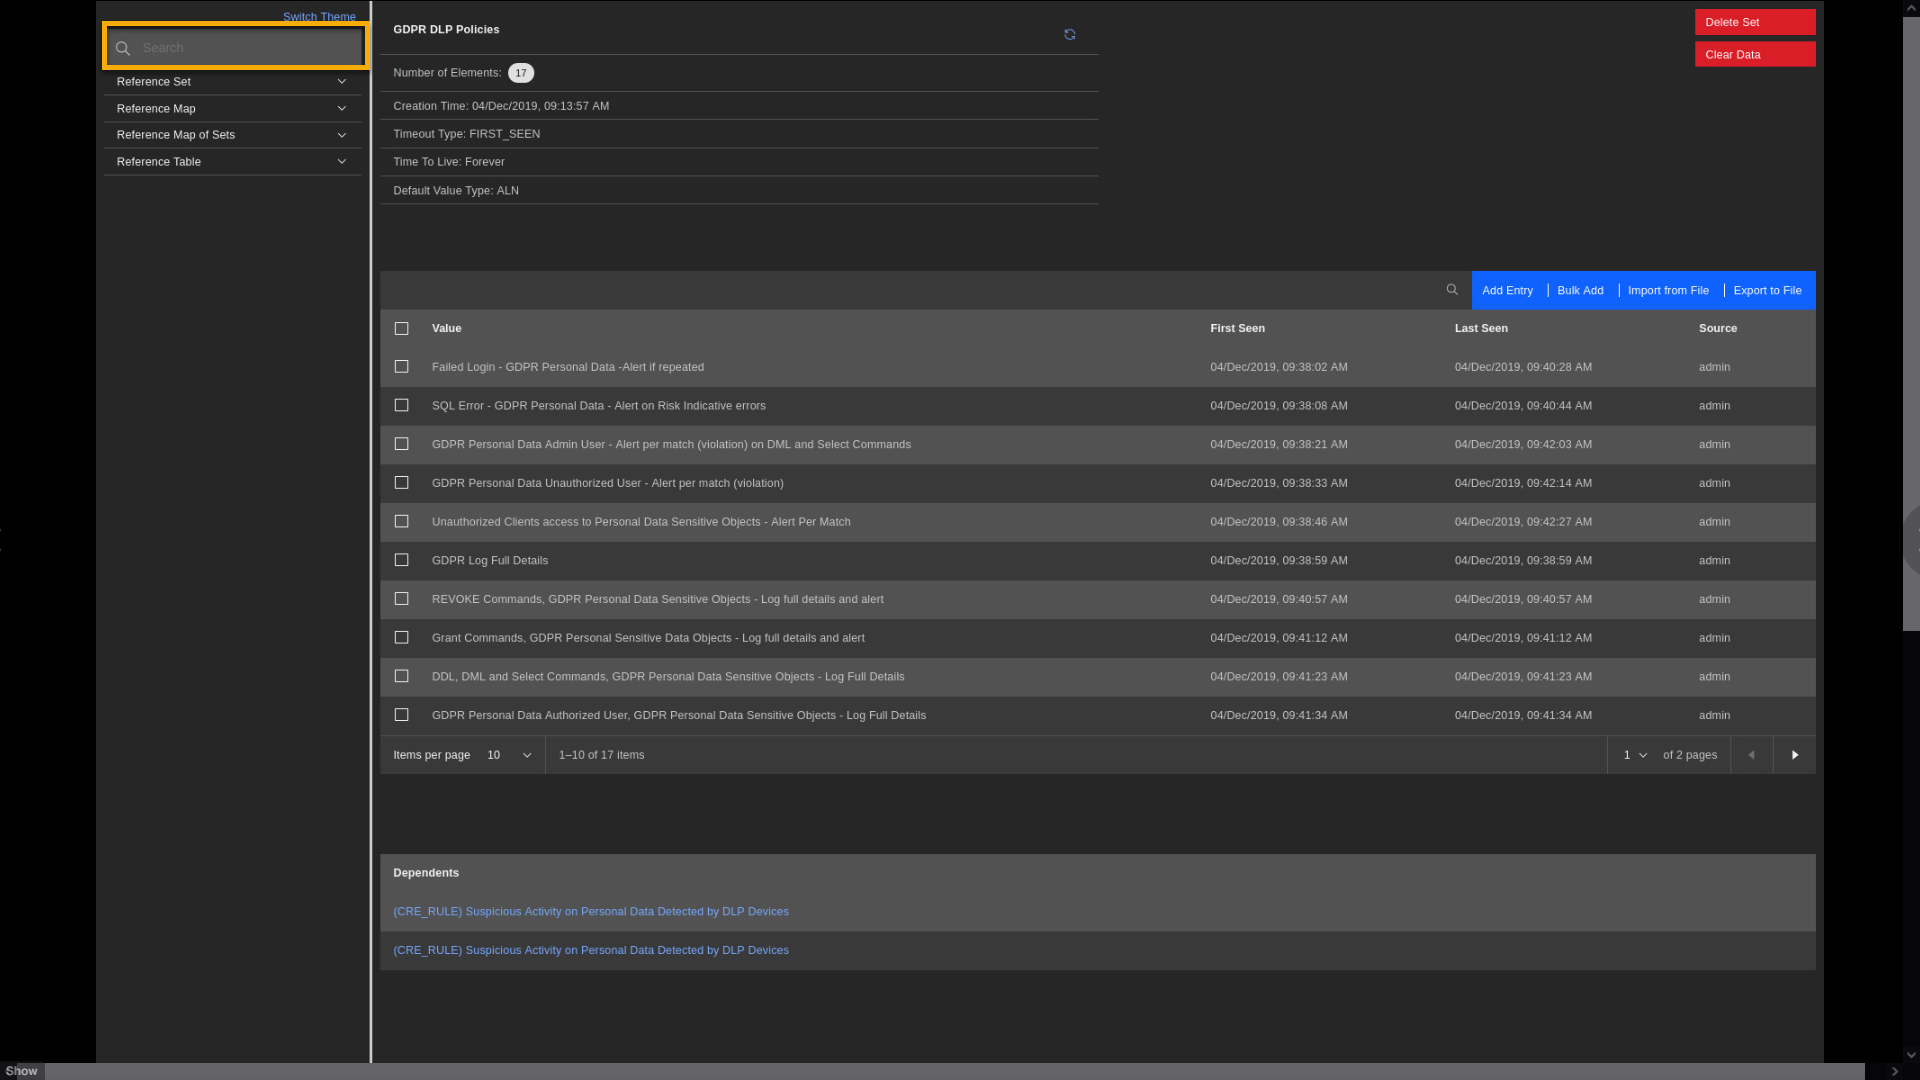
Then click the Personal Data Server reference set.
-
Click Personal Data Server.
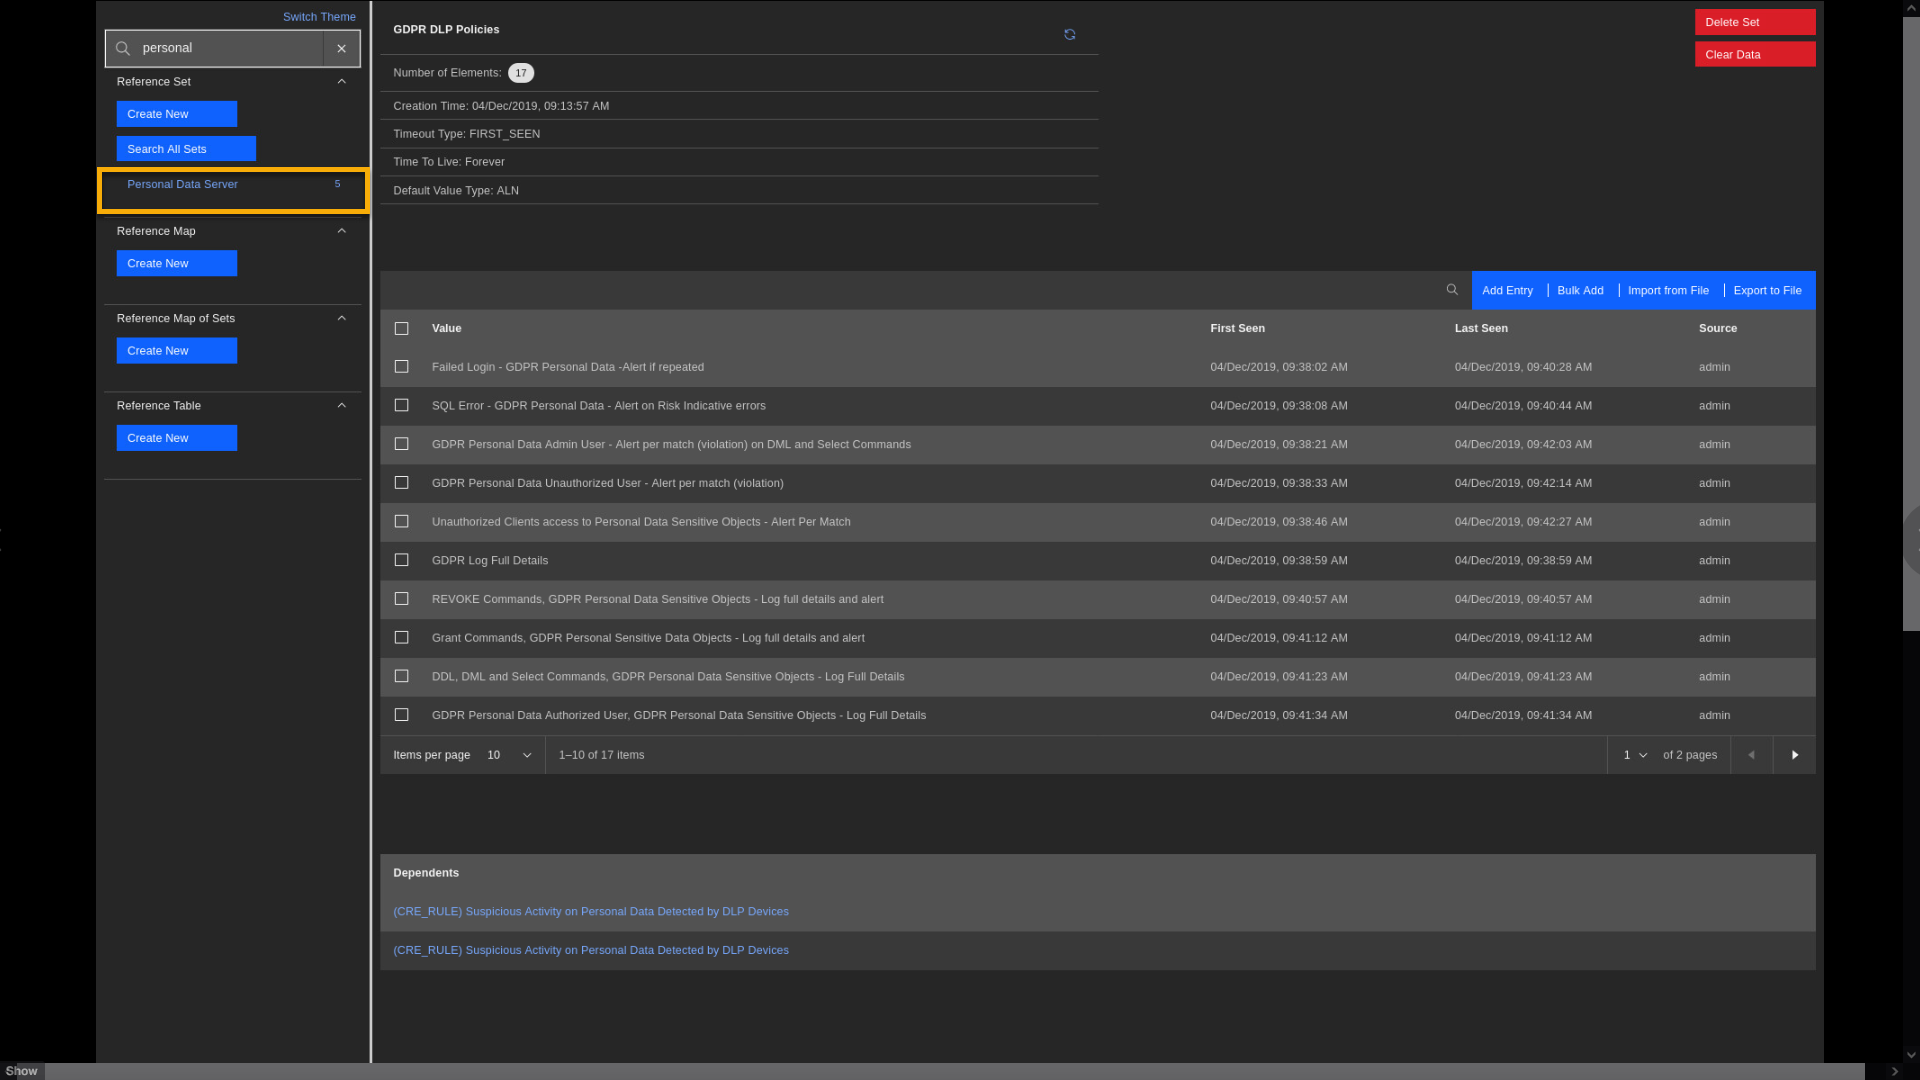
Observe that five network IP addresses are defined as the servers with personal data. One of them is IP 10.4.0.26, detected earlier in the demo. At the bottom of the screen, you see Dependents where this reference set is used. One place is the building block BB: Compliance Definition: Personal Data Servers. Quick reminder - that is the building block that links to the Suspicious Activity rule that triggered in an earlier part of the demo.
This shows the picture of how the parts come together to identify servers holding PII.
-
To go back to the UCM app:
- Close the Reference Data Management tab.
-
Close the rule analysis window.
Now, let's observe another powerful UCM feature. As mentioned, the app
comes with some preloaded filters. Let's load another filter that helps
us review all non-installed content. -
Click the Select template icon.
-
From the pop-up window, scroll down and select All non-installed content.
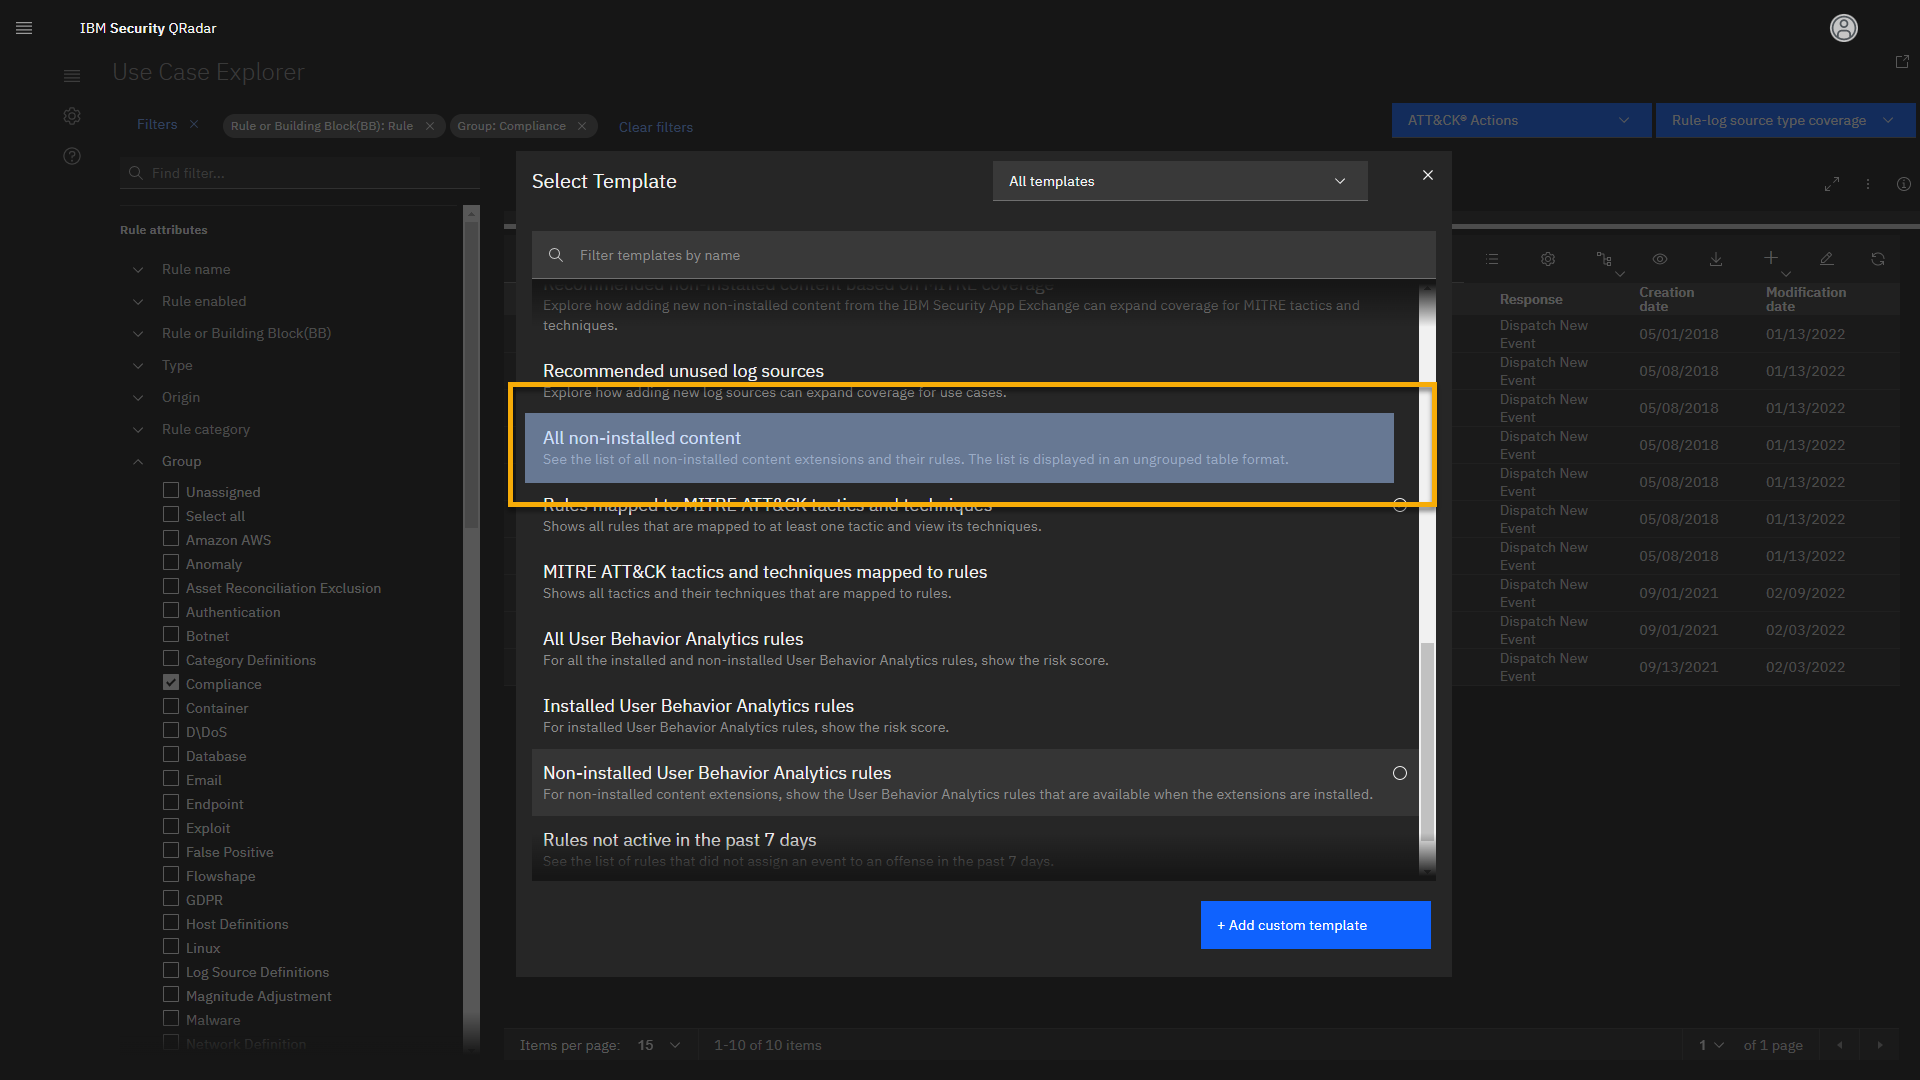
-
Review the loaded page.
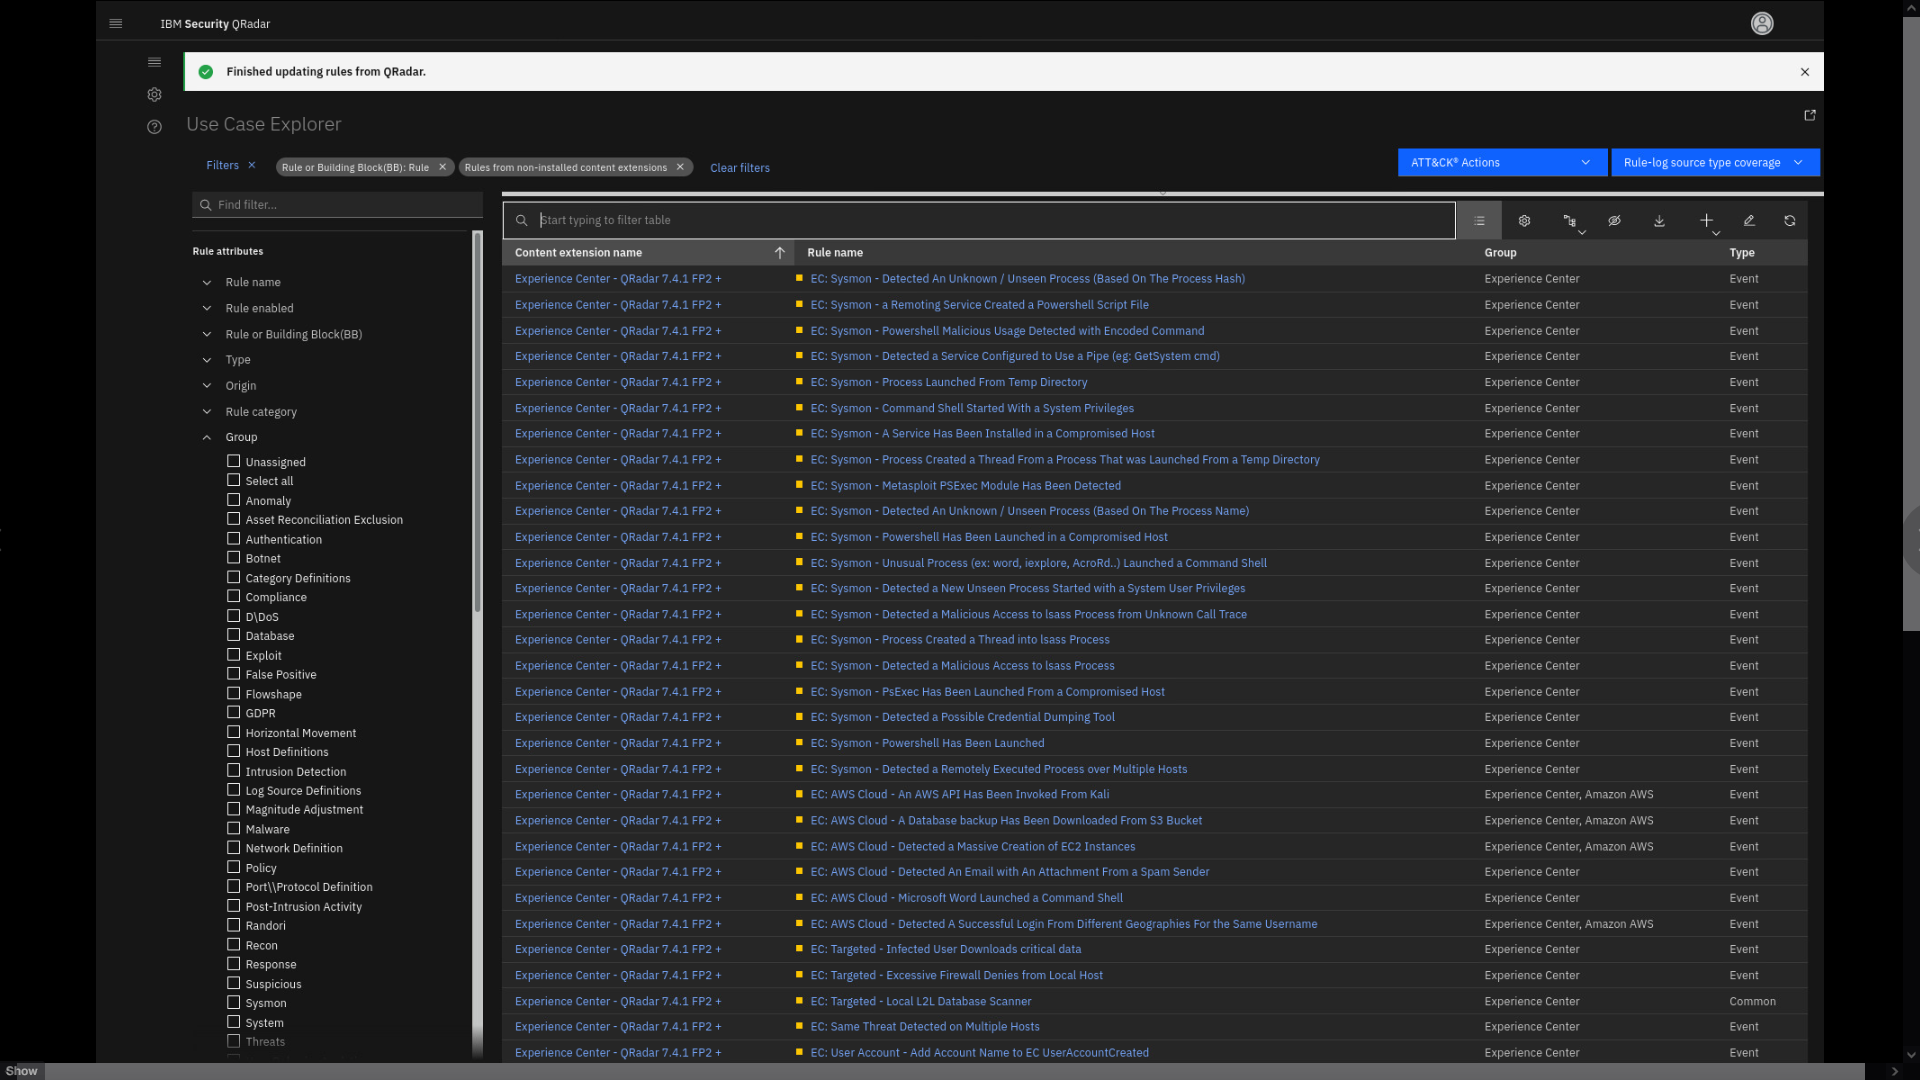
The new view loads. Here you can see all available content that you can
download from the IBM App Exchange and add to your QRadar SIEM
deployment. You can narrow down this list by using the search bar. For
example, let's look for some ISO 27001 compliance content. -
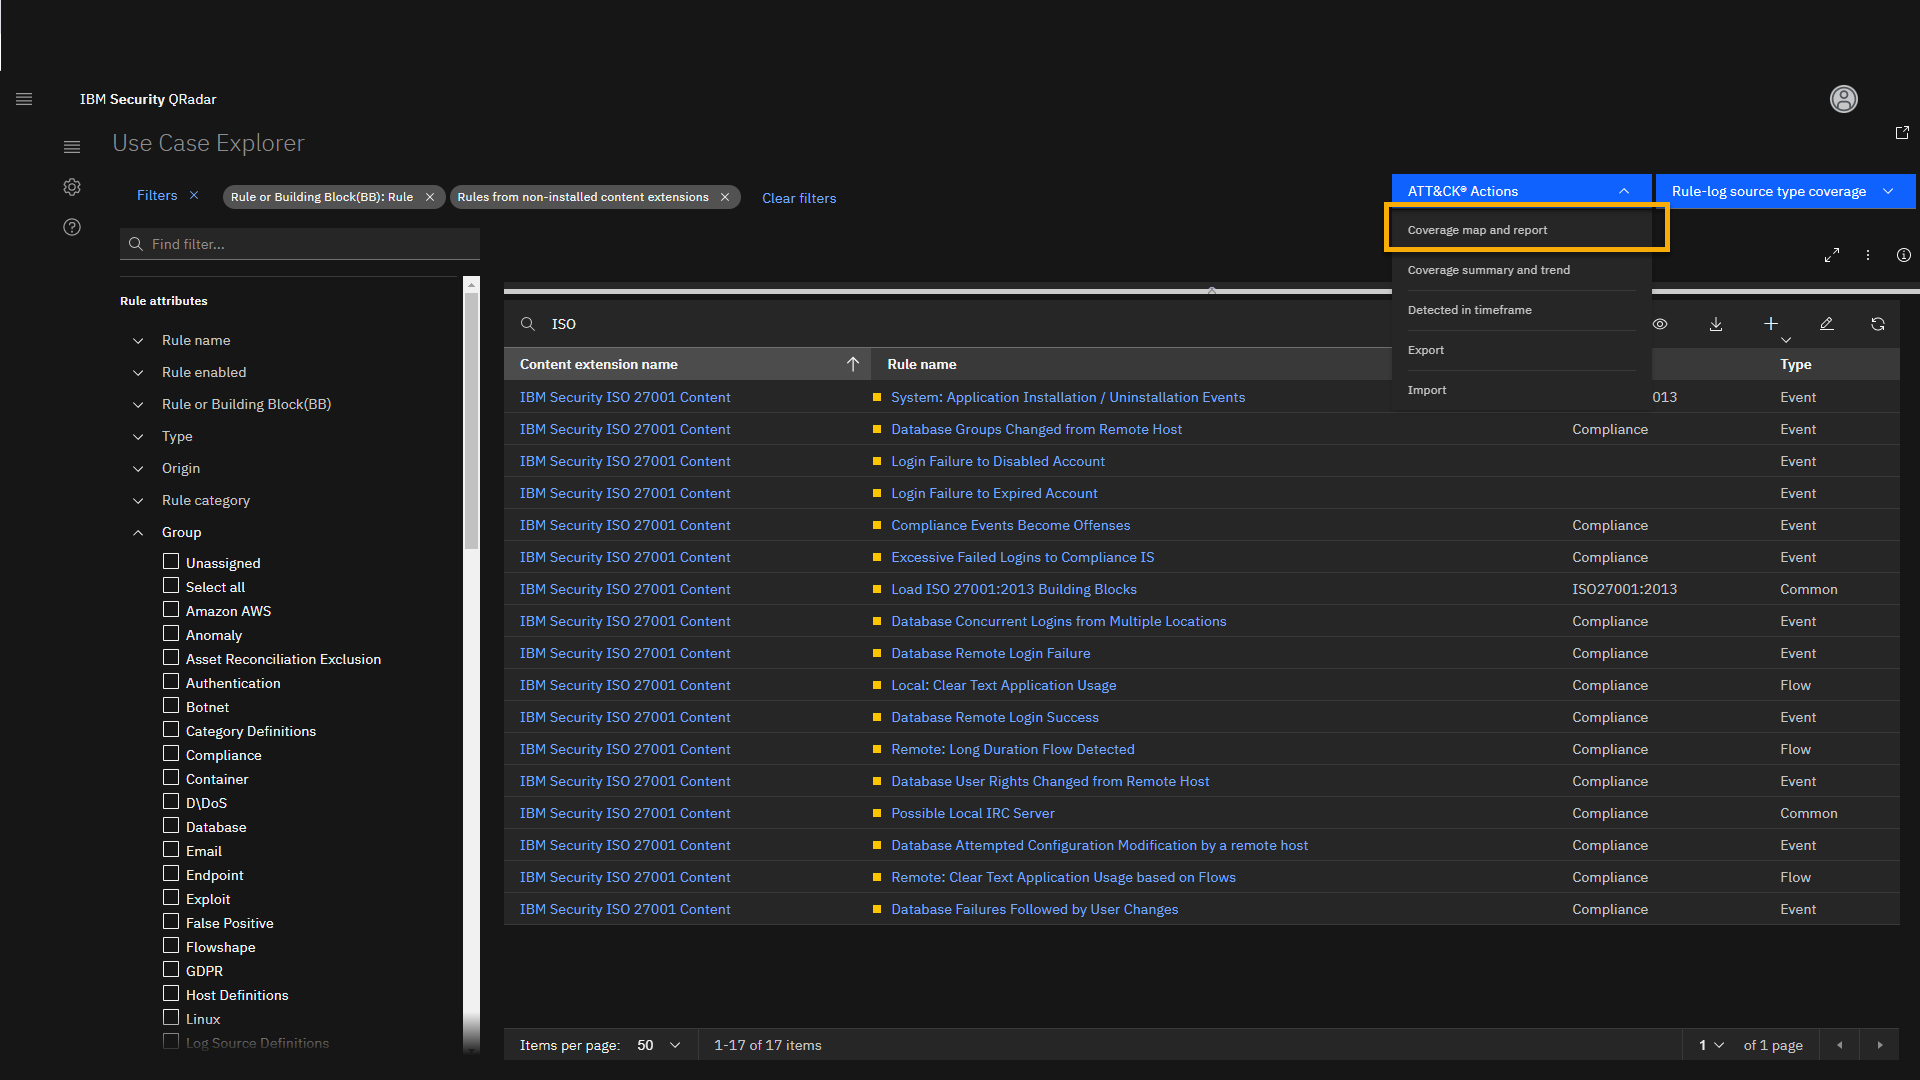
Click the search bar, and type ISO.
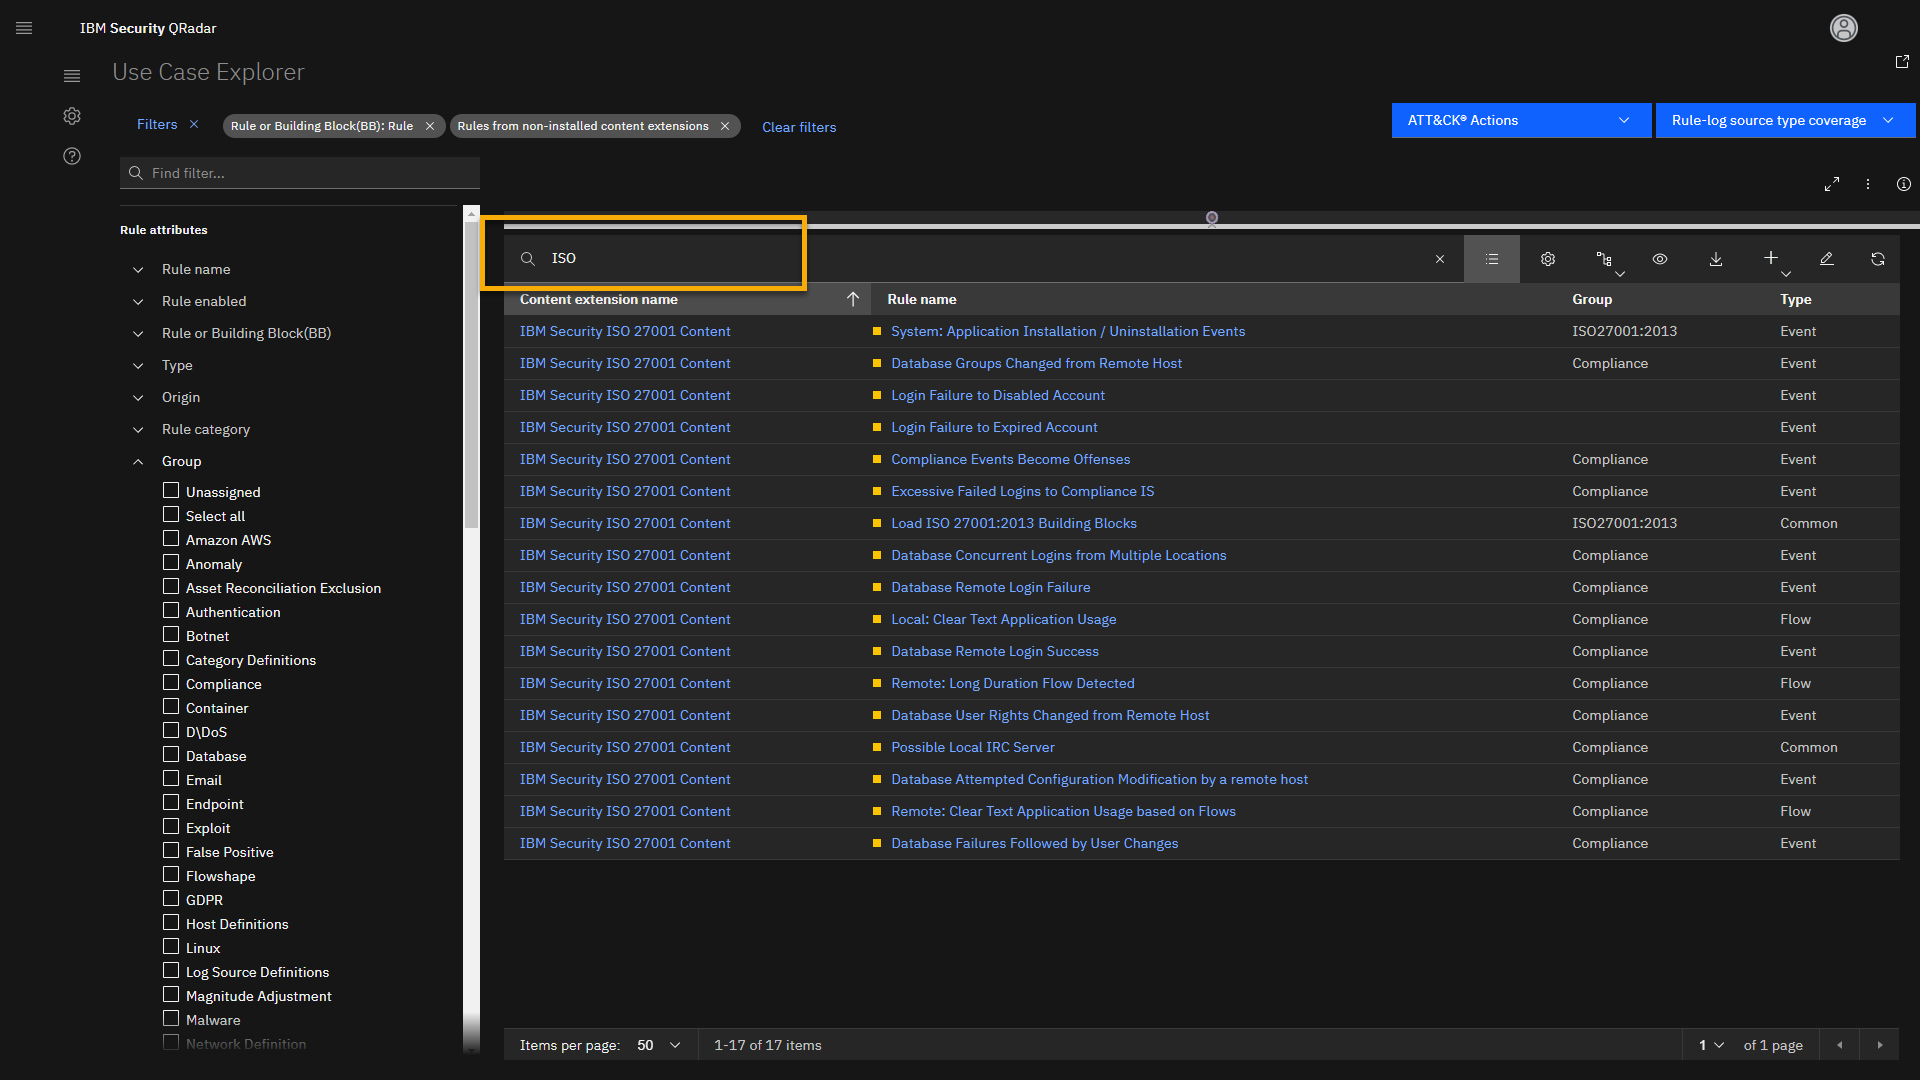
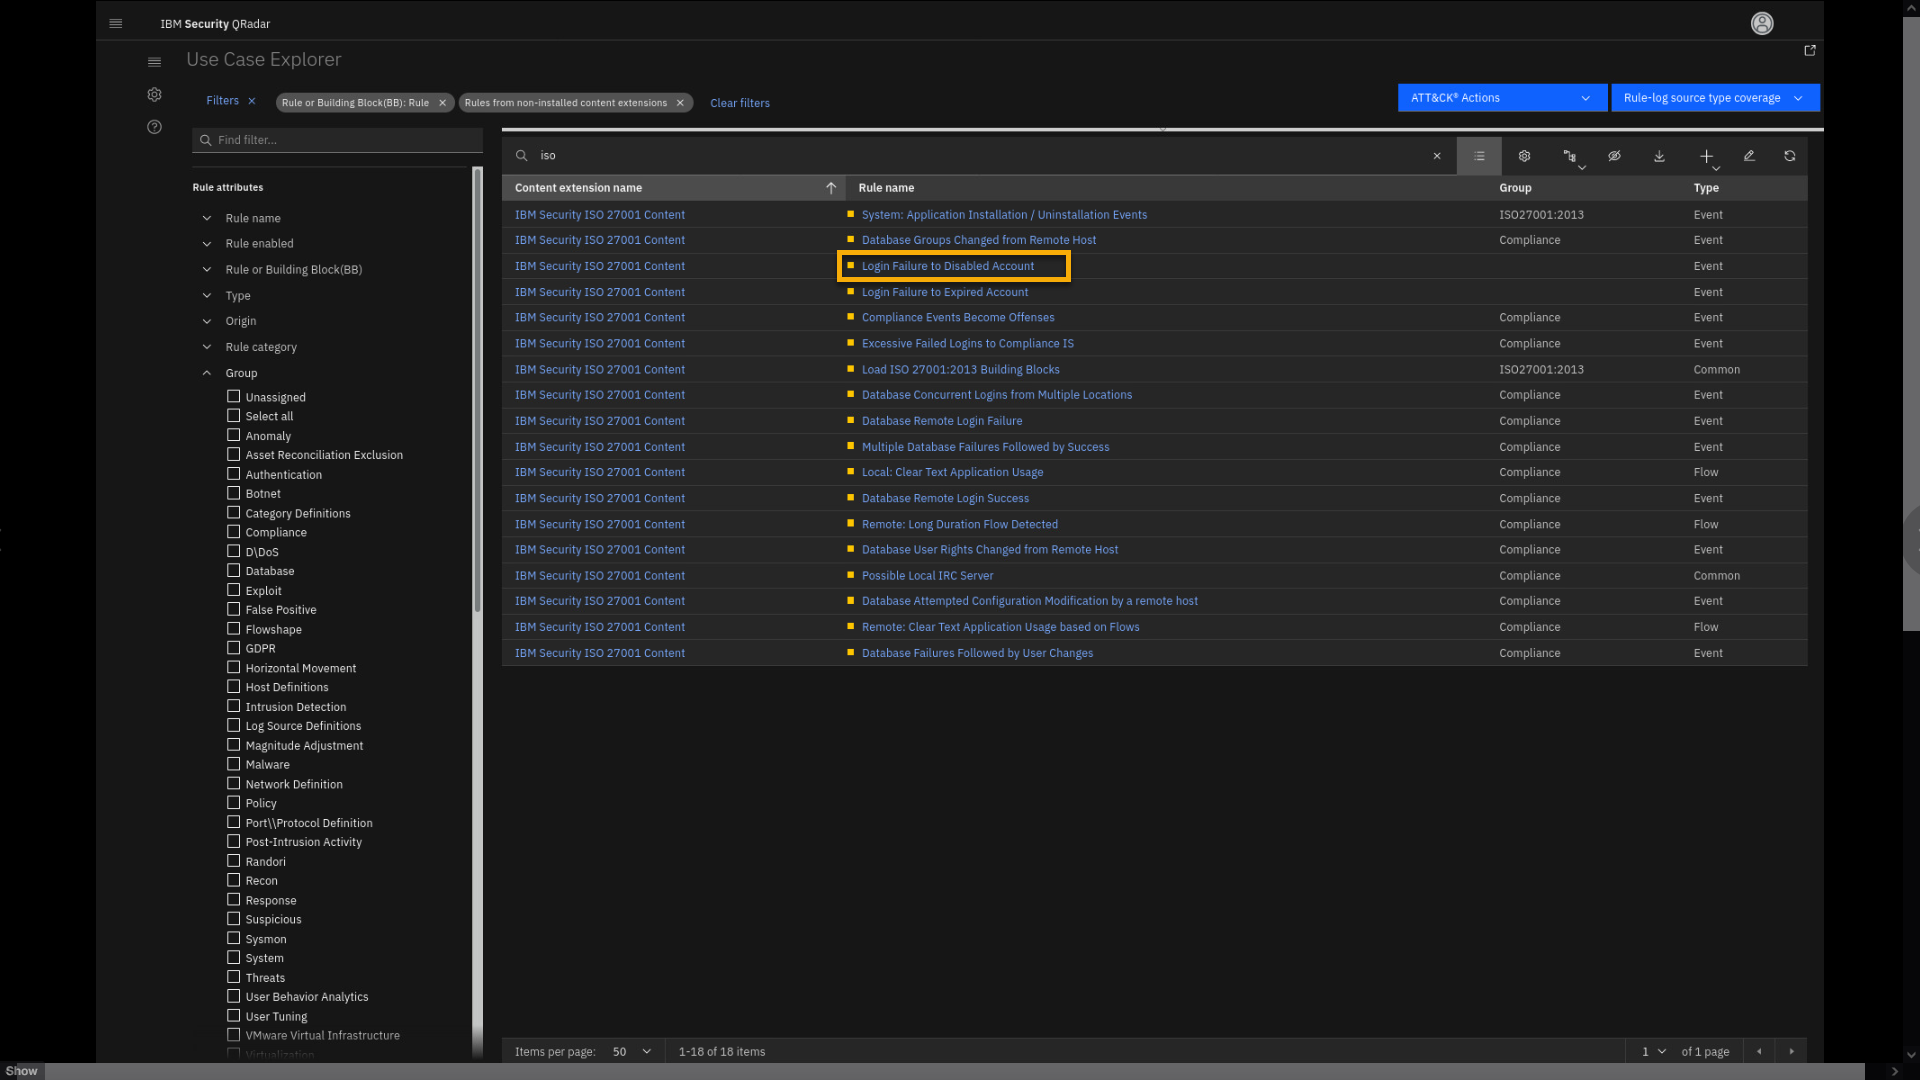
We see 18 different rules that are part of the ISO 27001 Content
extension, which are currently not installed on your QRadar SIEM. Let's
open one rule. -
Click Login Failure to Disabled Account.
-
Review the rule page.
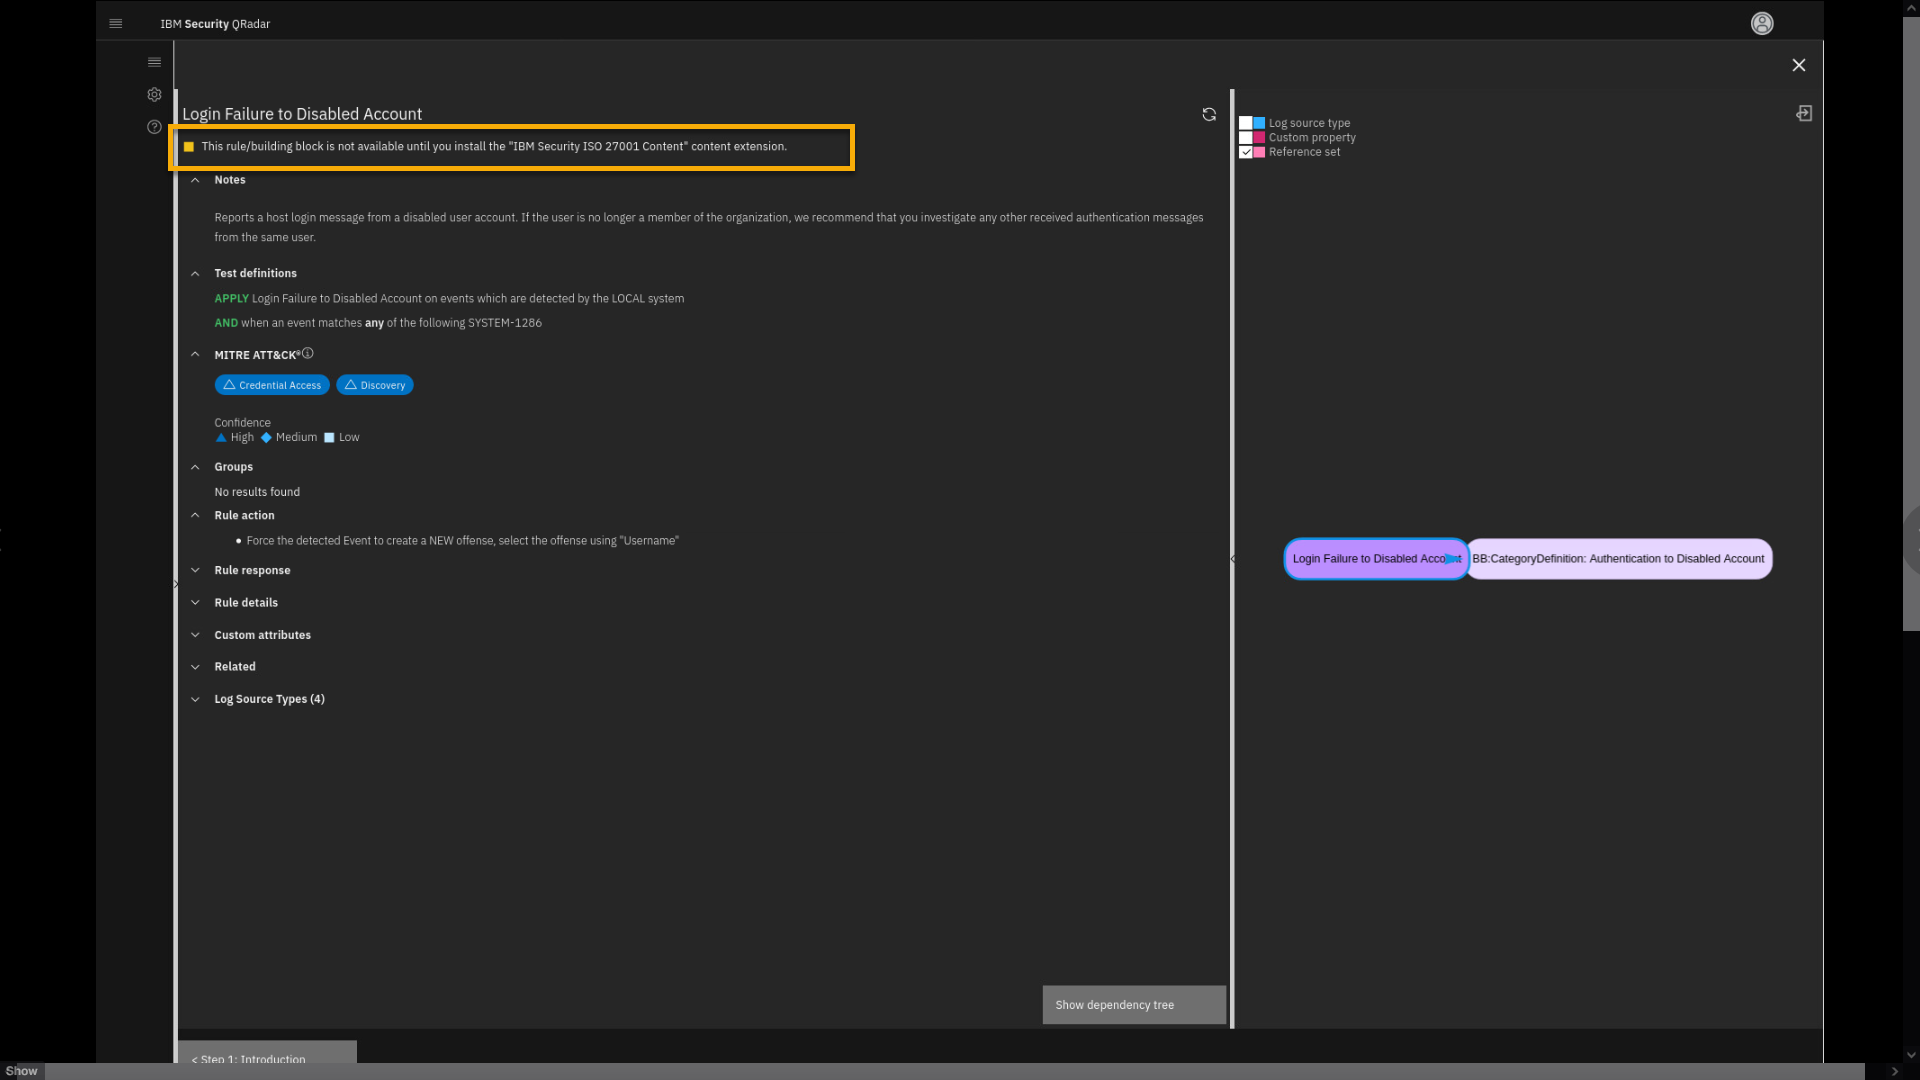
Note that the rule is part of the IBM Security ISO 27001 Content
extension, which is not installed. However, note that you can still
analyze rules, and see details and dependencies. -
Close the page.
-
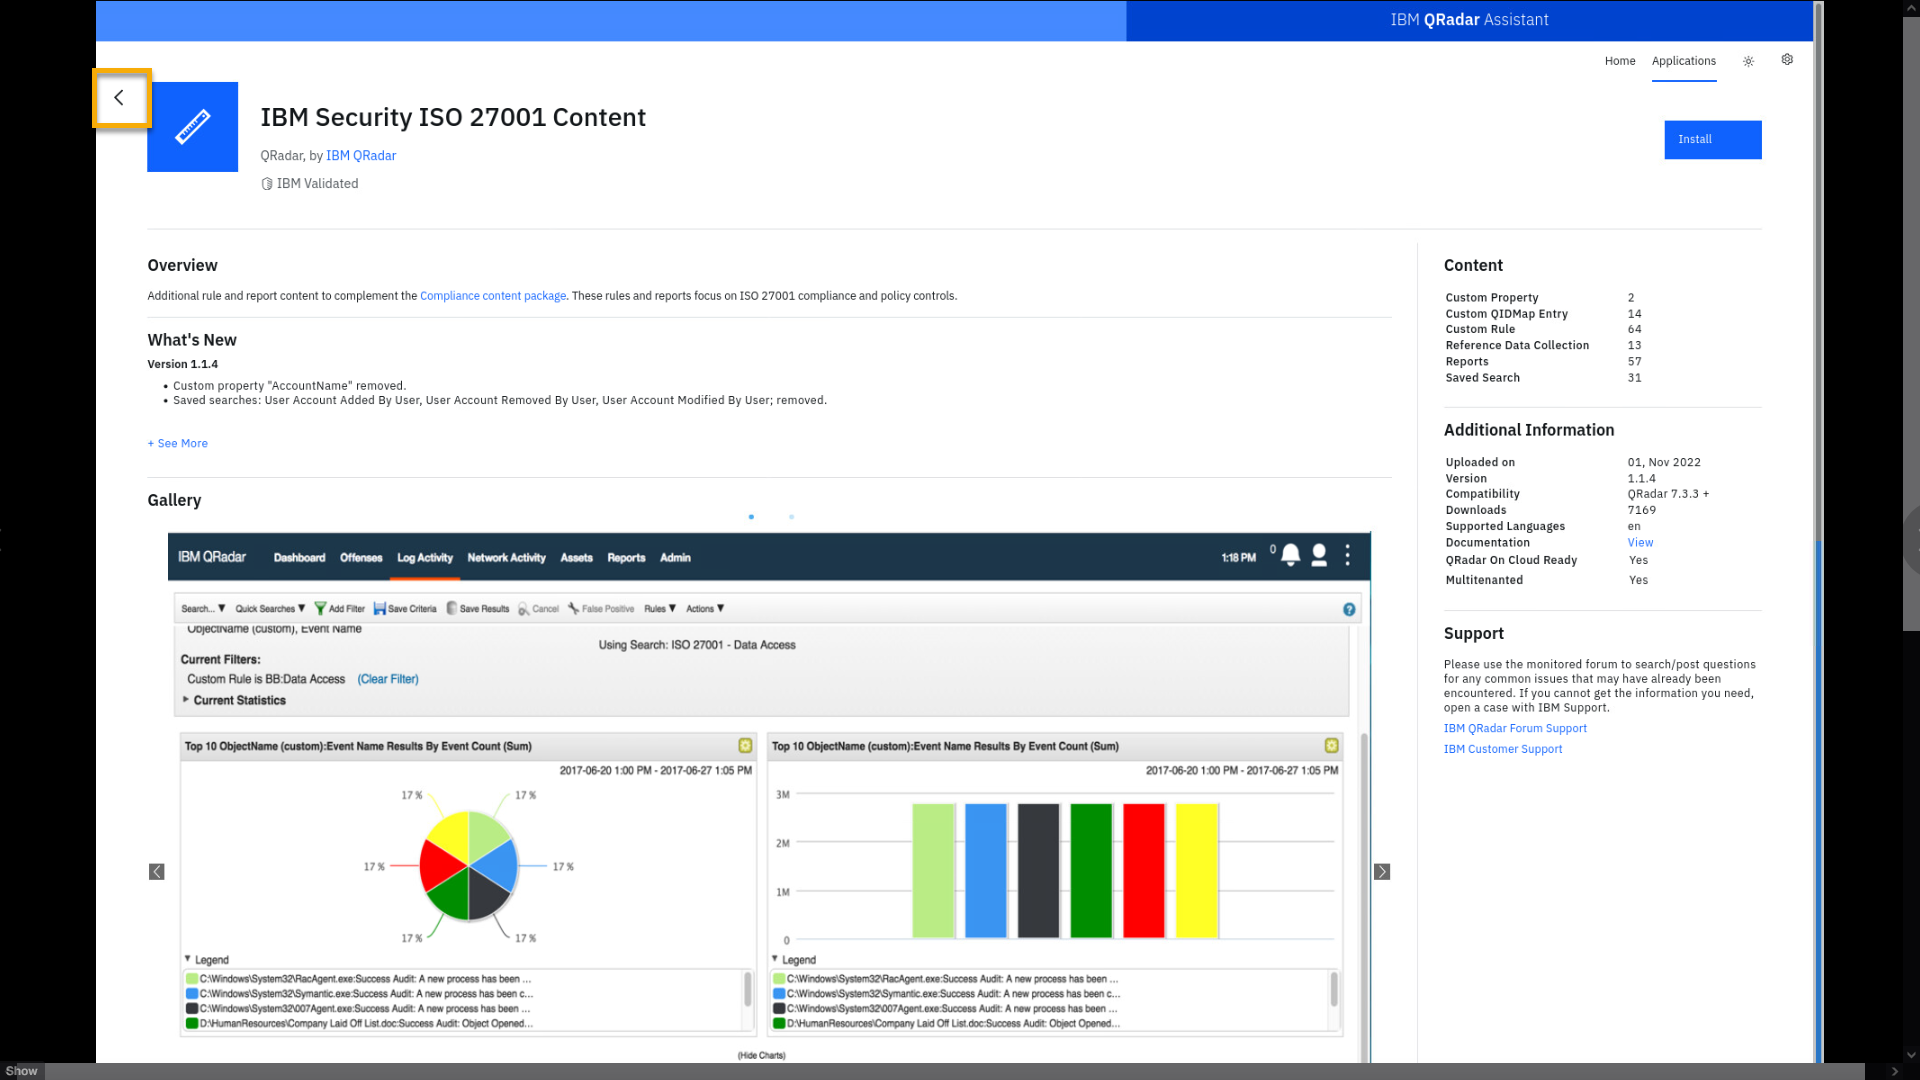
In the Content extension name column, click any IBM Security ISO 27001 Content.
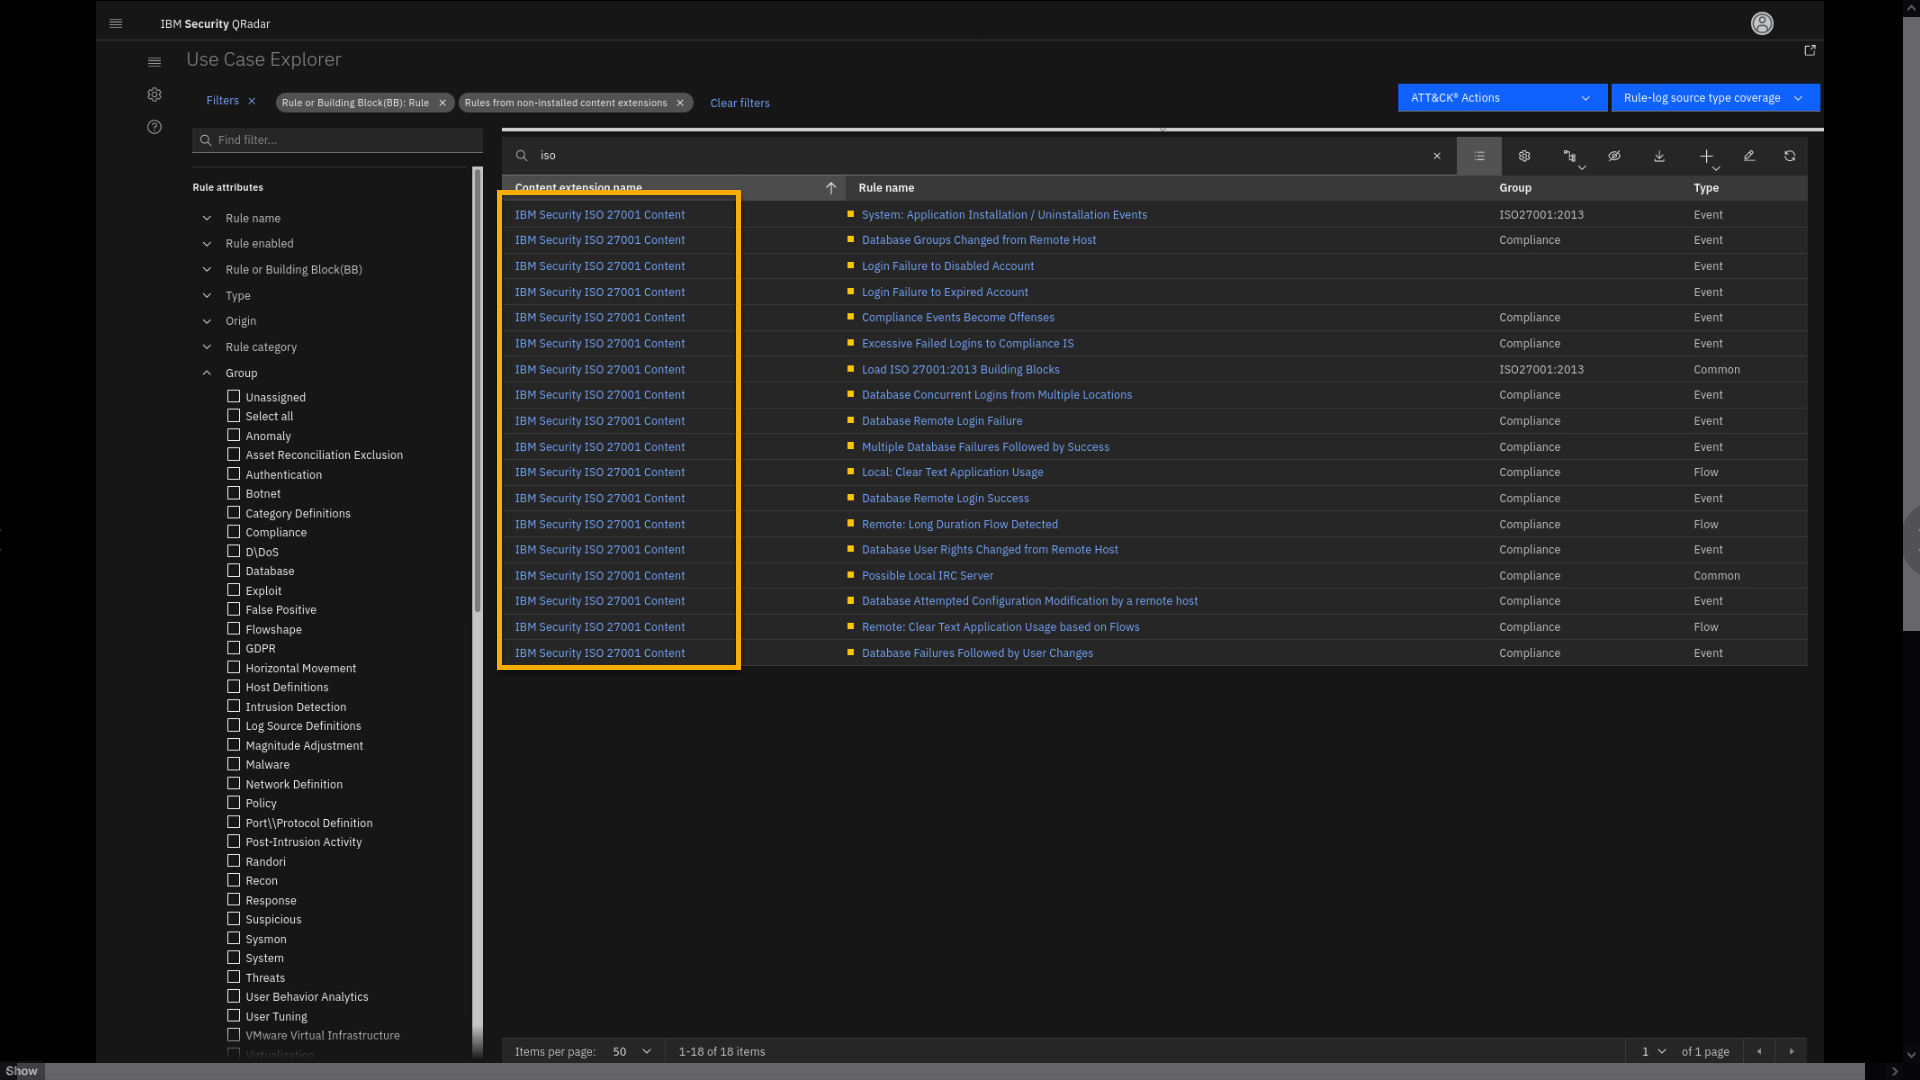
Also click the content extension name.
-
Review the QRadar Assistant app page, which opens in a new browser tab.

When you select any content package inside the UCM app, it takes you to the QRadar Assistant app. This app is linked to the IBM App Exchange, and if you have been granted the appropriate administrative permission on QRadar, you can install the content package with one click. For this lab you will NOT install the content package. Let's continue with UCM.
-
Close the Assistant app tab and focus back on the UCM app.
- The Assistant app opens in the new browser tab. Close the tab and shift focus back to the UCM app.
Let's see how the UCM app can be used to review MITRE ATT&CK coverage.
MITRE coverage demo
This will be on the quiz
-
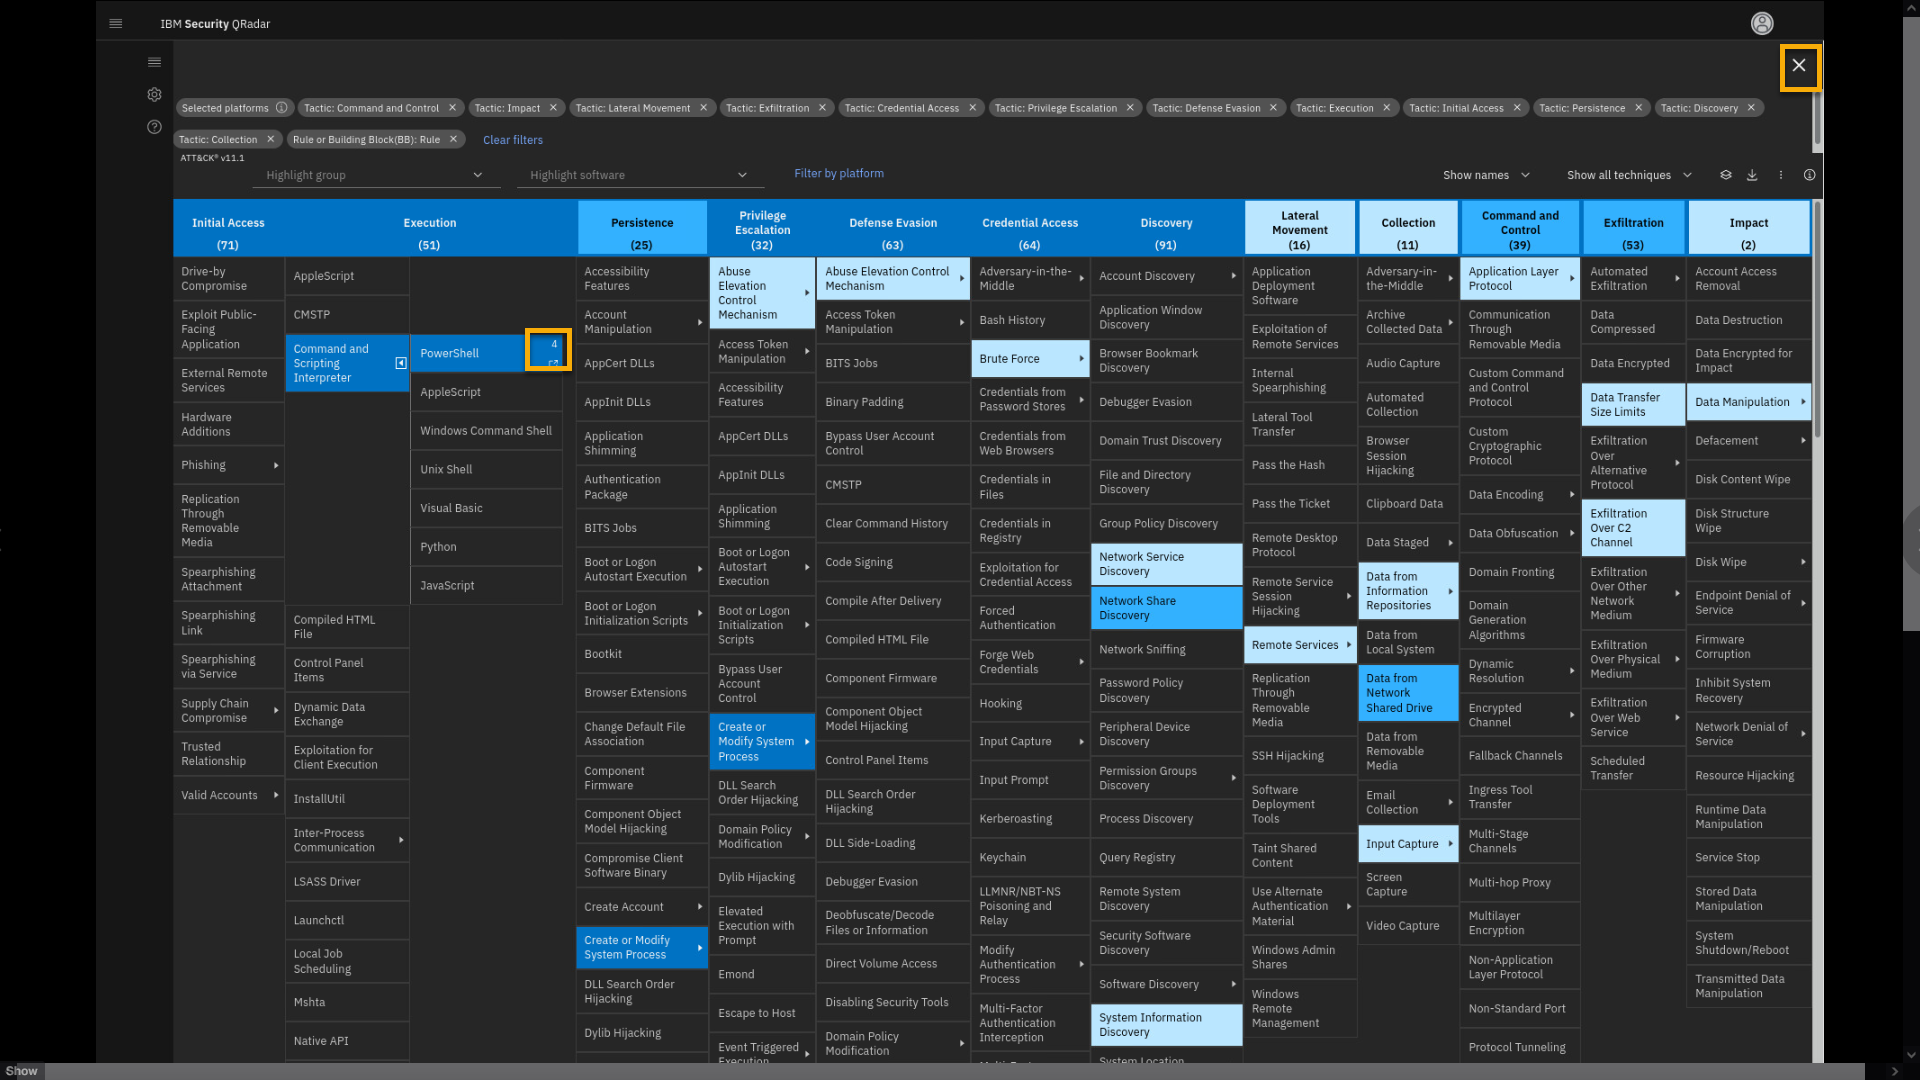
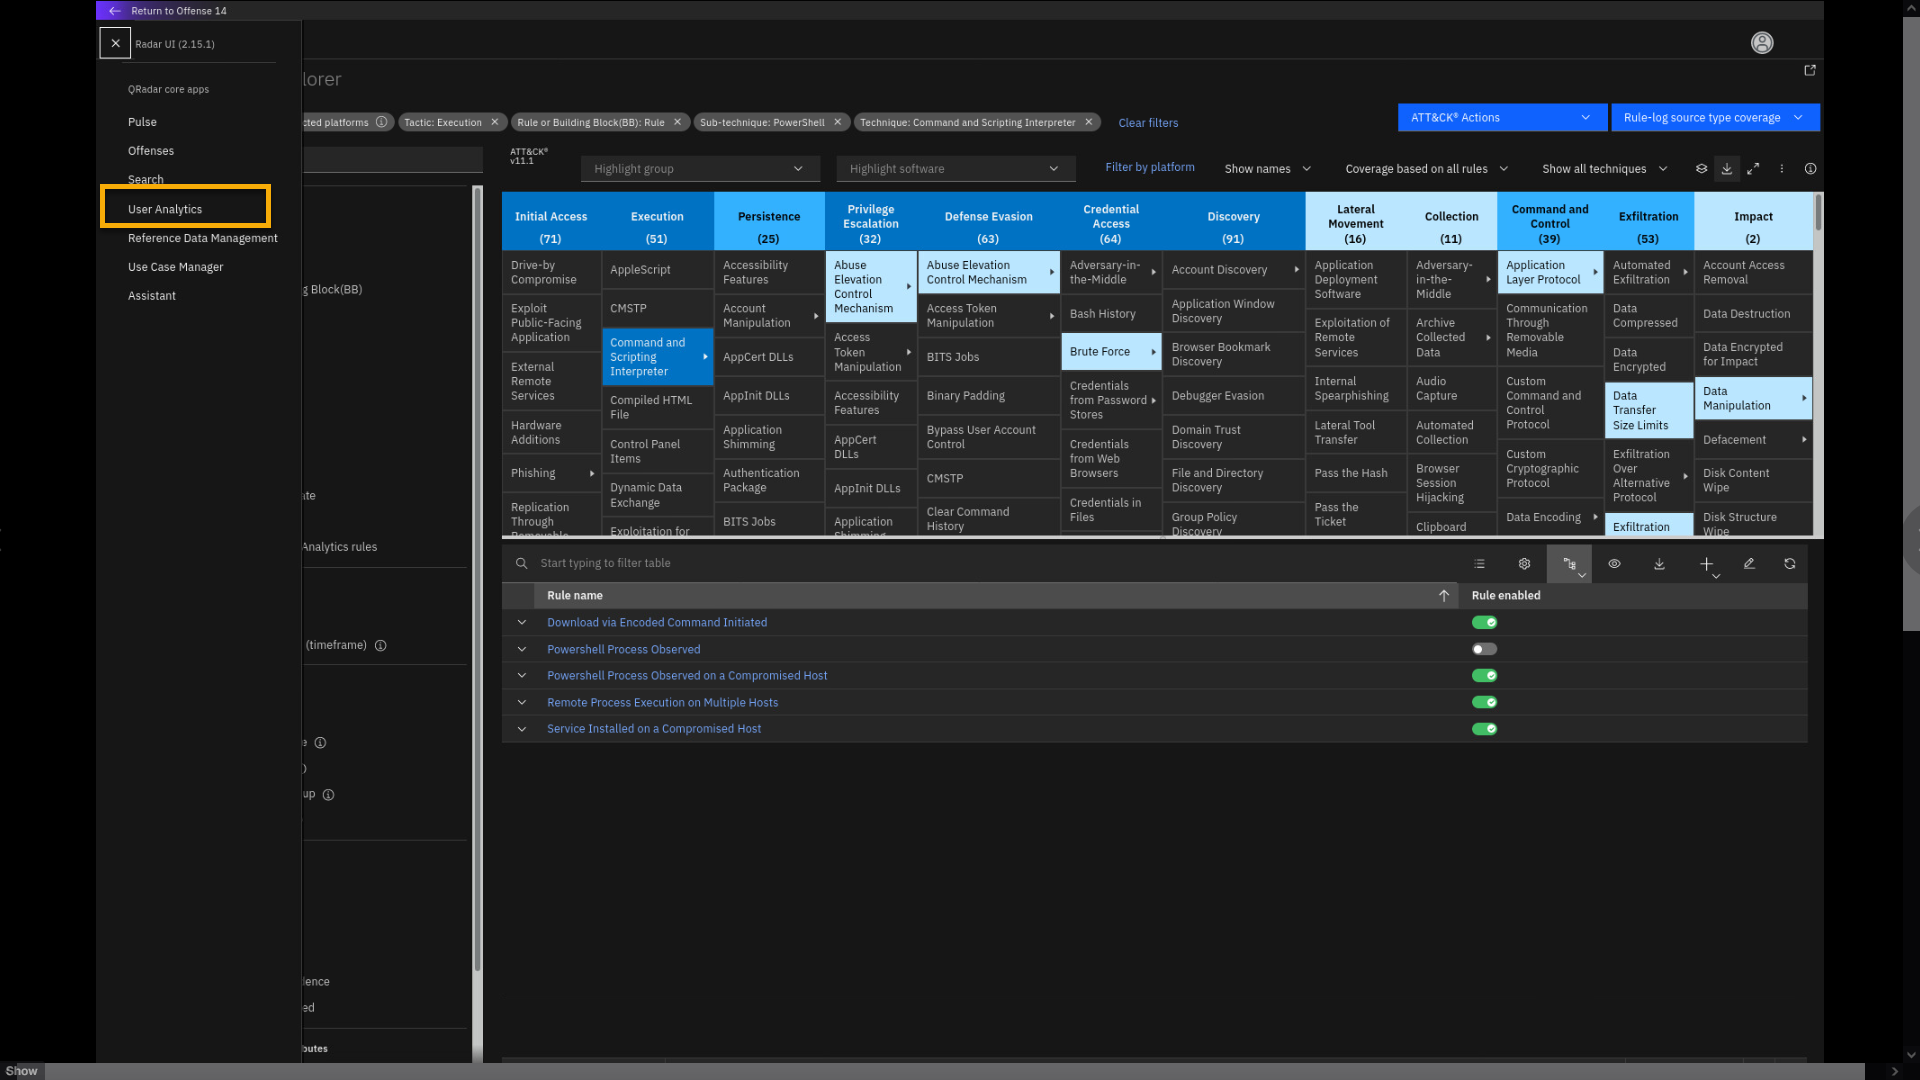
Click the ATT&CK Actions menu, select Coverage map and report.
-
Then switch to full screen using the full screen icon.
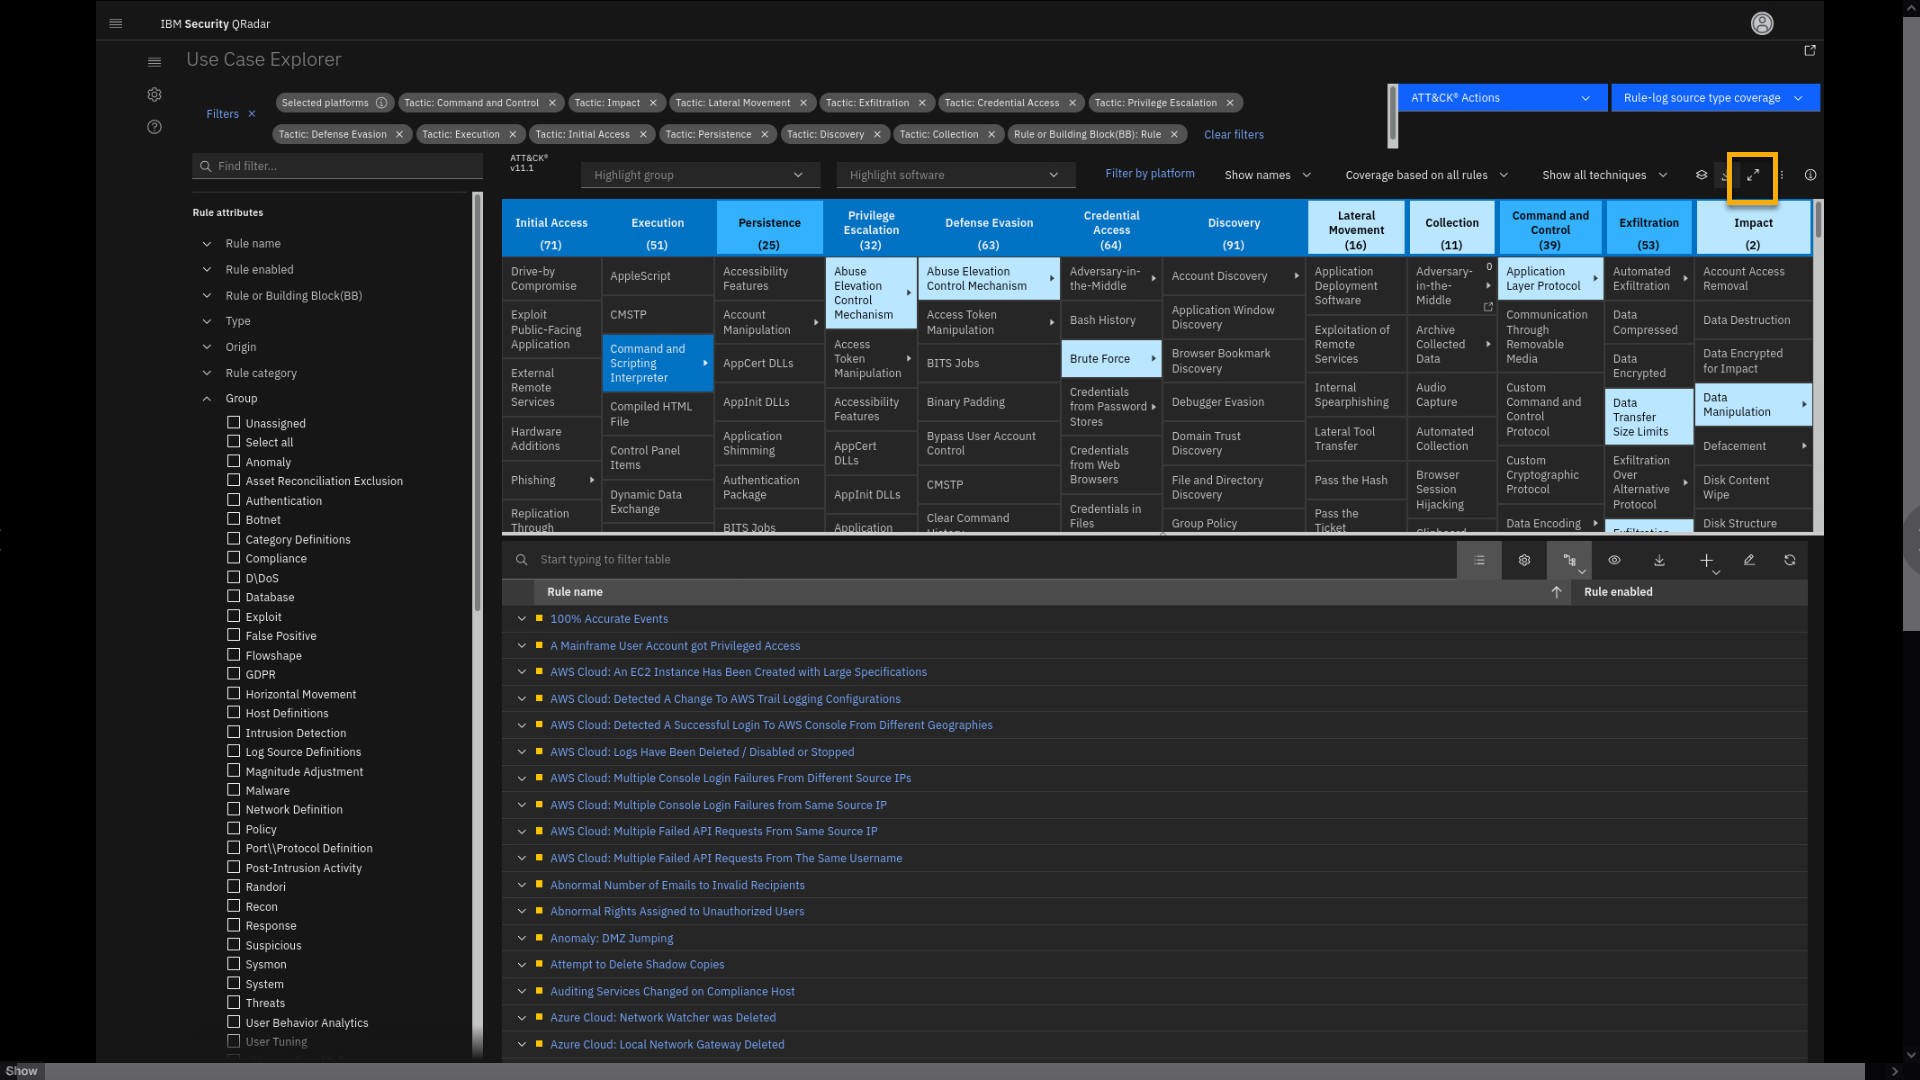
Coverage map and report matrix shows your current QRadar coverage per
tactics and techniques. The color code is significant; the darker
shade of blue means that coverage is better. Let's examine the Command
and Scripting Interpreter techniques. -
Click Command and Scripting Interpreter > PowerShell.
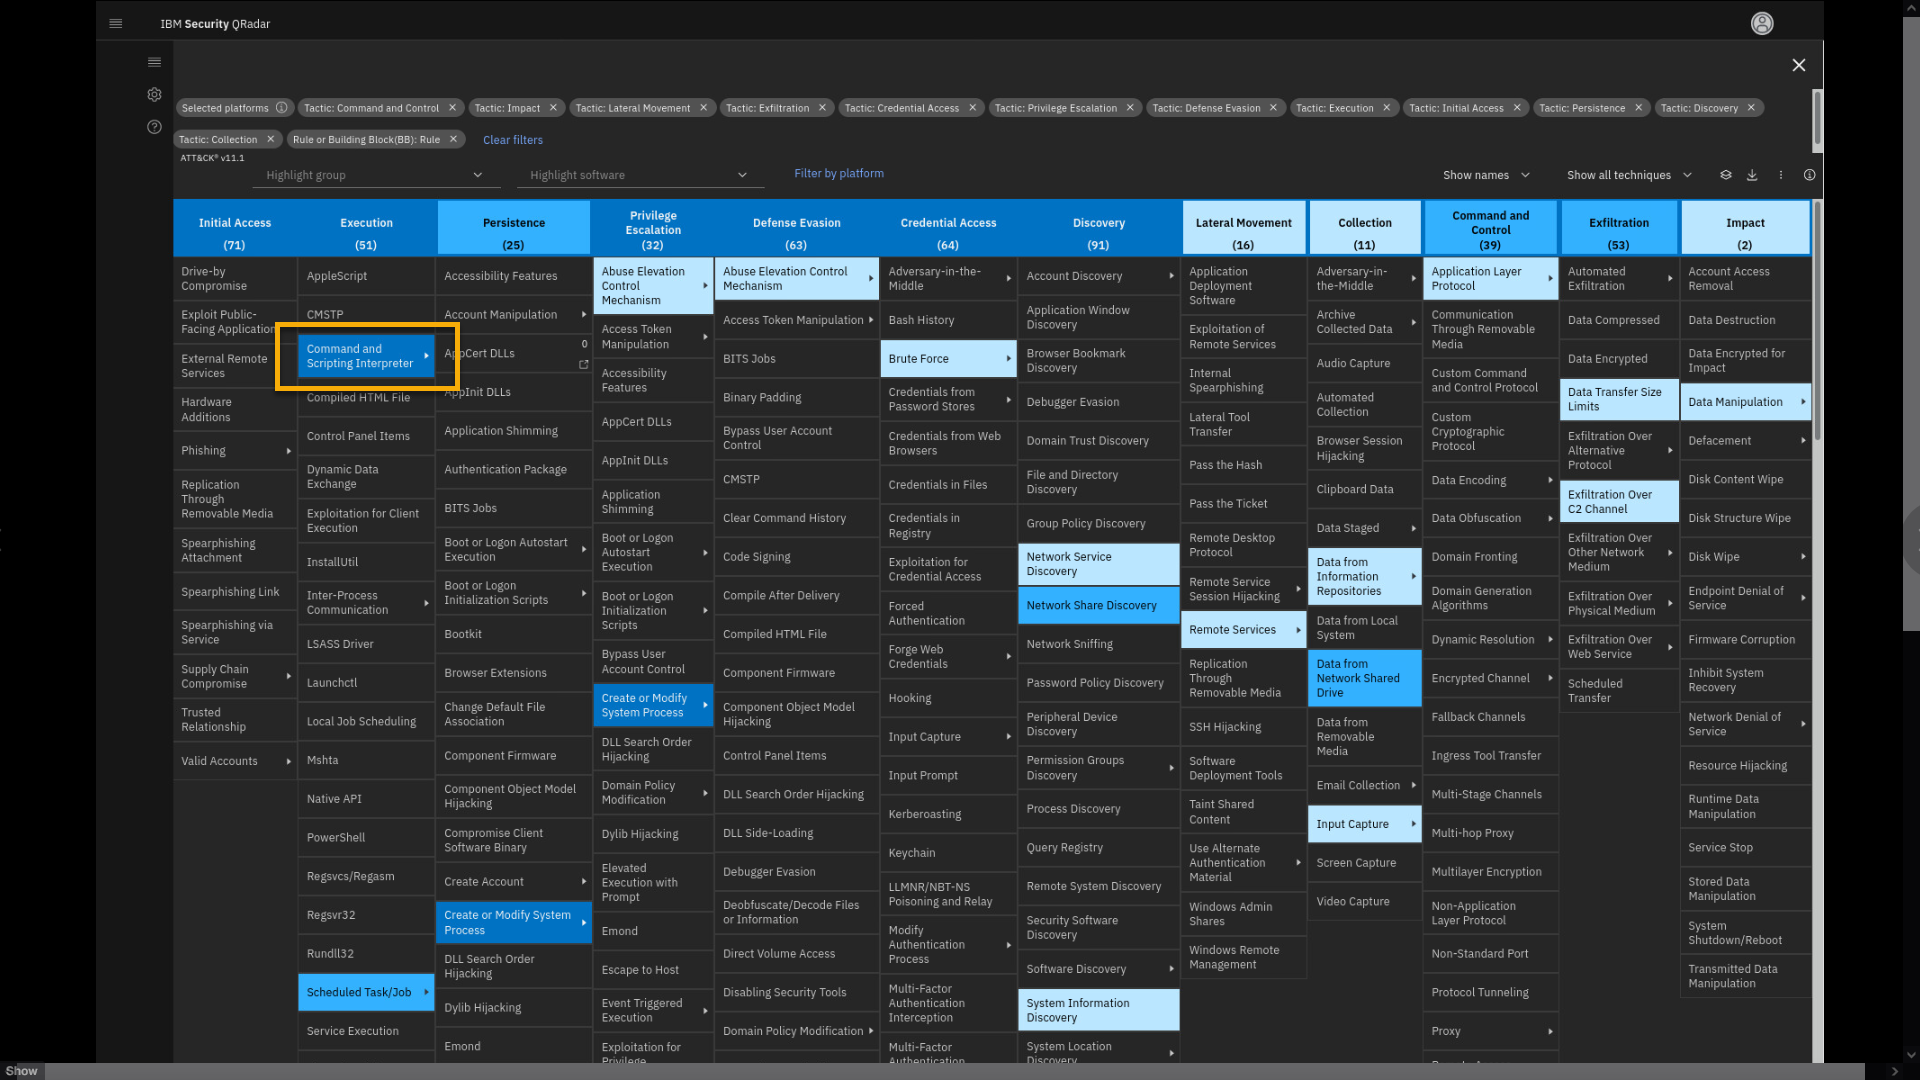
Note that a new filter shows on the filter list. Now exit the full
screen and apply the filters. -
Exit from the full screen.
-
Click Apply Filters.
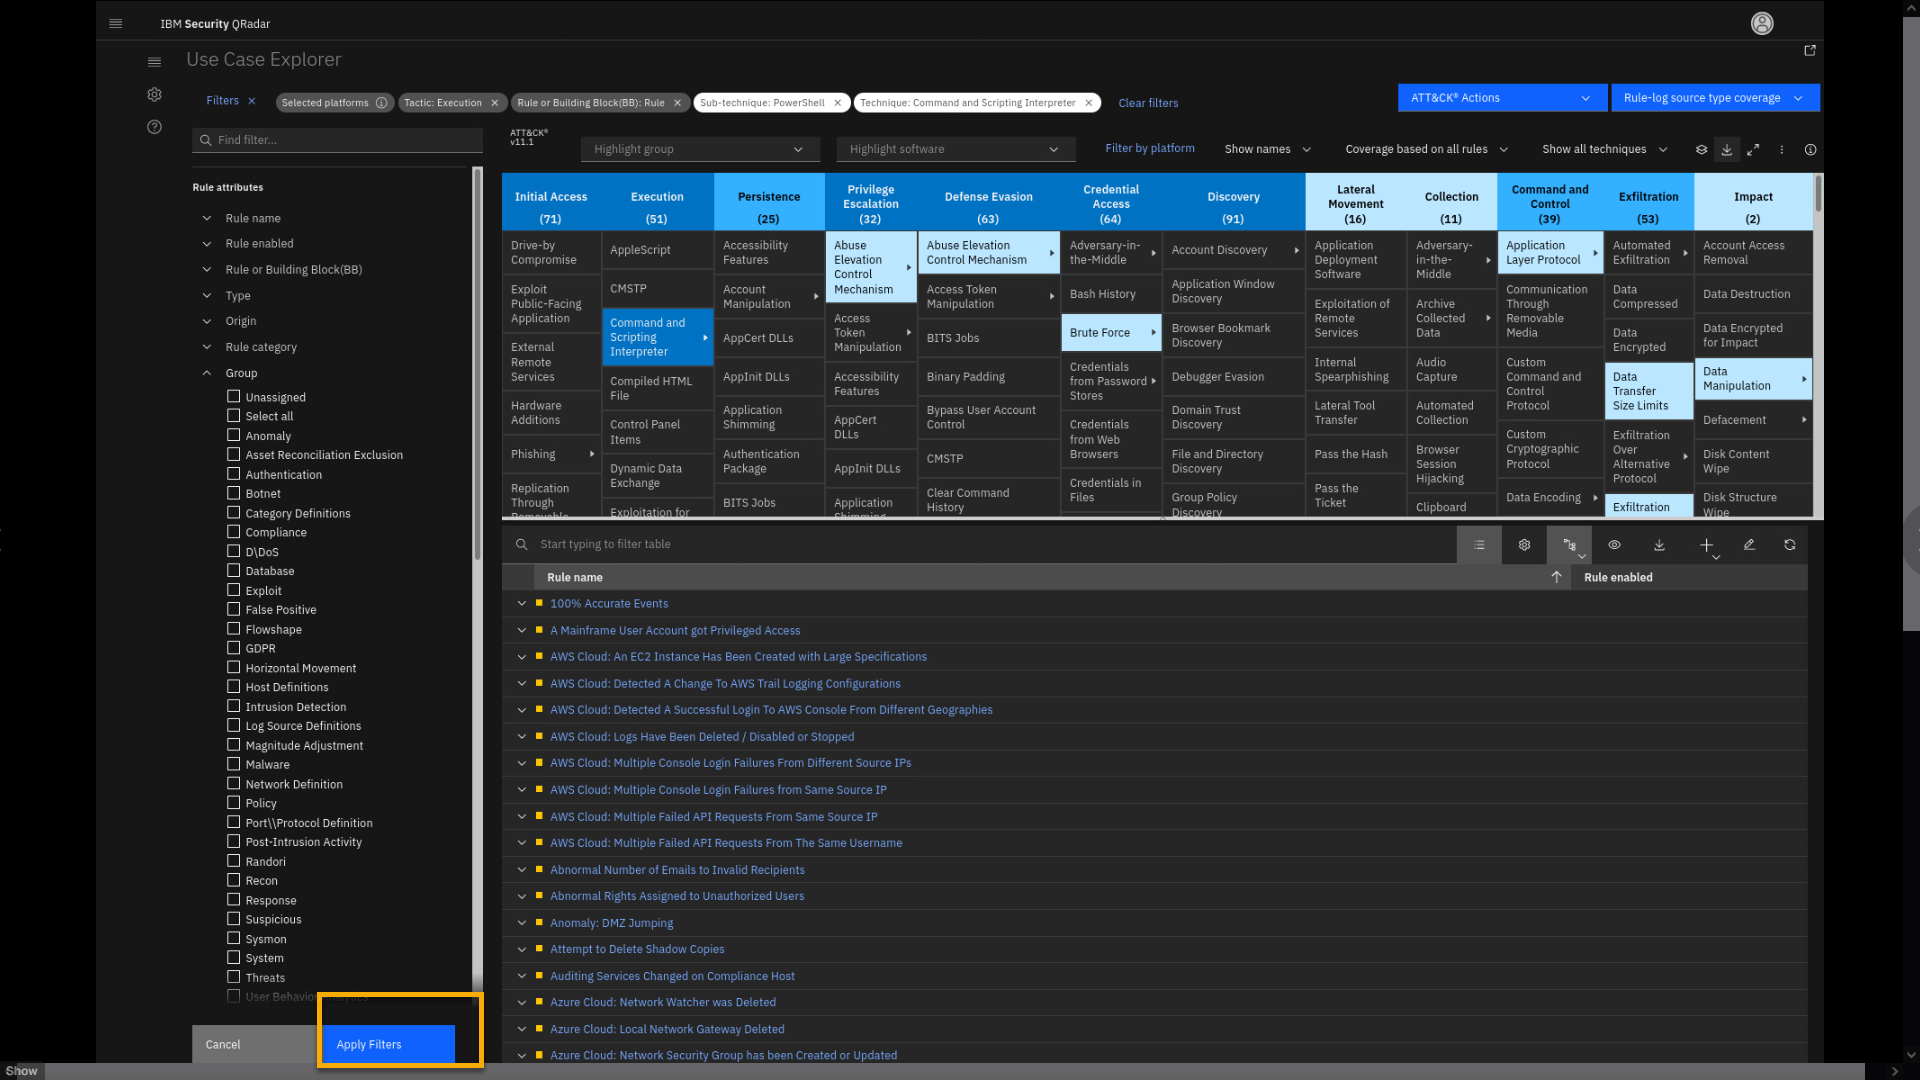
-
Review the filtered results.
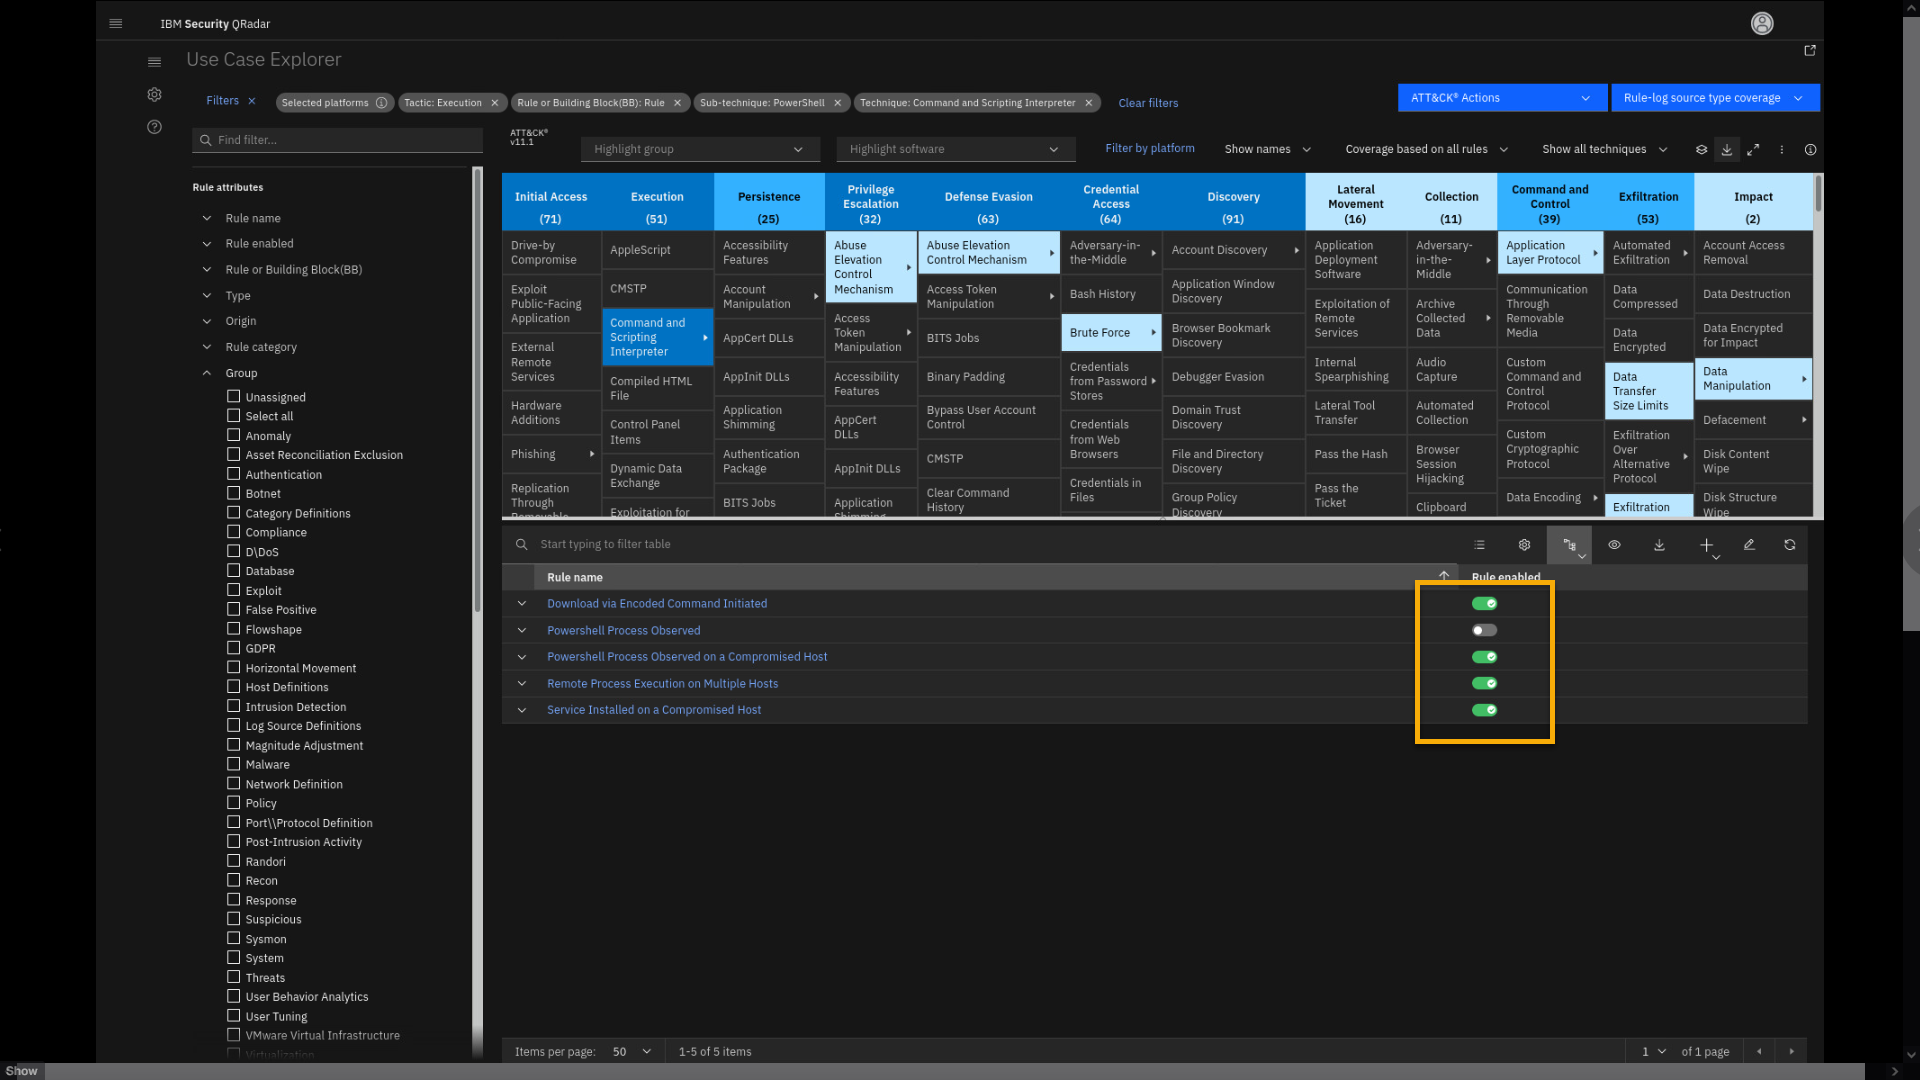
Note that you see 5 rules related to this technique loaded in the table.
One is disabled and four others are enabled.You can also use MITRE filters to see the usage and trends of
implementation of the MITRE framework in your QRadar deployment. -
Click the ATT&CK Actions menu, then click Coverage summary
and trend.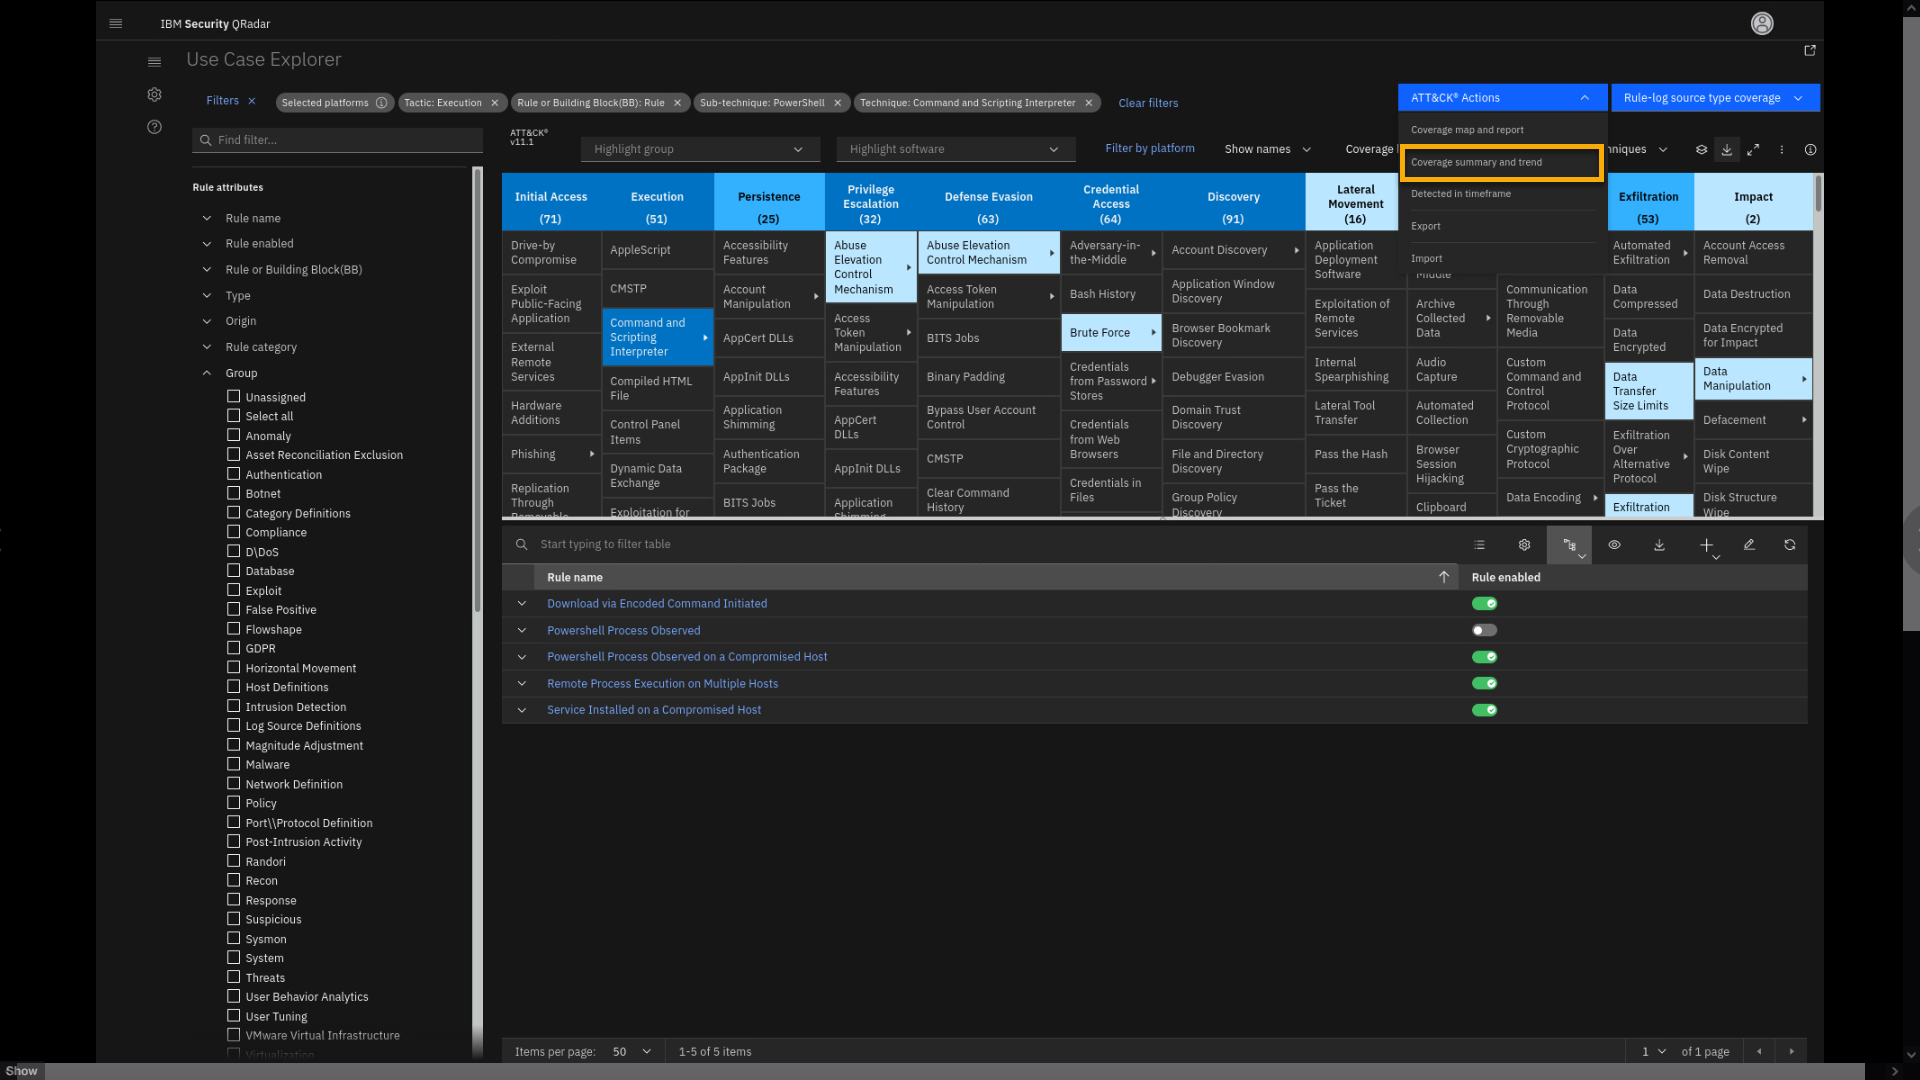
-
Review the Coverage summary and trend page.
The MITRE Coverage Summary data helps you to understand where you are
with your current QRadar implementation in relation to different MITRE
ATT&CK tactics. For example, in this QRadar deployment, of the total
installed rules, 18% are mapped to cover the Initial Access tactic.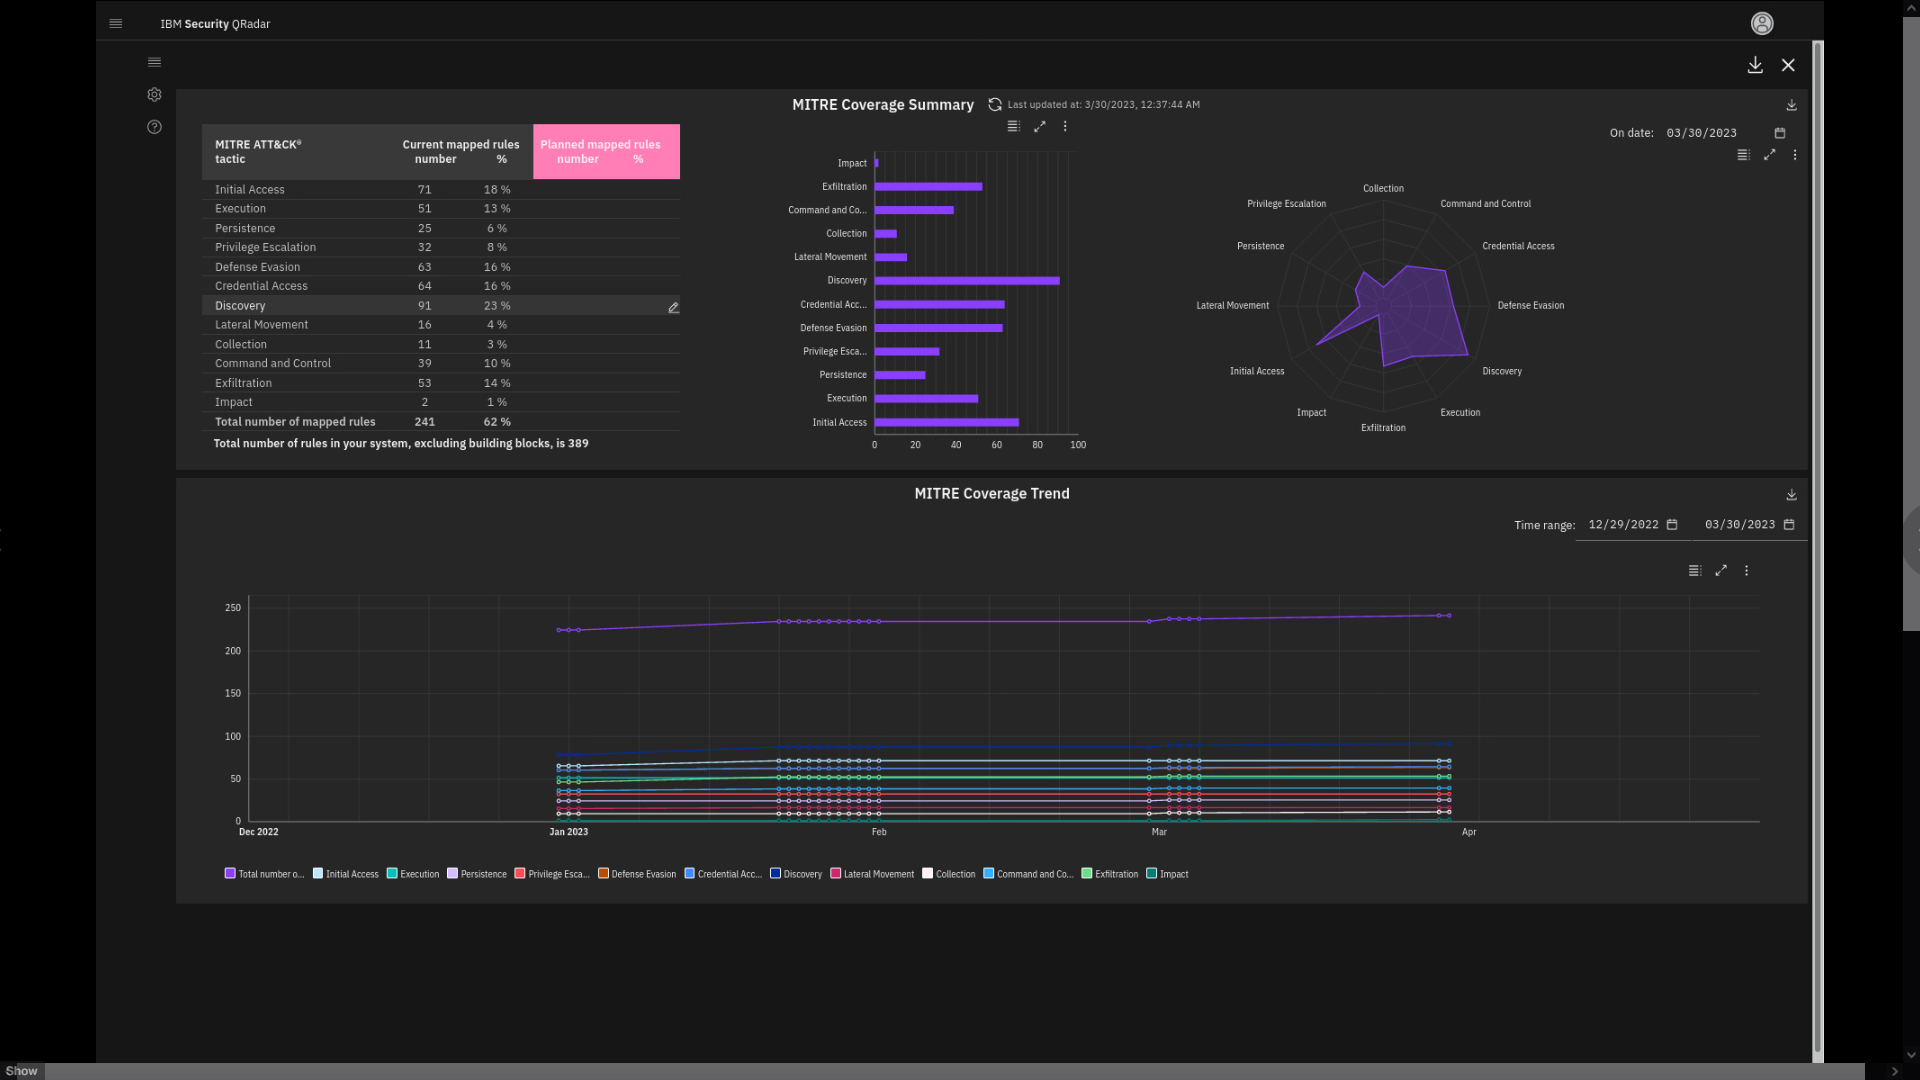
There is also a MITRE Coverage trend graph.
Finally, we want to point out that you can review use case implementation.
-
Exit from the summary page.
-
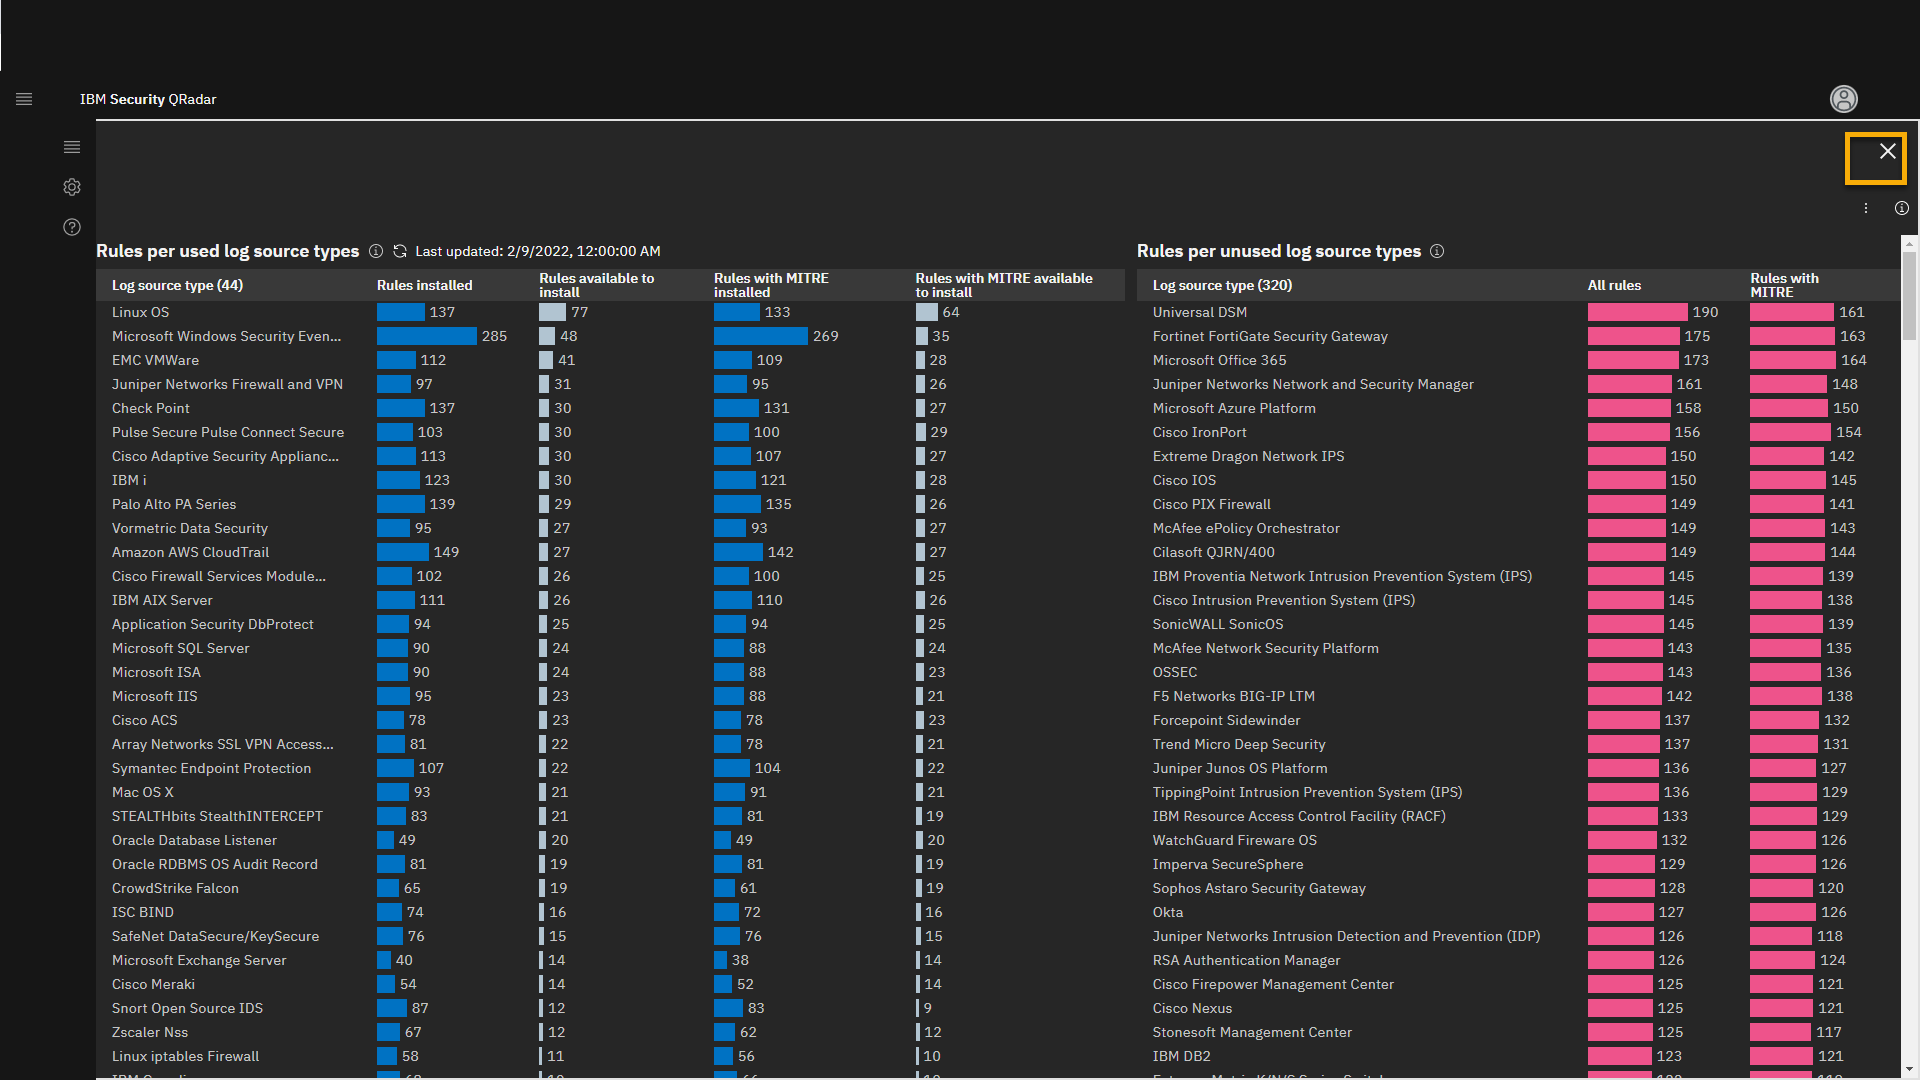
Expand Rule-log source type coverage, then click Current and
potential coverage.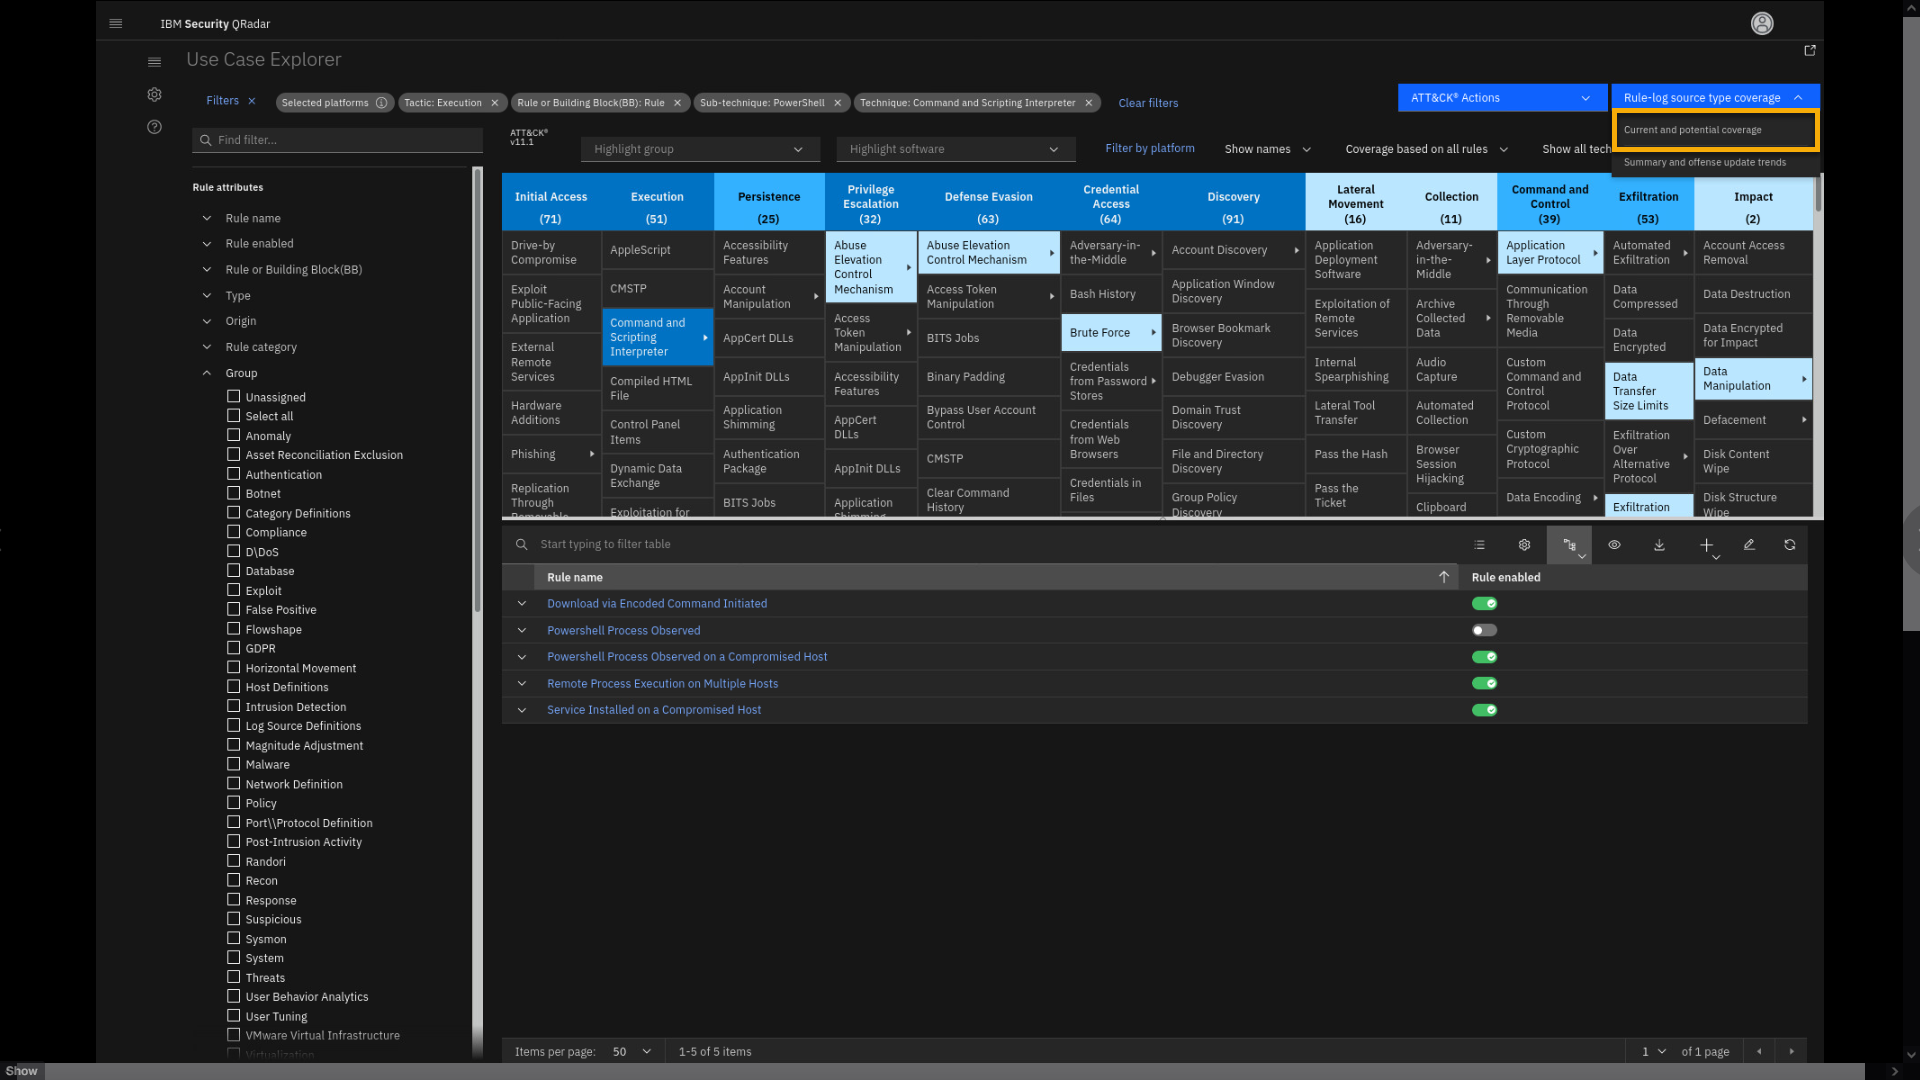
-
Review the page.
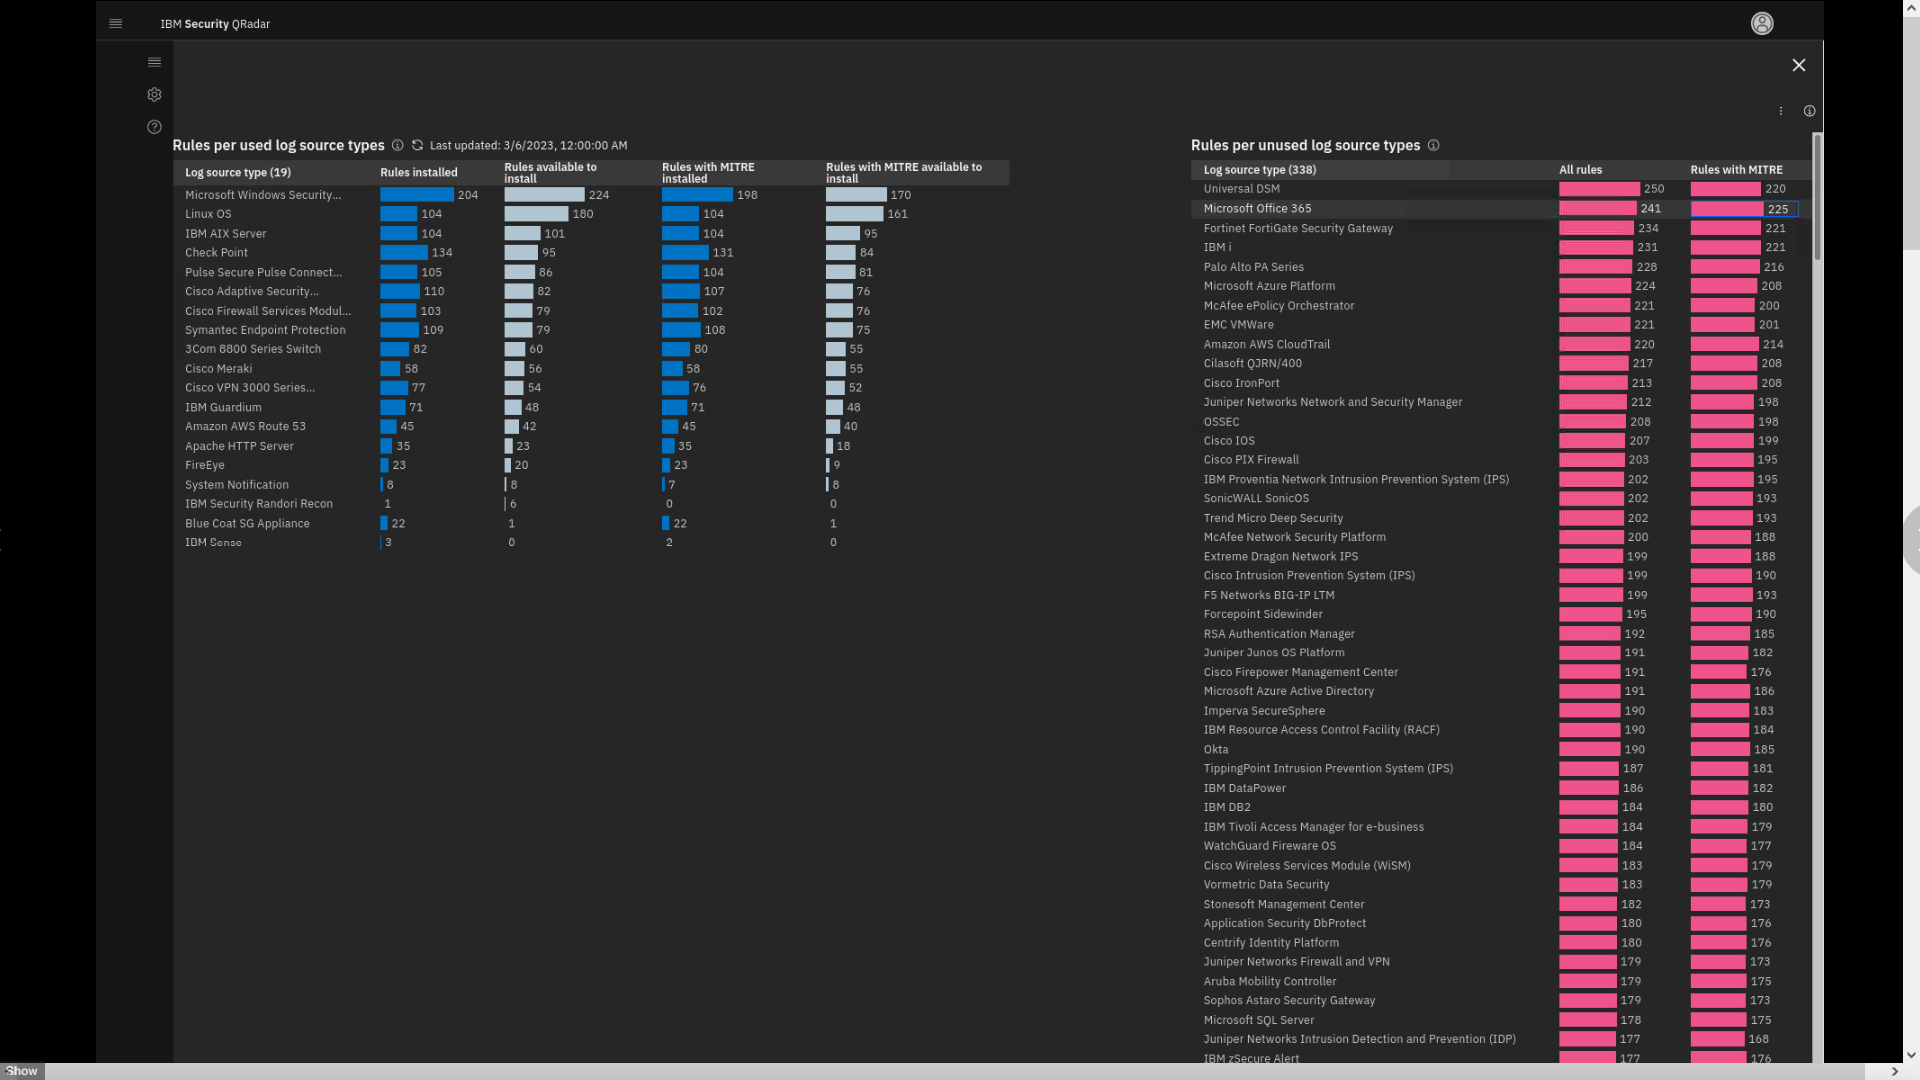
This page displays all rules per log source that you have installed and
that you can install.Here you see Rules per log source type, used and unused, how many rules
are installed, and how many more you can implement. The list also shows
that, by default, QRadar supports almost 400 log source types. The MITRE
Coverage is also documented. -
Exit the page.
You can also use the UCM app to tune the QRadar rules.
This part of the lab was about how the Use Case Manager, Reference Data Management, and Assistant app can help you analyze missing and installed content on your QRadar SIEM deployment. These apps also help to understand dependencies between rules, building blocks, and reference data. Also Use Case Manager allows understanding of how the currently configured rules map to MITRE ATT&CK framework tactics and techniques.
It is time to move on and see how the UBA app can help in analyzing potential malicious user activity.
User Behavior Analytics
IBM QRadar User Behavior Analytics (UBA) analyzes user activity to
detect malicious insiders and determine if a user's credentials are
compromised. Security analysts can quickly see risky users, view their
anomalous activities, and drill down into the underlying log and flow
data that contributed to a user's risk score.As an integrated component of the QRadar Security Intelligence Platform,
UBA leverages default behavioral rules and machine learning (ML) models
to add user context to network, log, vulnerability, and threat data to
detect attacks more quickly and accurately.User Behavior Analytics provides insight to ensure that only those who
need access to personal information have it, and any other activity will
be alerted, detecting unauthorized attempts. Breach notification
requirements are among the most notable in the GDPR. In the event of a
potential data breach that involves personal information, an
organization must notify the Data Protection Authority within 72 hours
after becoming aware of the breach, making offenses and their insights,
such as demonstrated below, crucial for the investigation.
We will begin by opening the UBA interface.
-
Click the main Menu, then select User Analytics.
-
Provide an overview of the UBA main page.
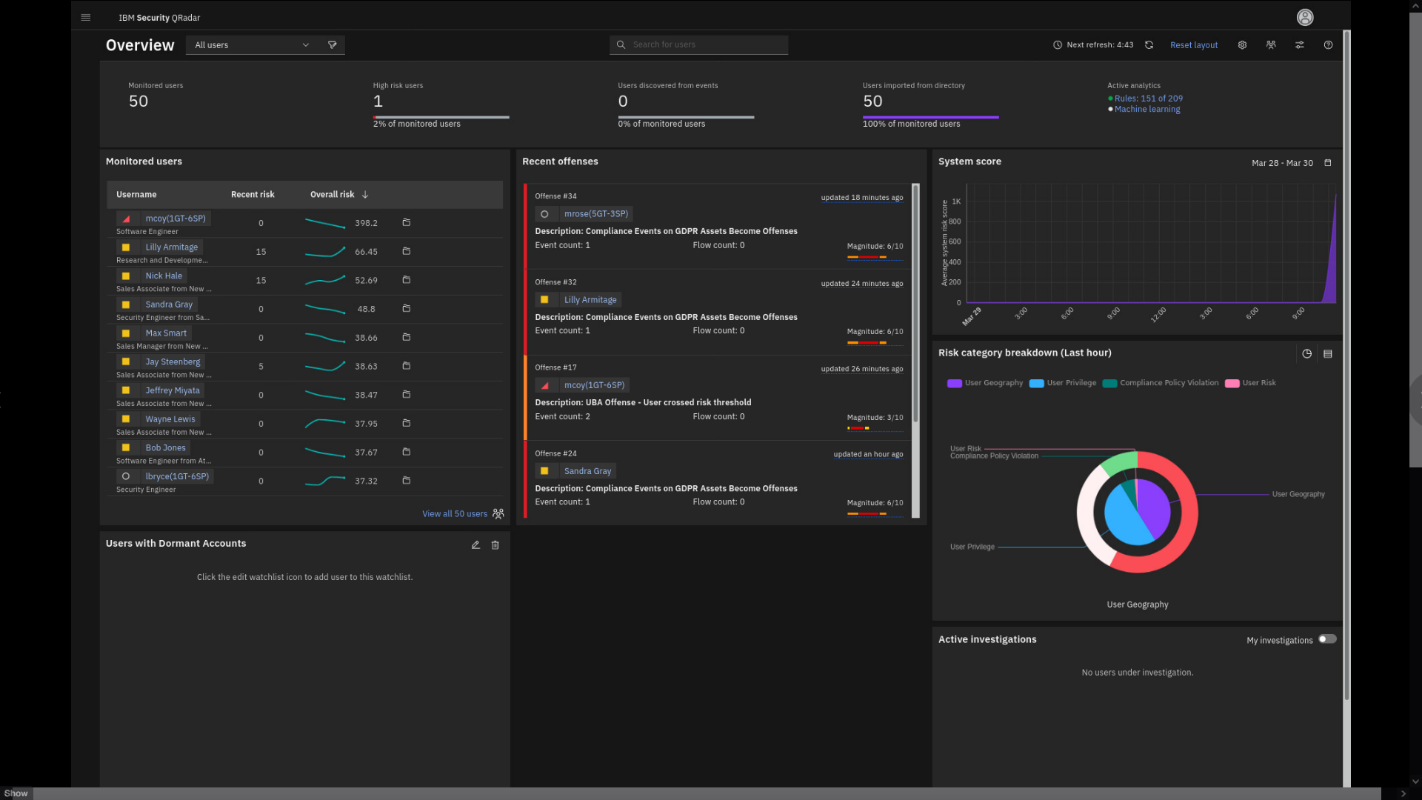 }
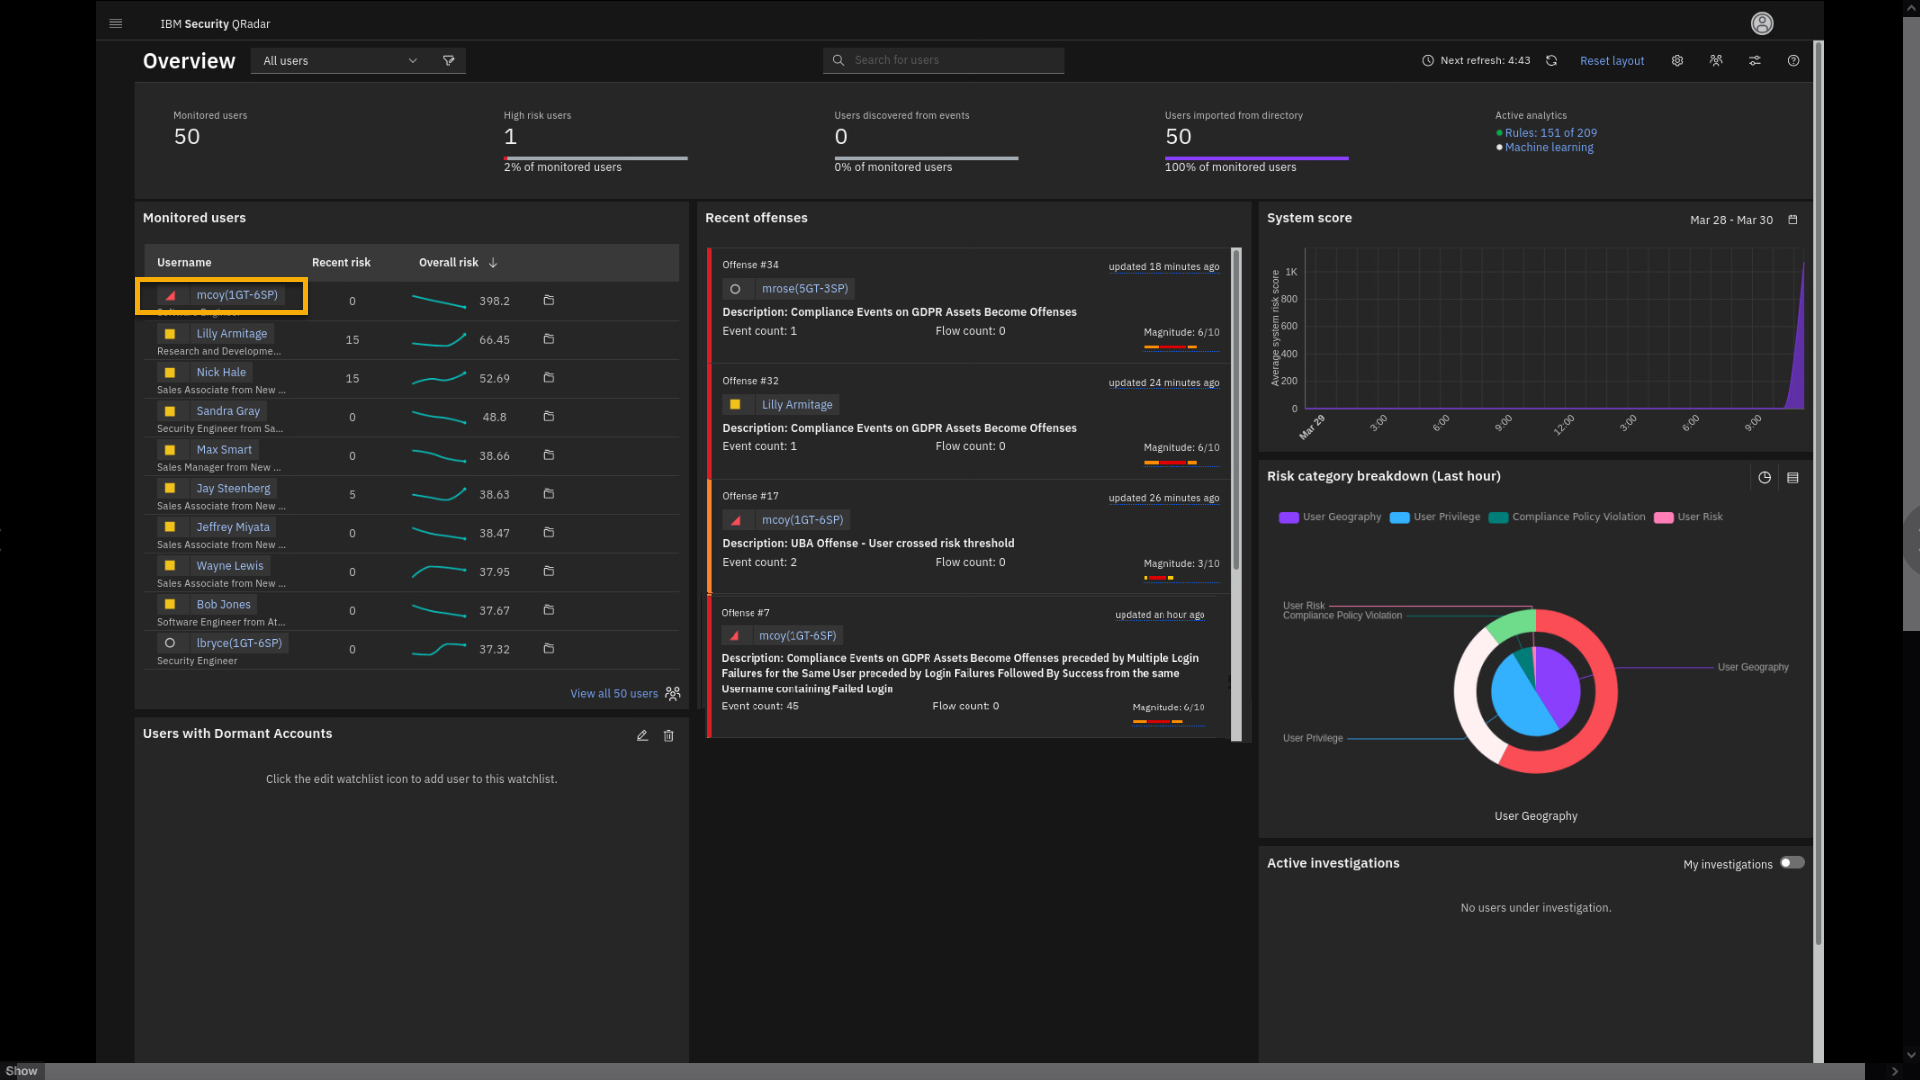
}This loads the User Behavior Analytics app dashboard. At the upper part
of the Overview page, you have some statistics about the users: how many
users are monitored, whether they are imported from an LDAP directory, or if they
are discovered through analysis of logs and flows.The Monitored users widget helps you to understand trends with the
monitored users. You see the current user risk score as well as the
overall risk trend. Is the risk going up or down? In the middle section,
you see the Recent offenses related to user activity. We see
the previously observed user mcoy in the earlier analyzed
offense about suspicious activity on the GDPR asset is at or near the top
of the monitored list.The right part of the Overview screen has some graphical data: overall
risk score (System score) and Risk category breakdown. We see that most
issues are related to user privilege and user geography access
issues. Hover your mouse over parts of the Risk category
breakdown chart to examine some of the details.Because the mcoy user is marked by a red triangle and is reported as a
high-risk user with high scoring points, you acting as an analyst will
review the user mcoy in more detail. -
In the Monitored users list, click mcoy.
-
Click View user details.
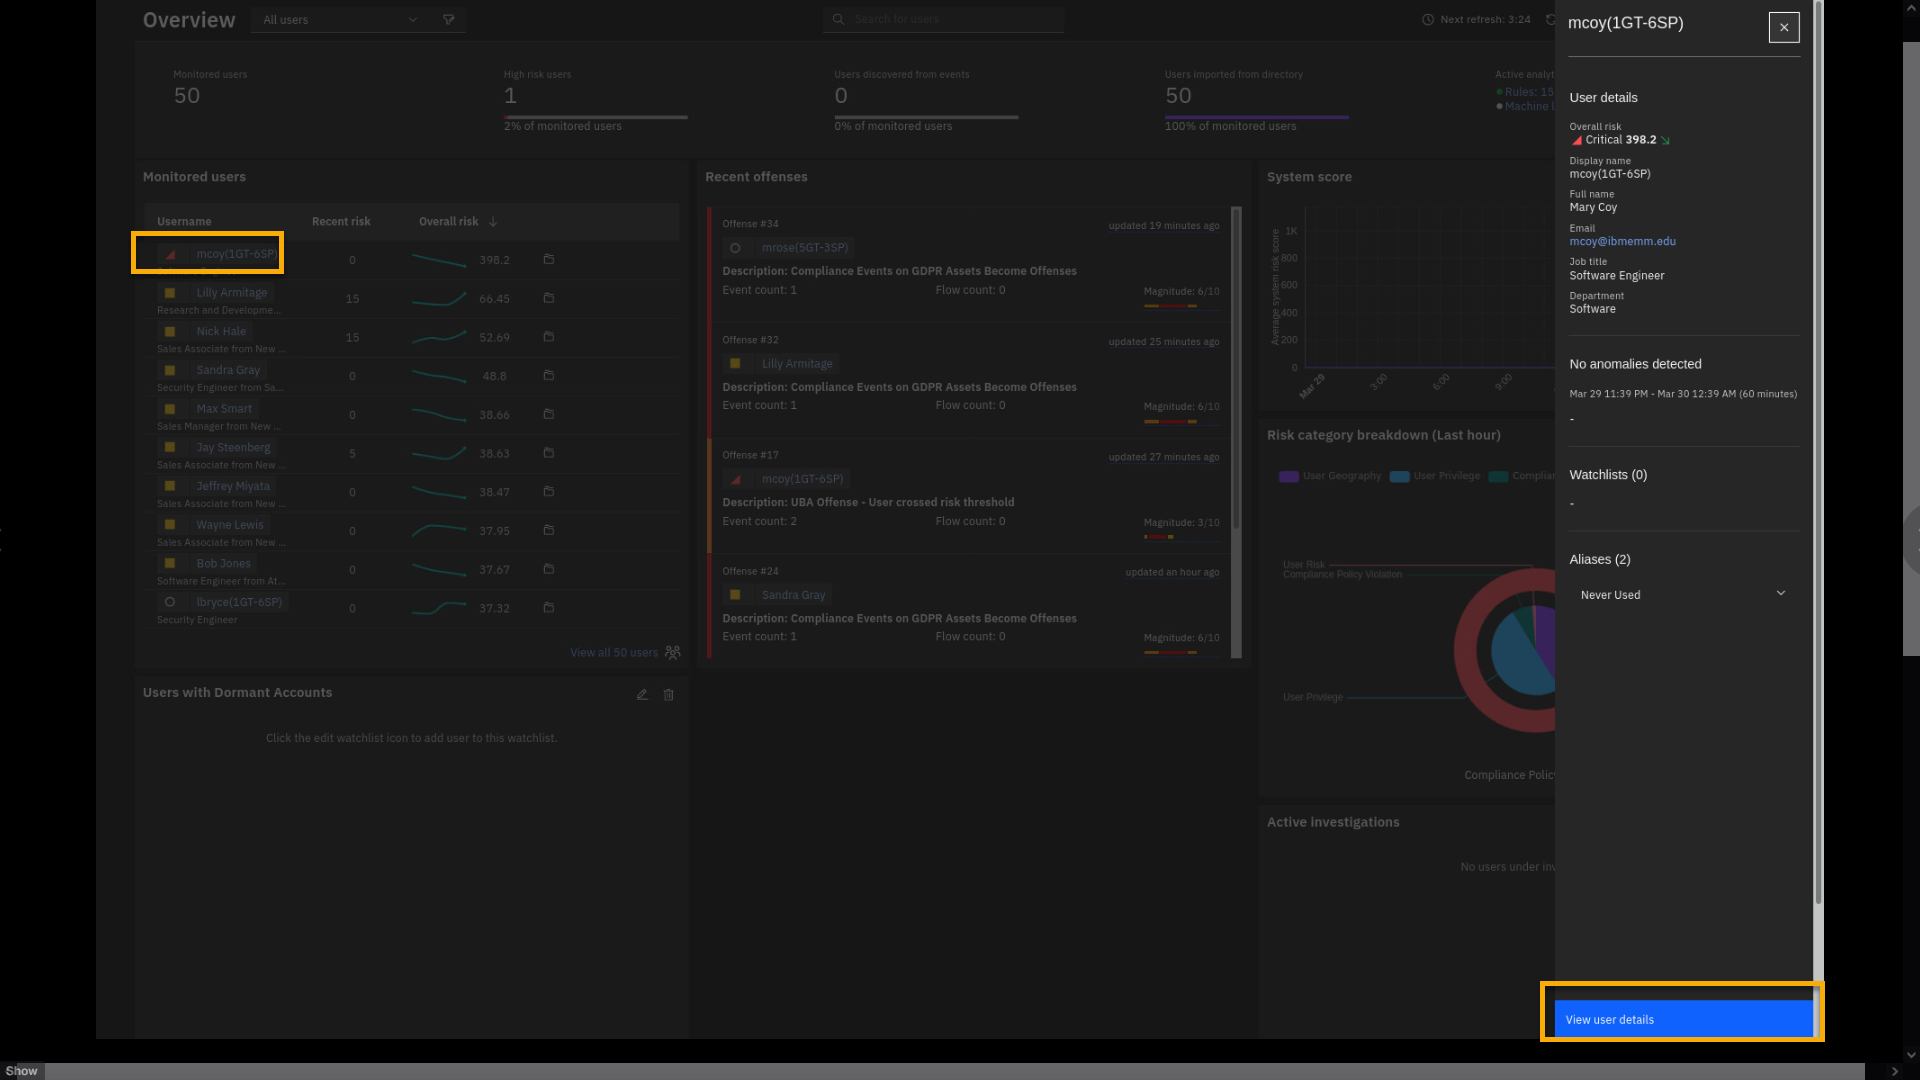
The User details pane shows an overall risk score of 398.2, and the
trend is going down. The down trend means that the current user activity
is decreasing.Note: The risk score is dynamic, and you will have a different
number in your live demo. -
Click View user details.
This loads a new page, giving insights into Mary Coy's activities.
Because we started analyzing the user, you can flag mcoy.This will be on the quiz
-
To mark the user under investigation, click the flag.
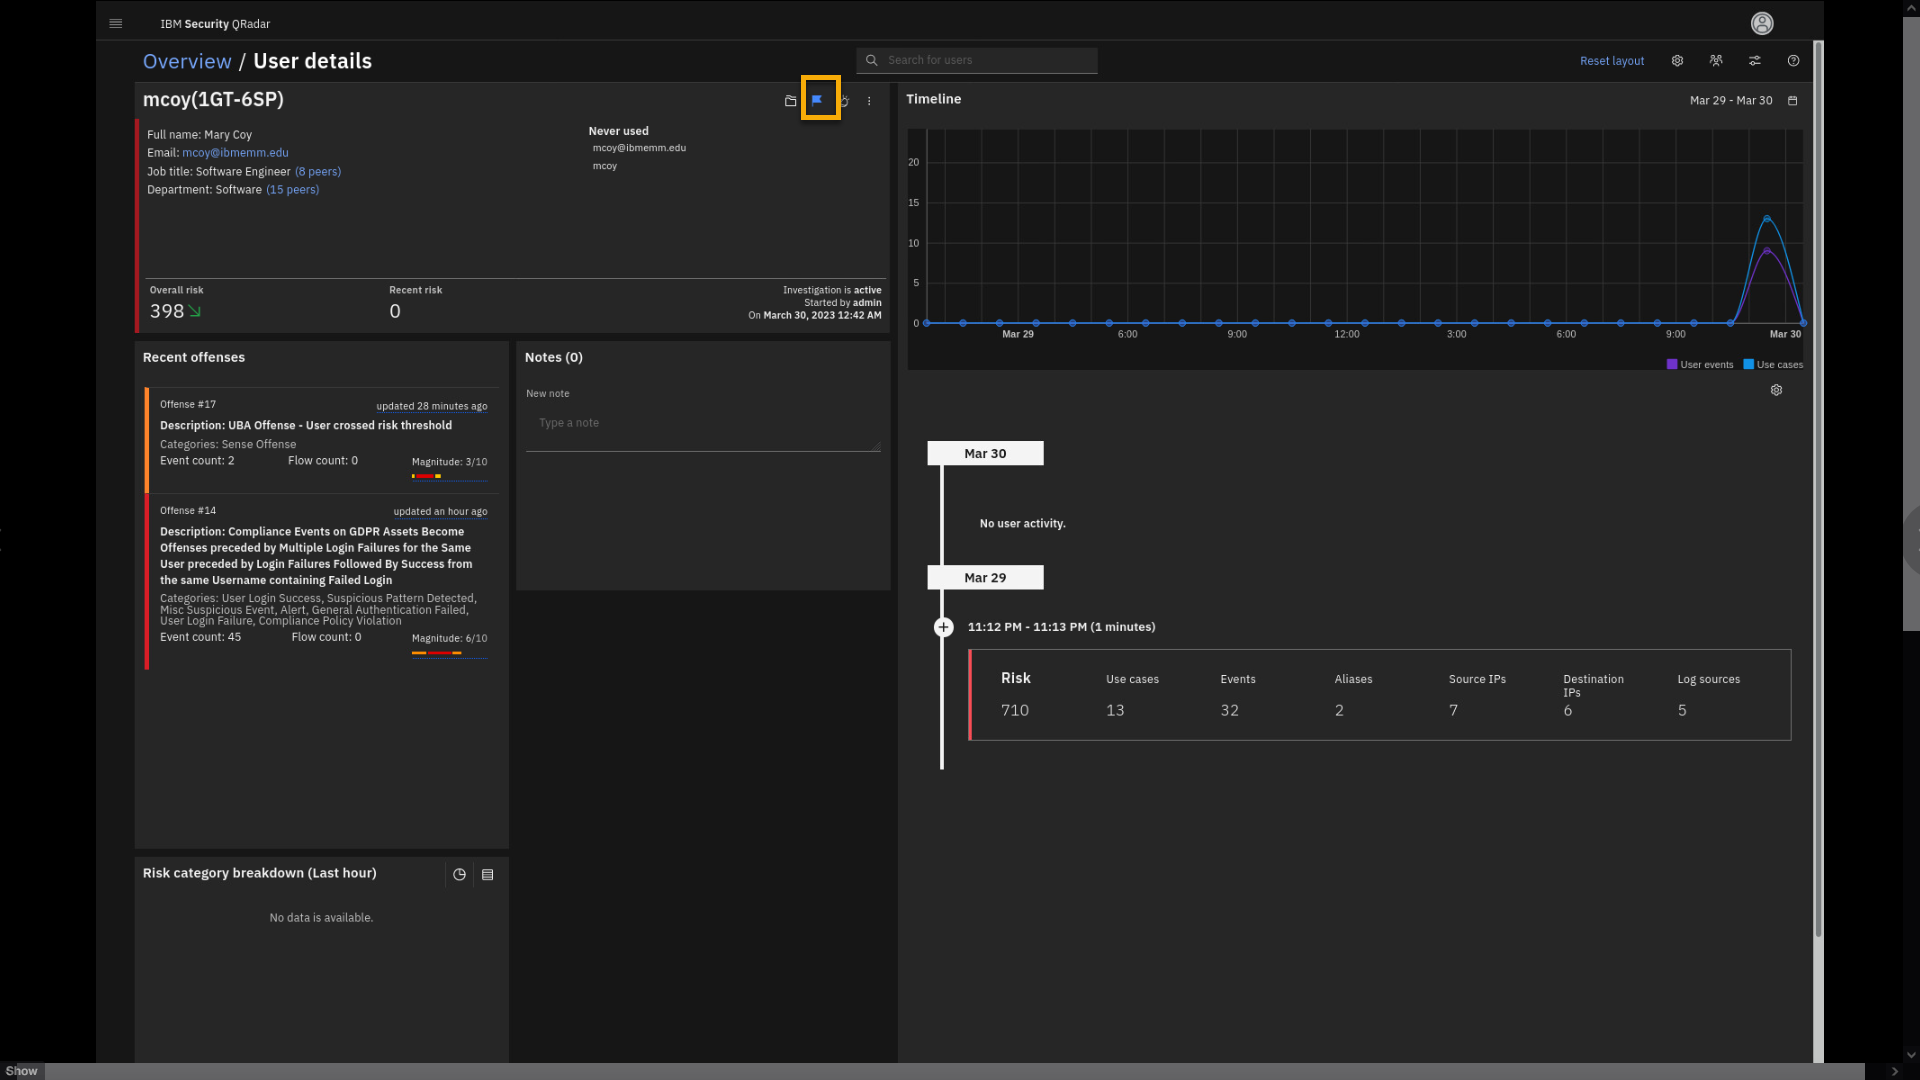
Review the information on the screen.
The top part describes the user, aliases, and the risk score.
The Recent offenses part shows the offenses related to this user's
activity.The timeline graph shows the recorded user activity and the overall
trend.The right lower section also provides information for the user
investigation. It shows the risk score accumulated in the period of
activity and the use cases related to that time. Let's examine it in
some more detail. -
In the activity report, click the Use cases.
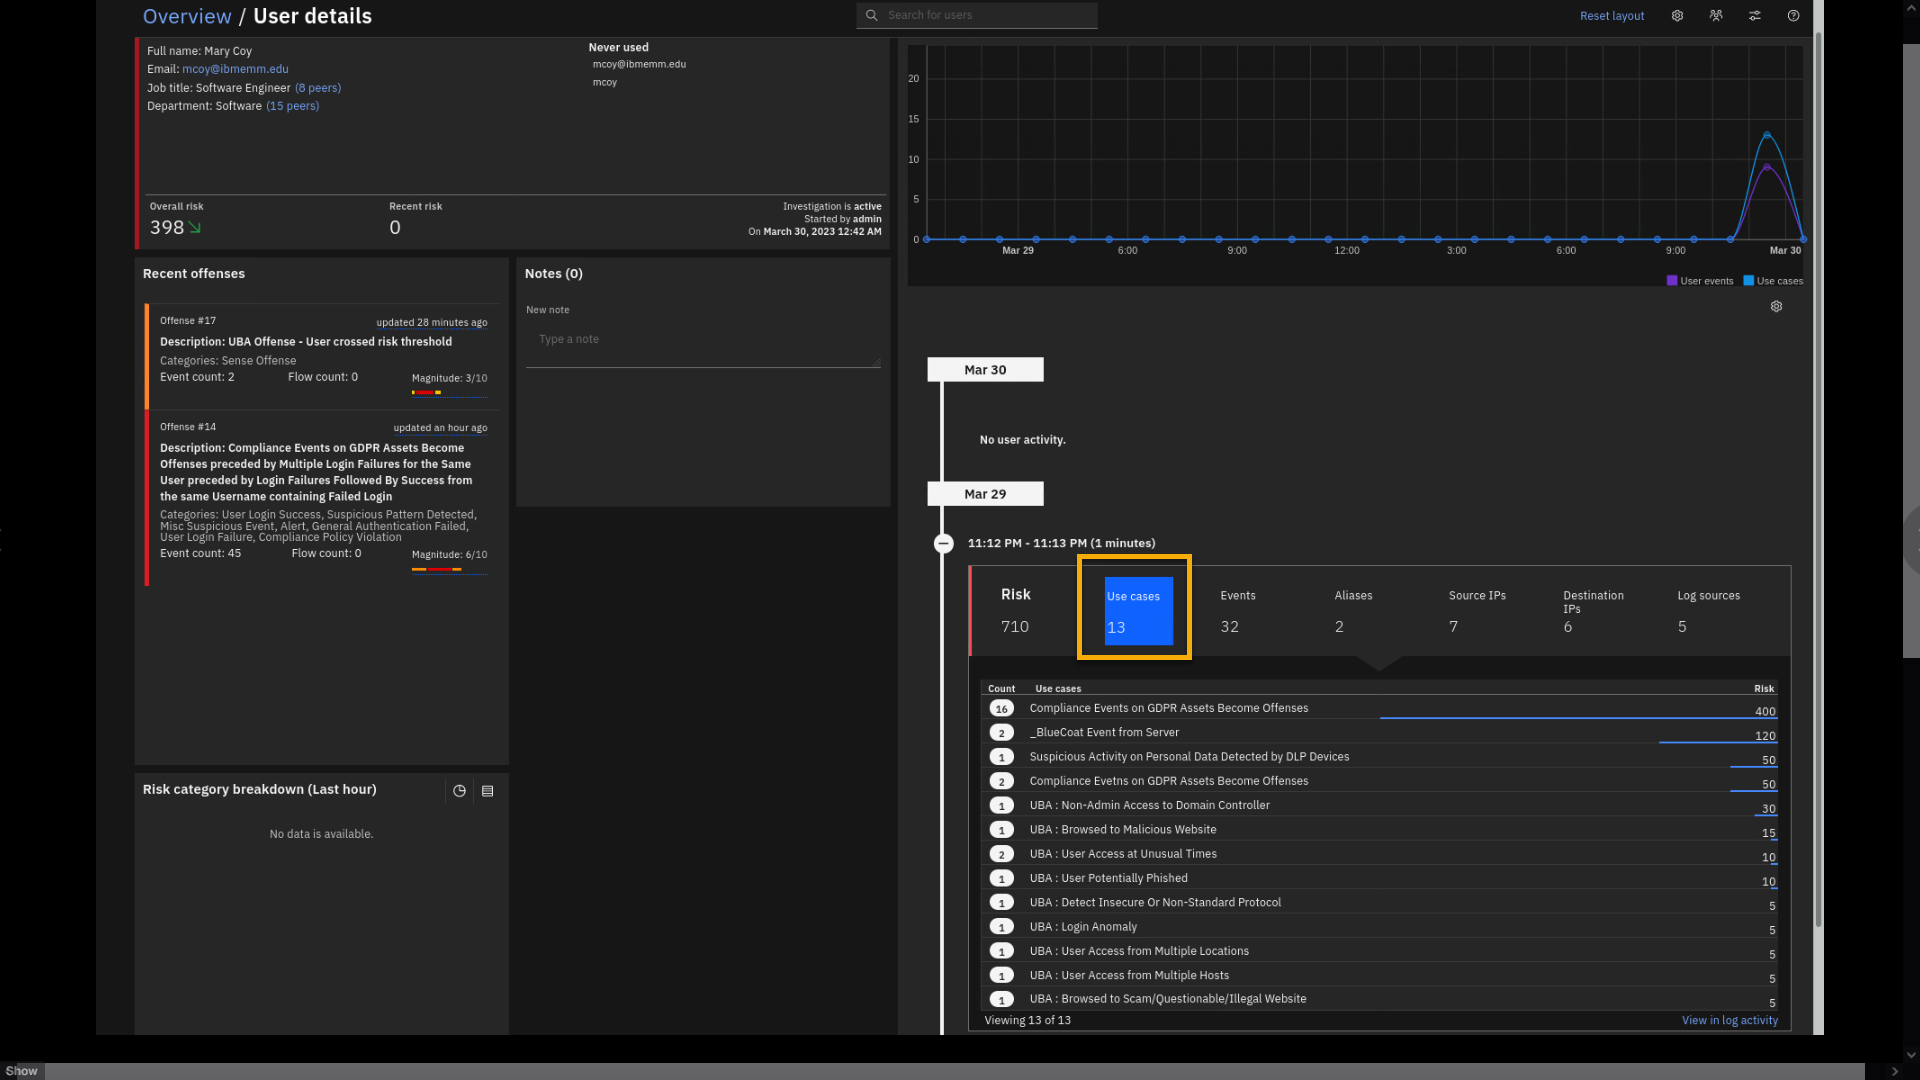
UBA reports on 13 rules (use cases) that contributed to the UBA risk
score and the amount of accumulated risk per use case.You can also review relevant events that contributed to the use cases.
-
Click Events.
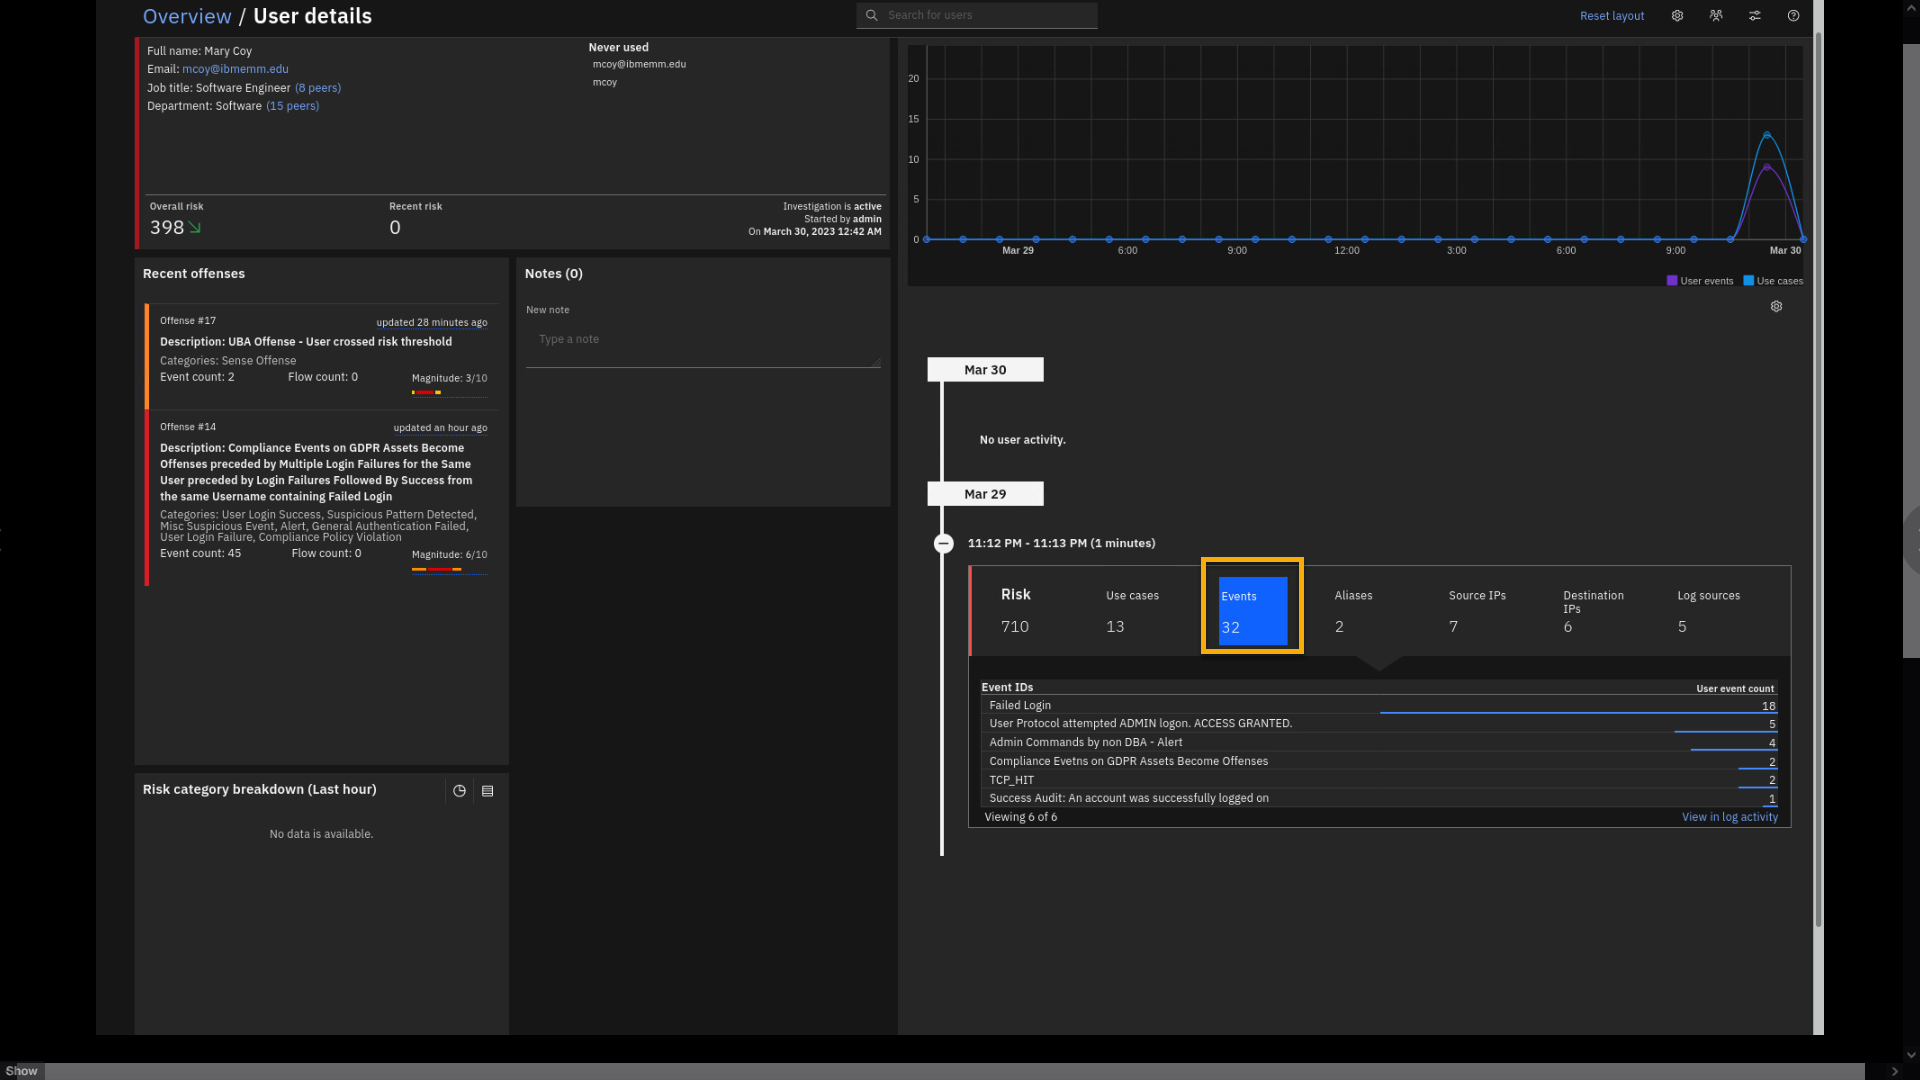
Here you see the Guardium event "Admin Commands by non DBA -- Alert". We
already saw that event as a part of the GDPR offense. We also see some
other events that are reported as mcoy activity. -
Click Aliases.
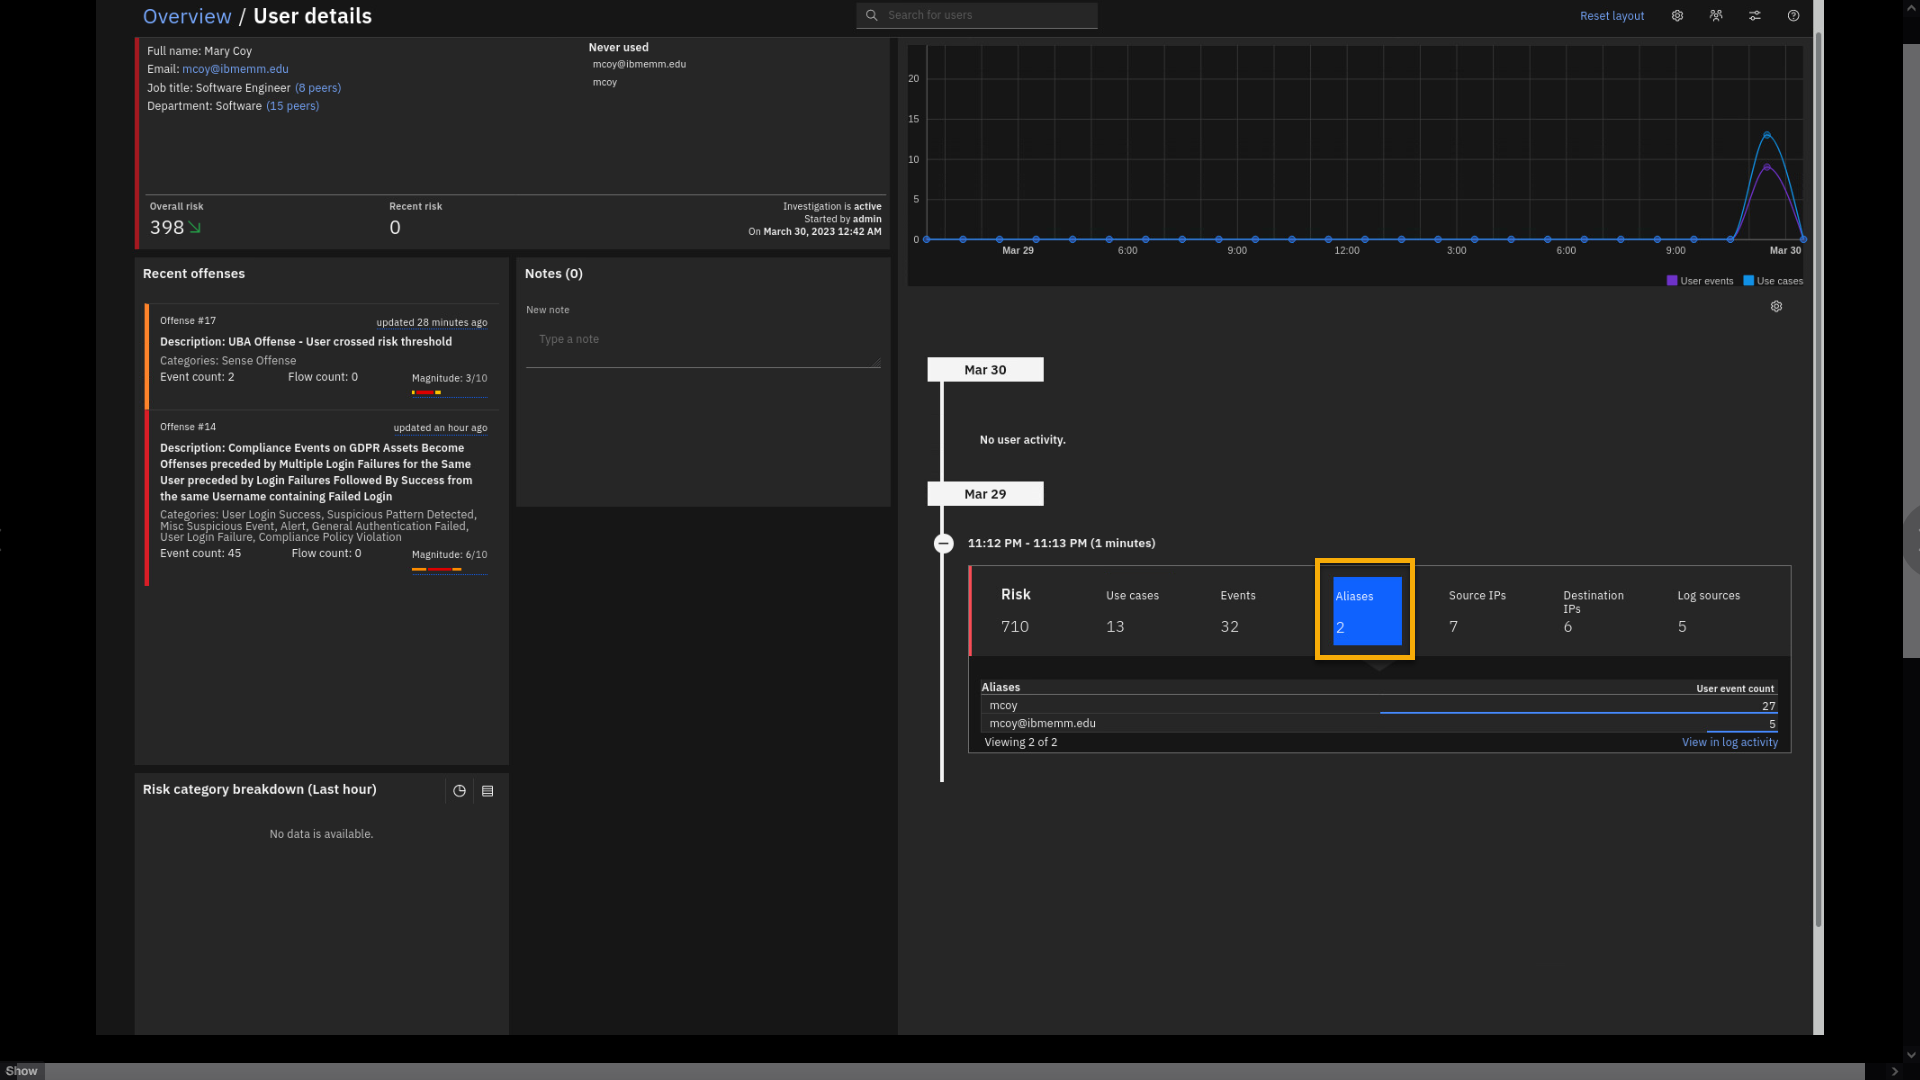
The aliases view shows all account variations in the logs associated
with the same user. In other words, user activity on some systems can be
tracked by email address, and on others, it can be Windows login ID,
Linux® user ID, or others. All those different accounts are associated
with a single user persona and contribute to the overall risk score.The source and destination IP shows all IP addresses participating in
the user activity. -
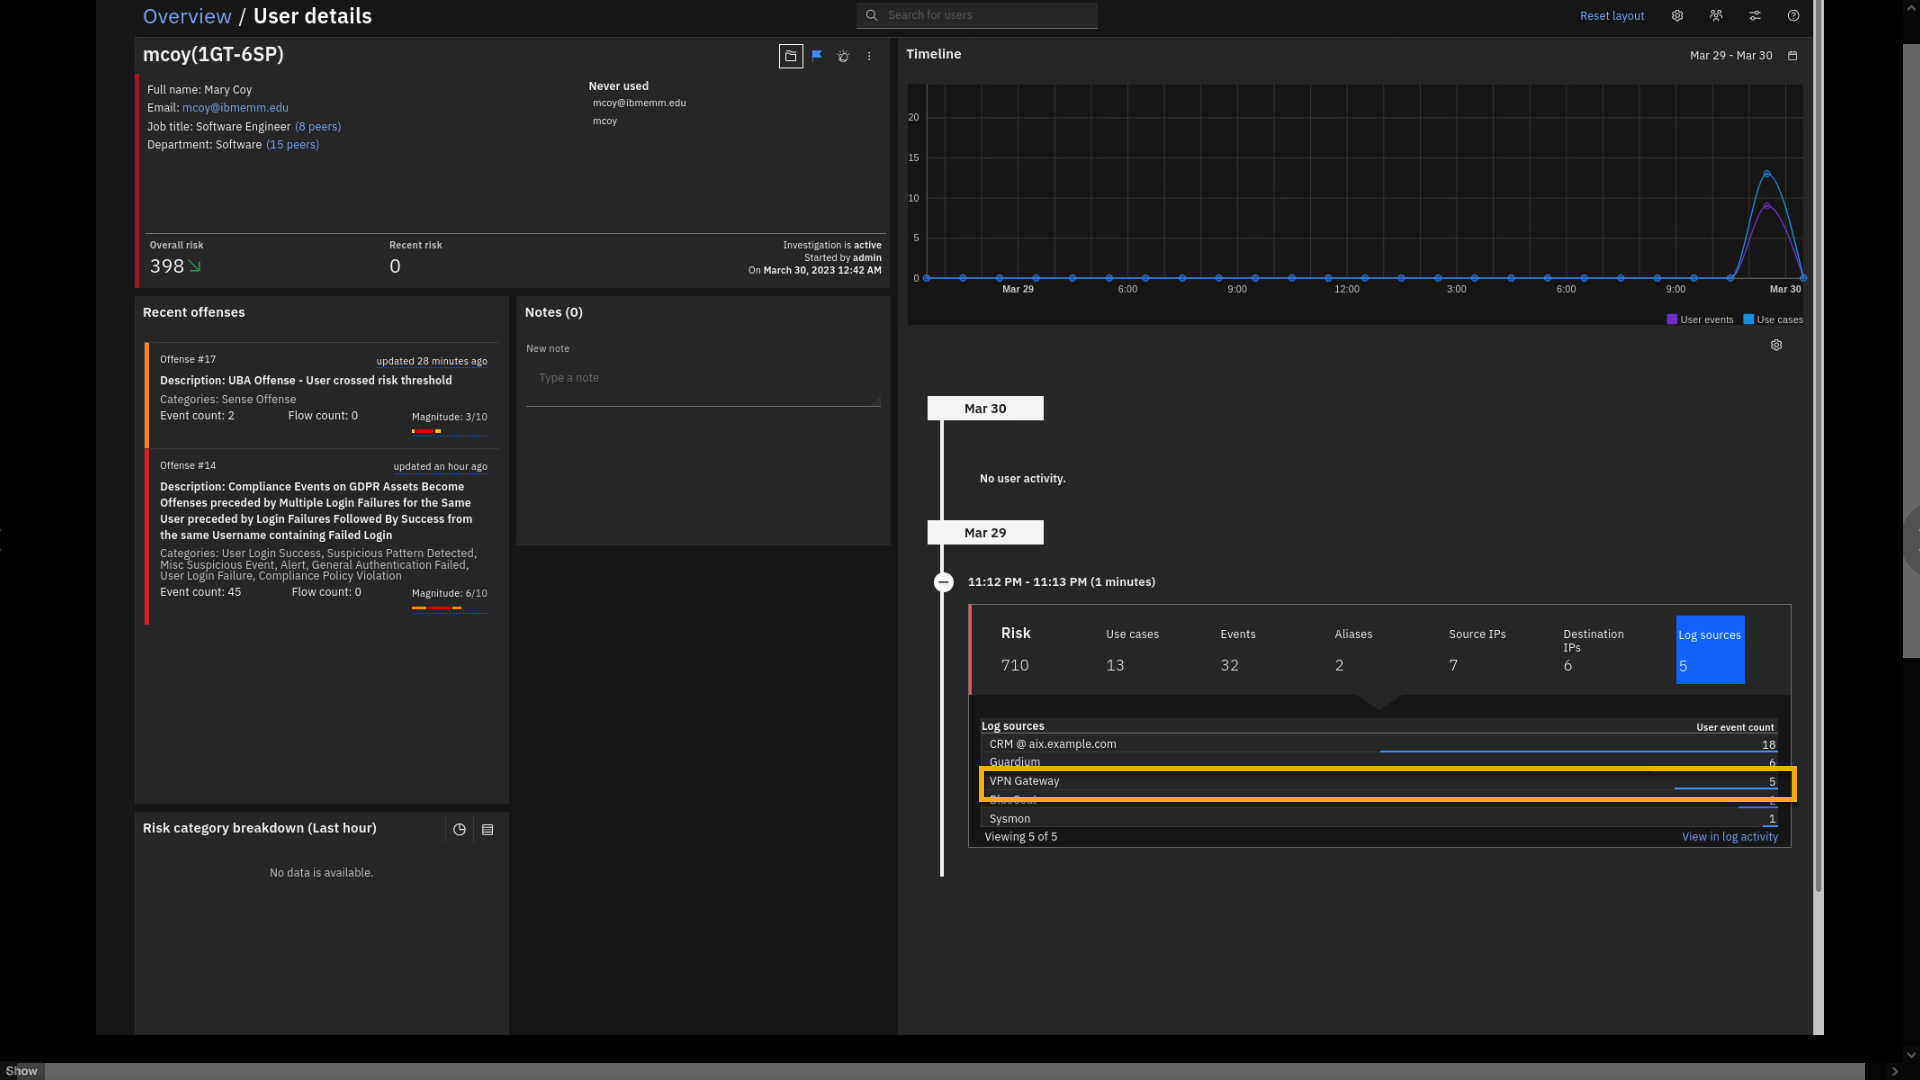
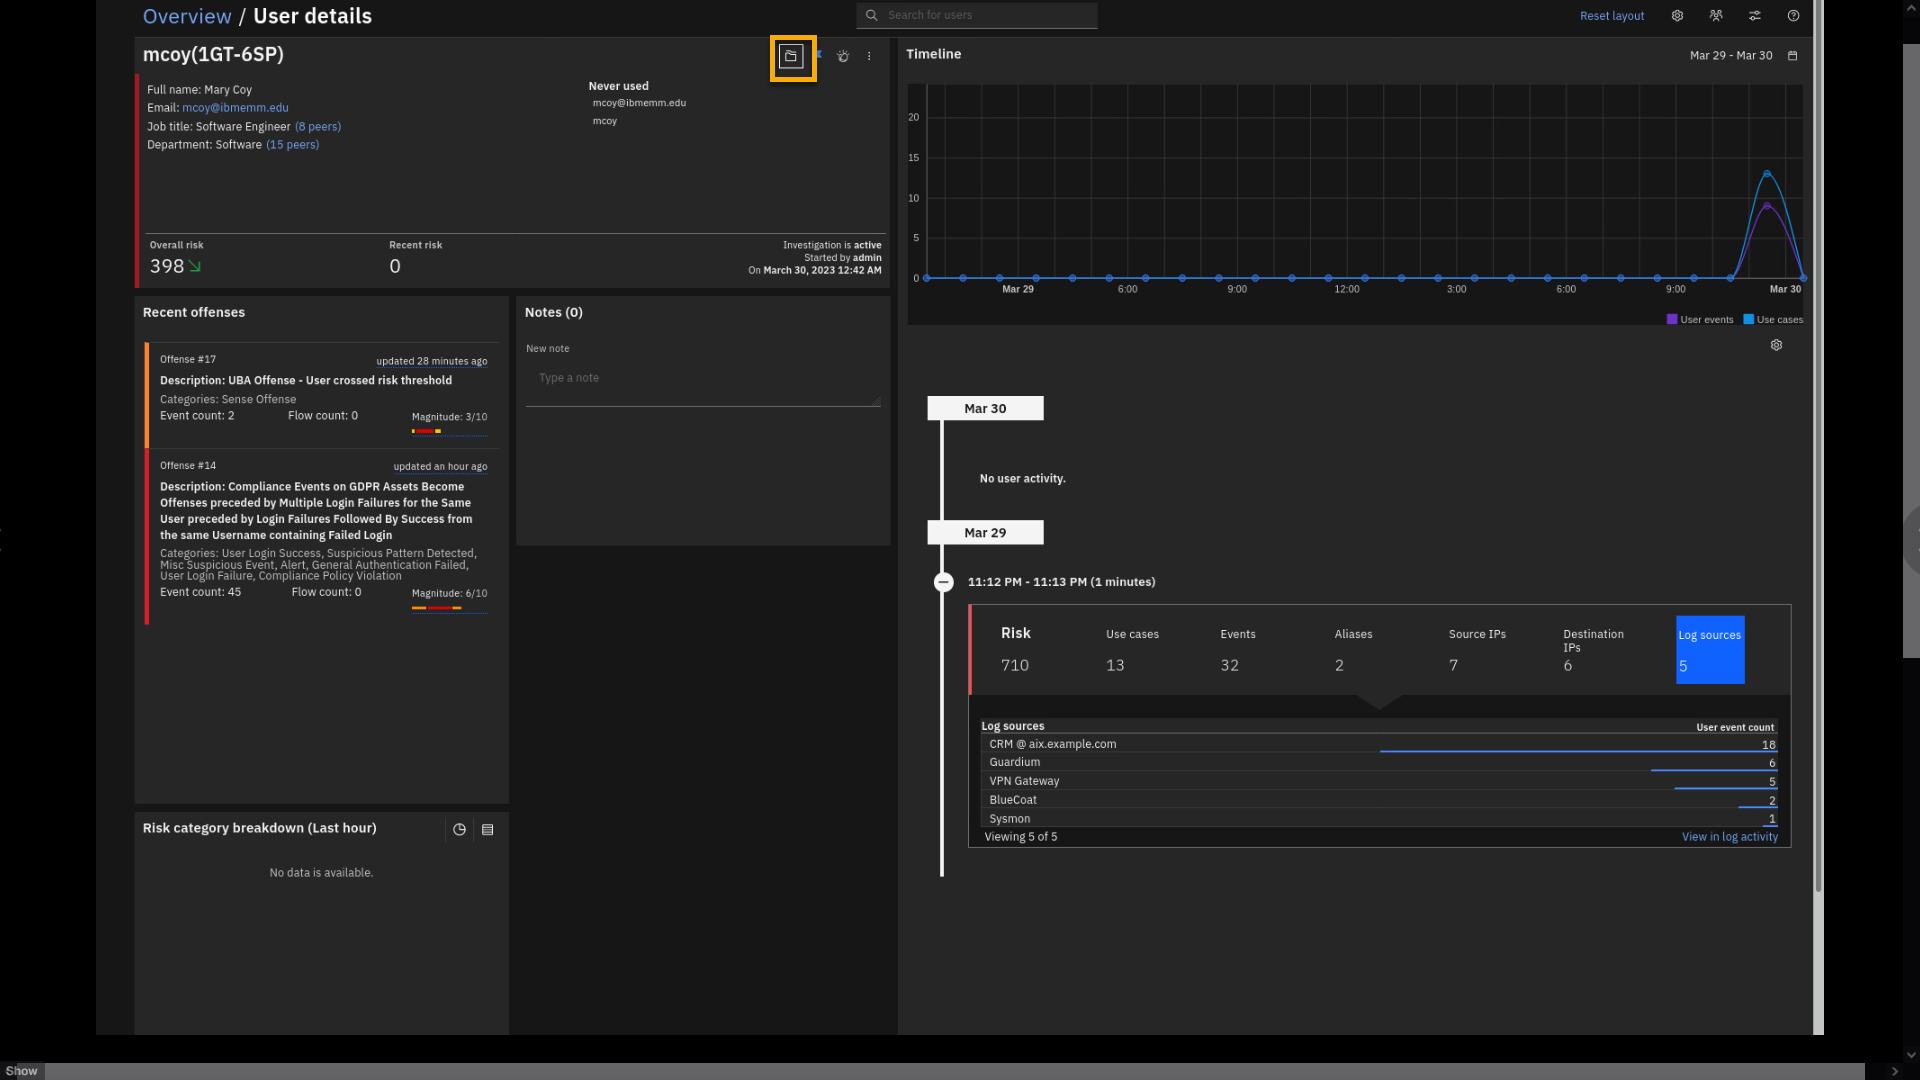
Click Log Sources.
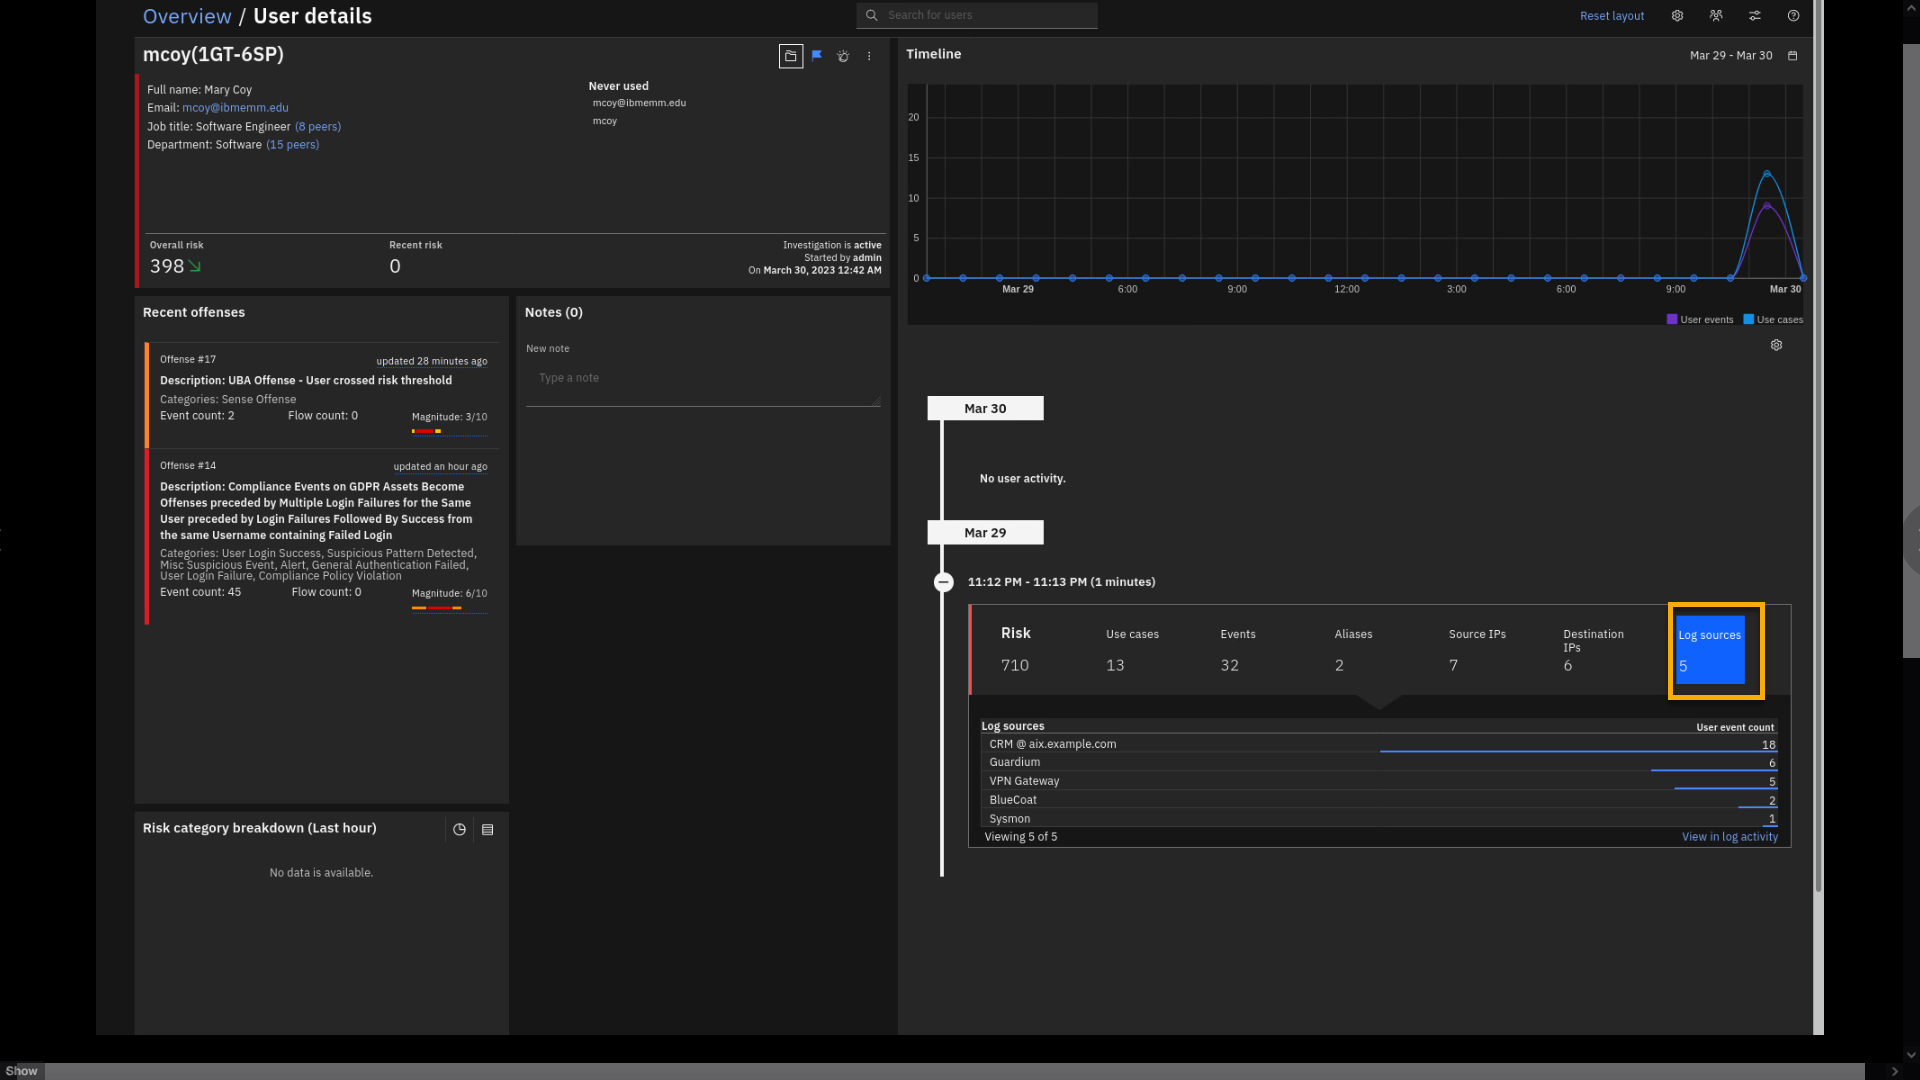
Log sources also show the compelling aspect of user analysis. This view
shows the log sources that have reported user activity. For example,
user mcoy has reported activity on the VPN Gateway. Let's see the
events associated with this log source and user mcoy. -
Click VPN Gateway.
-
Review the VPN related log events.
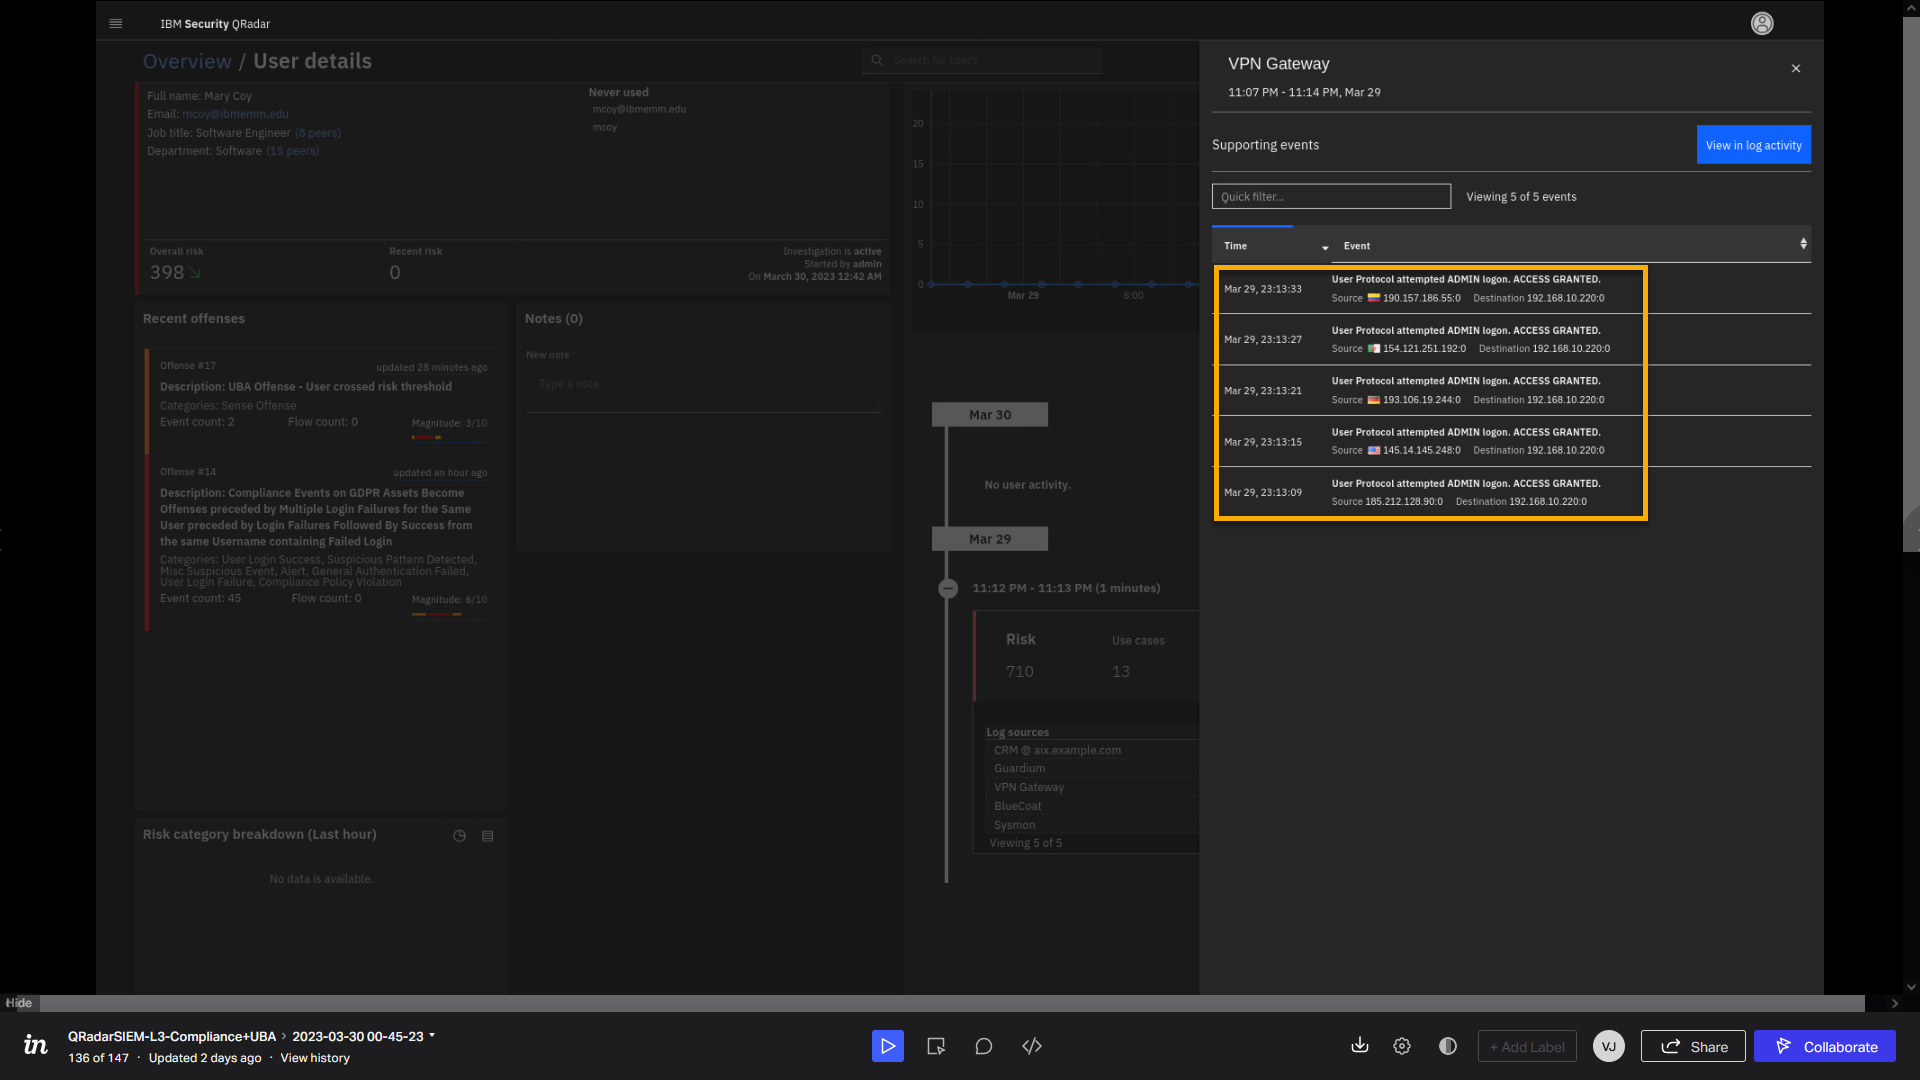
At this view, we see from what countries user mcoy has authenticated on
the VPN gateway. Let's look at the Guardium logs. -
Close the VPN Gateway events.
-
Under Log sources, click Guardium.
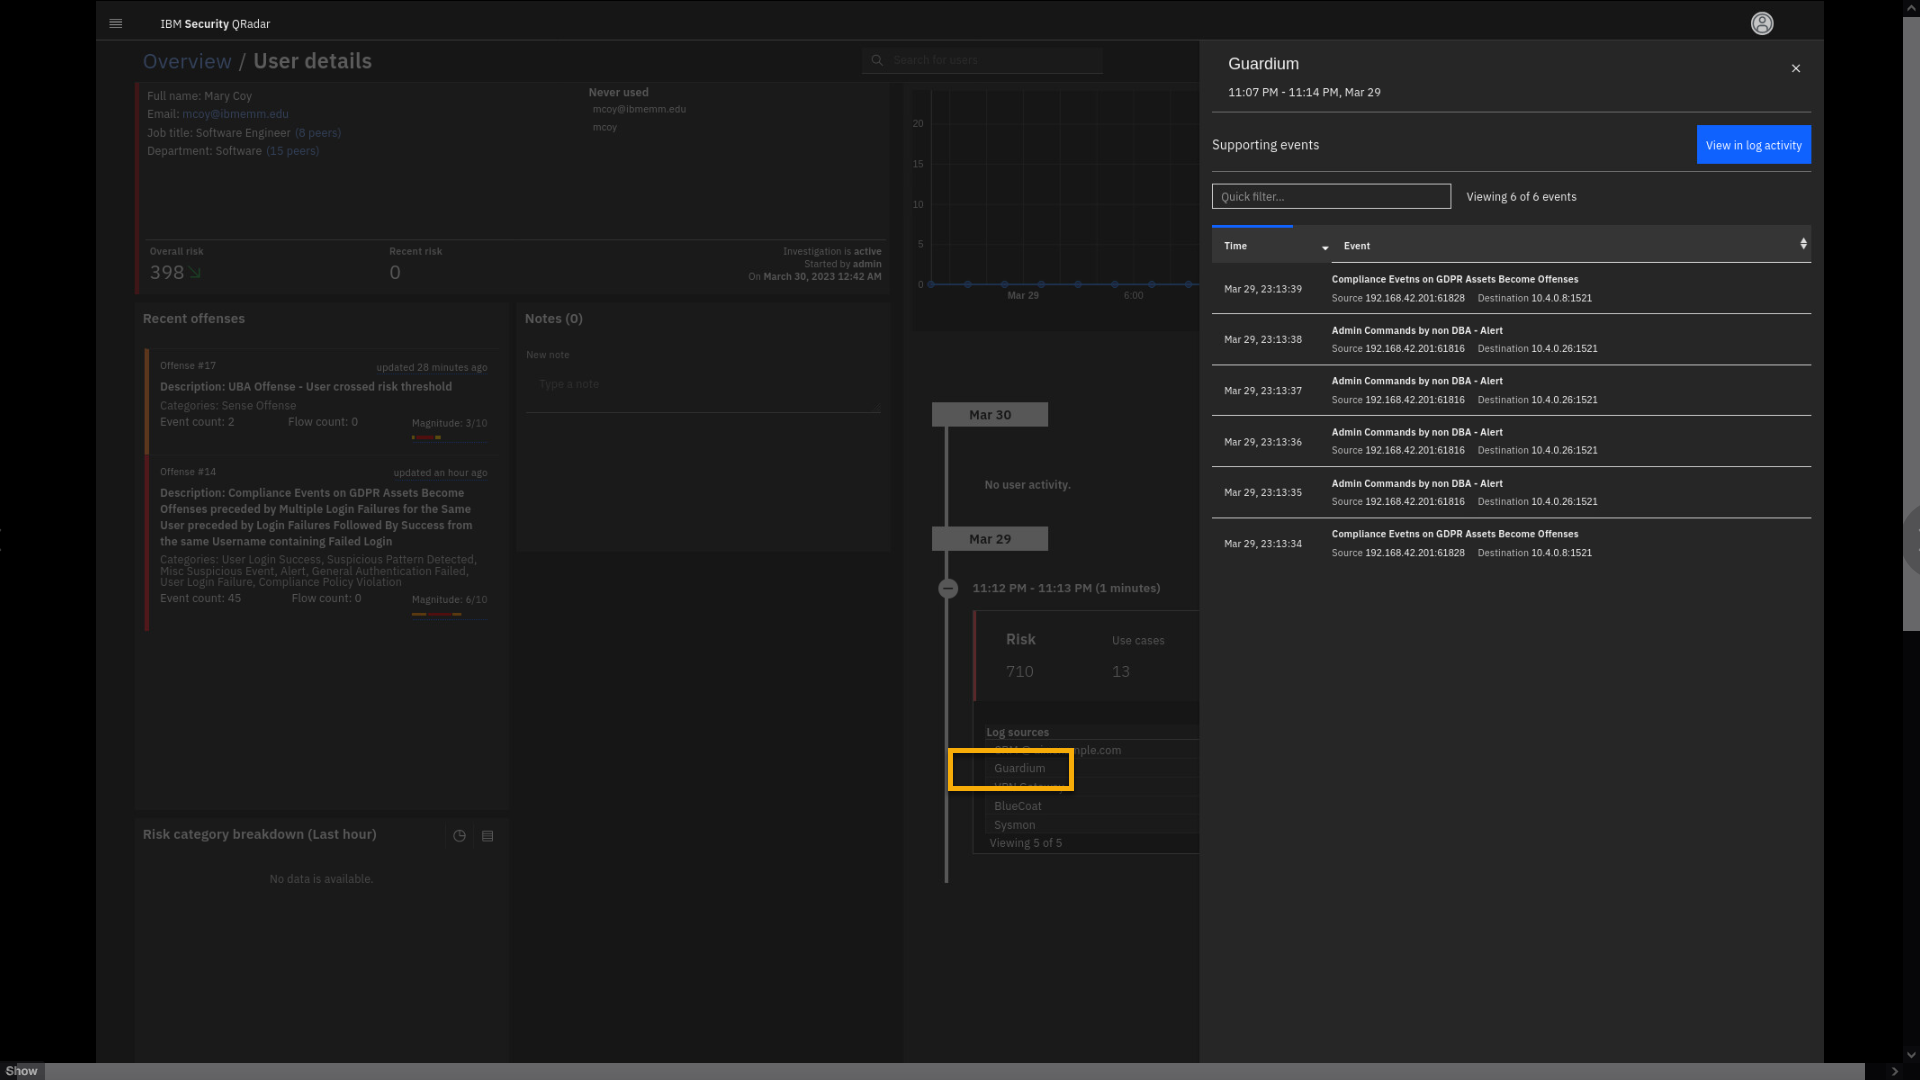
Now, we see the events reported by Guardium indicating mcoy activity on
the database that is located at 10.4.0.8 and 10.4.0.26 IP addresses. -
Close the Guardium events.
Let's also see what user activity is recorded on the BlueCoat proxy
appliance. -
Click the BlueCoat logs.
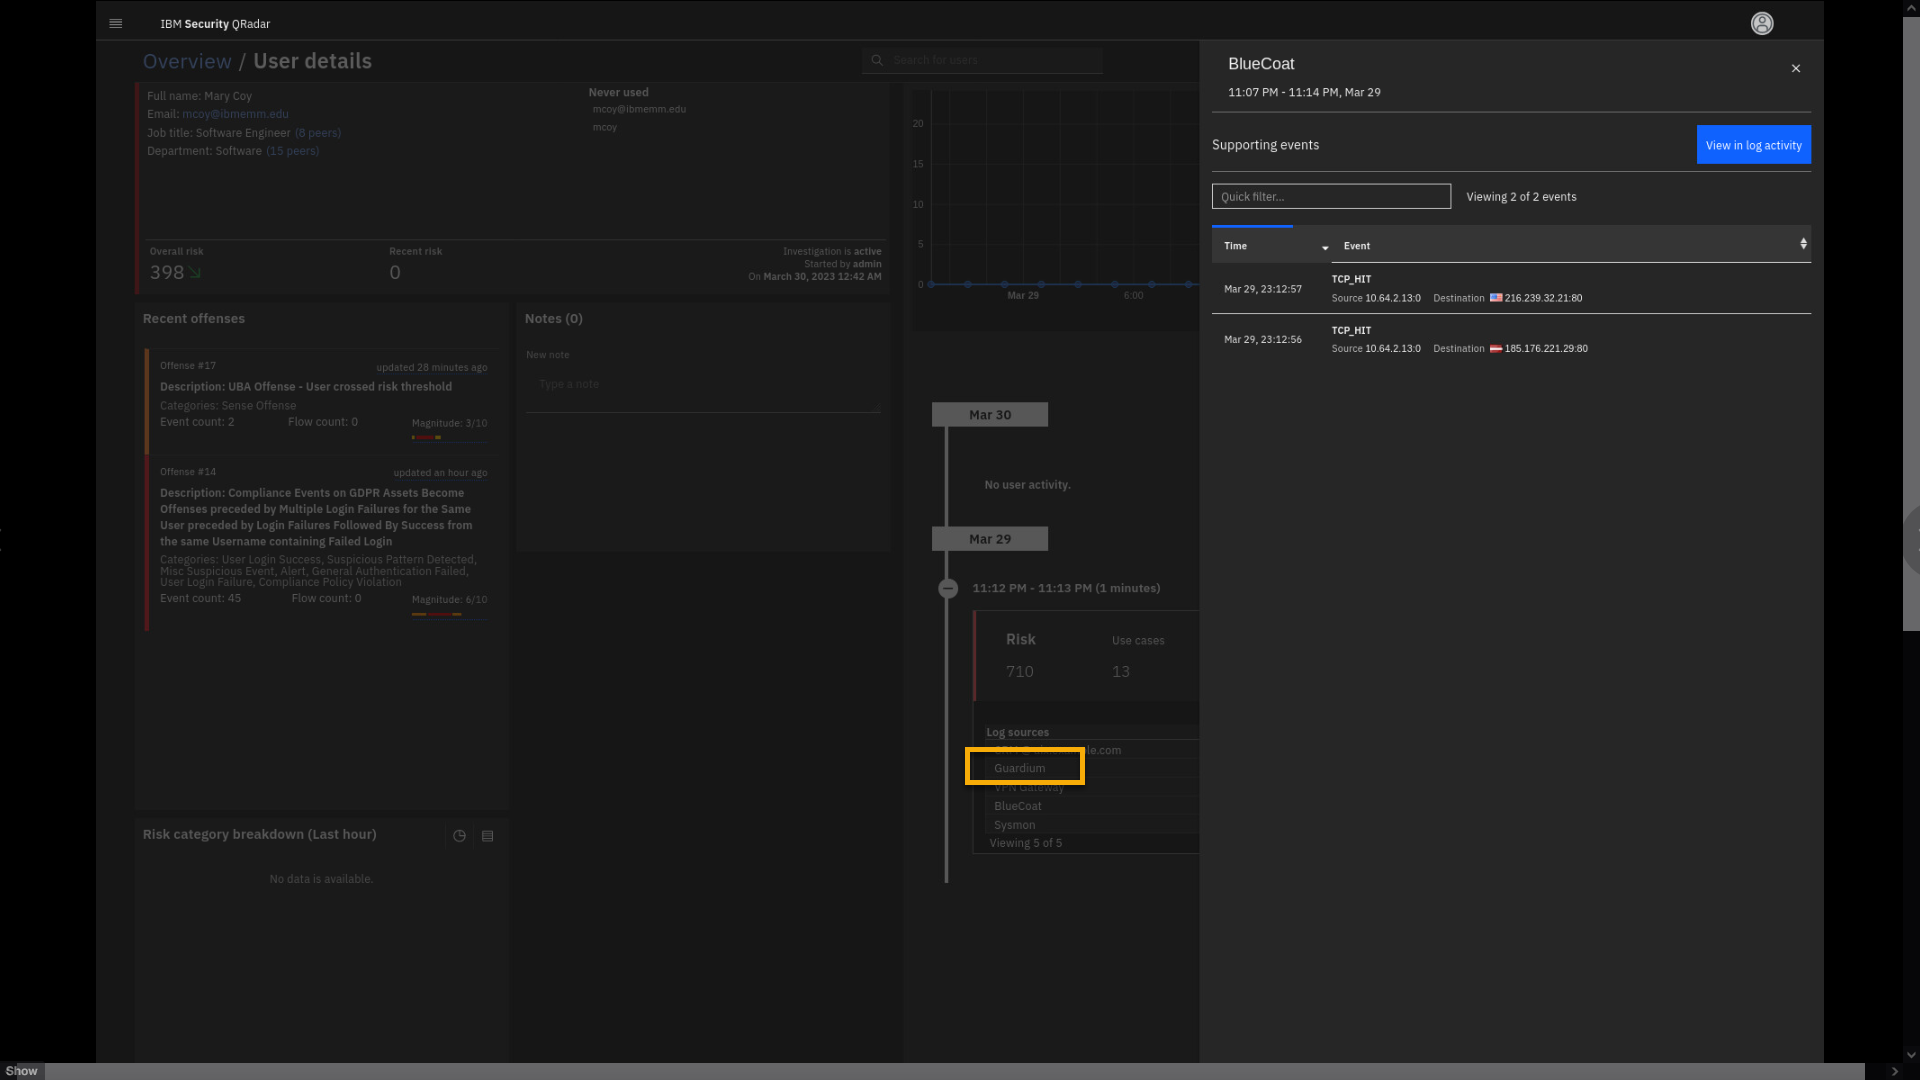
Without going into a lot of the details, note the remote IP addresses
accessed by mcoy. -
Close the BlueCoat events window.
Now, we want to show the power of watchlists in the UBA.
You can create a watchlist to monitor and manipulate with user behavior
risk score based on different attributes. -
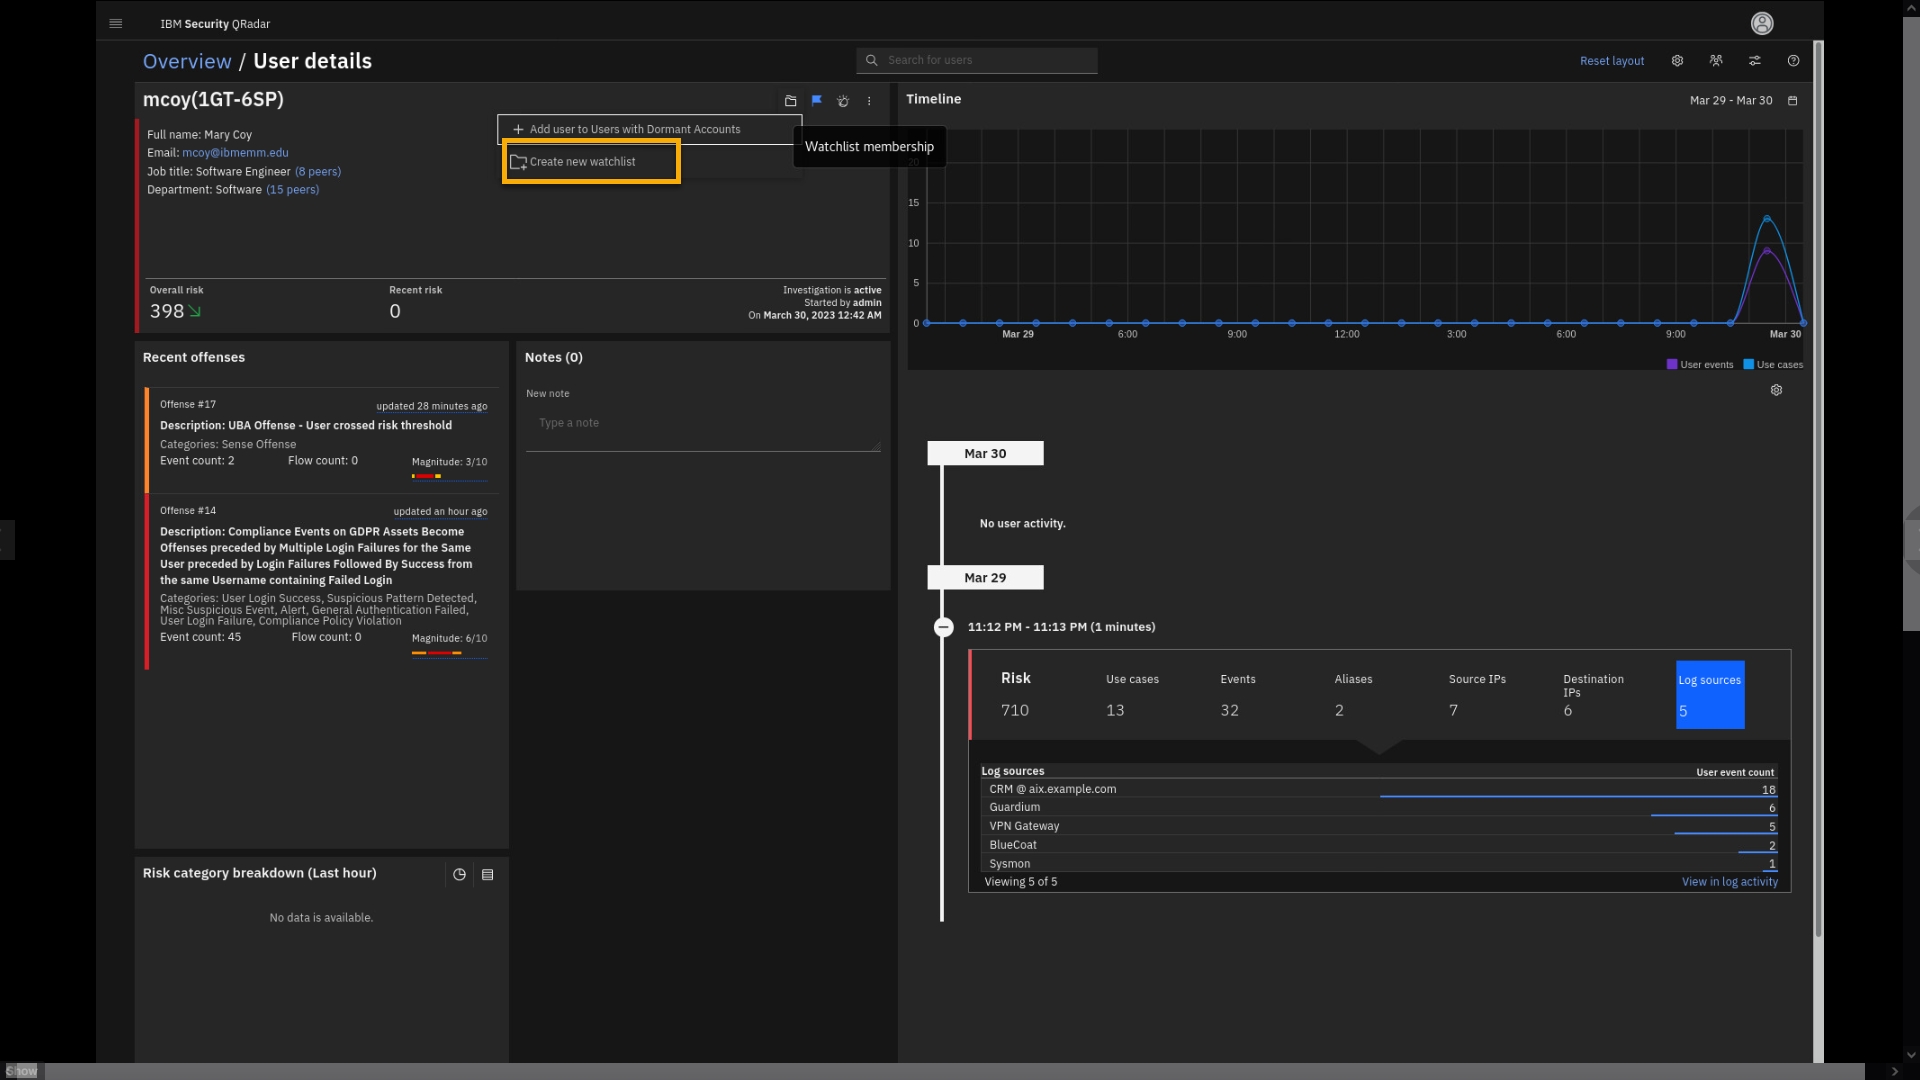
At the mcoy account summary widget, click the watchlist icon.
-
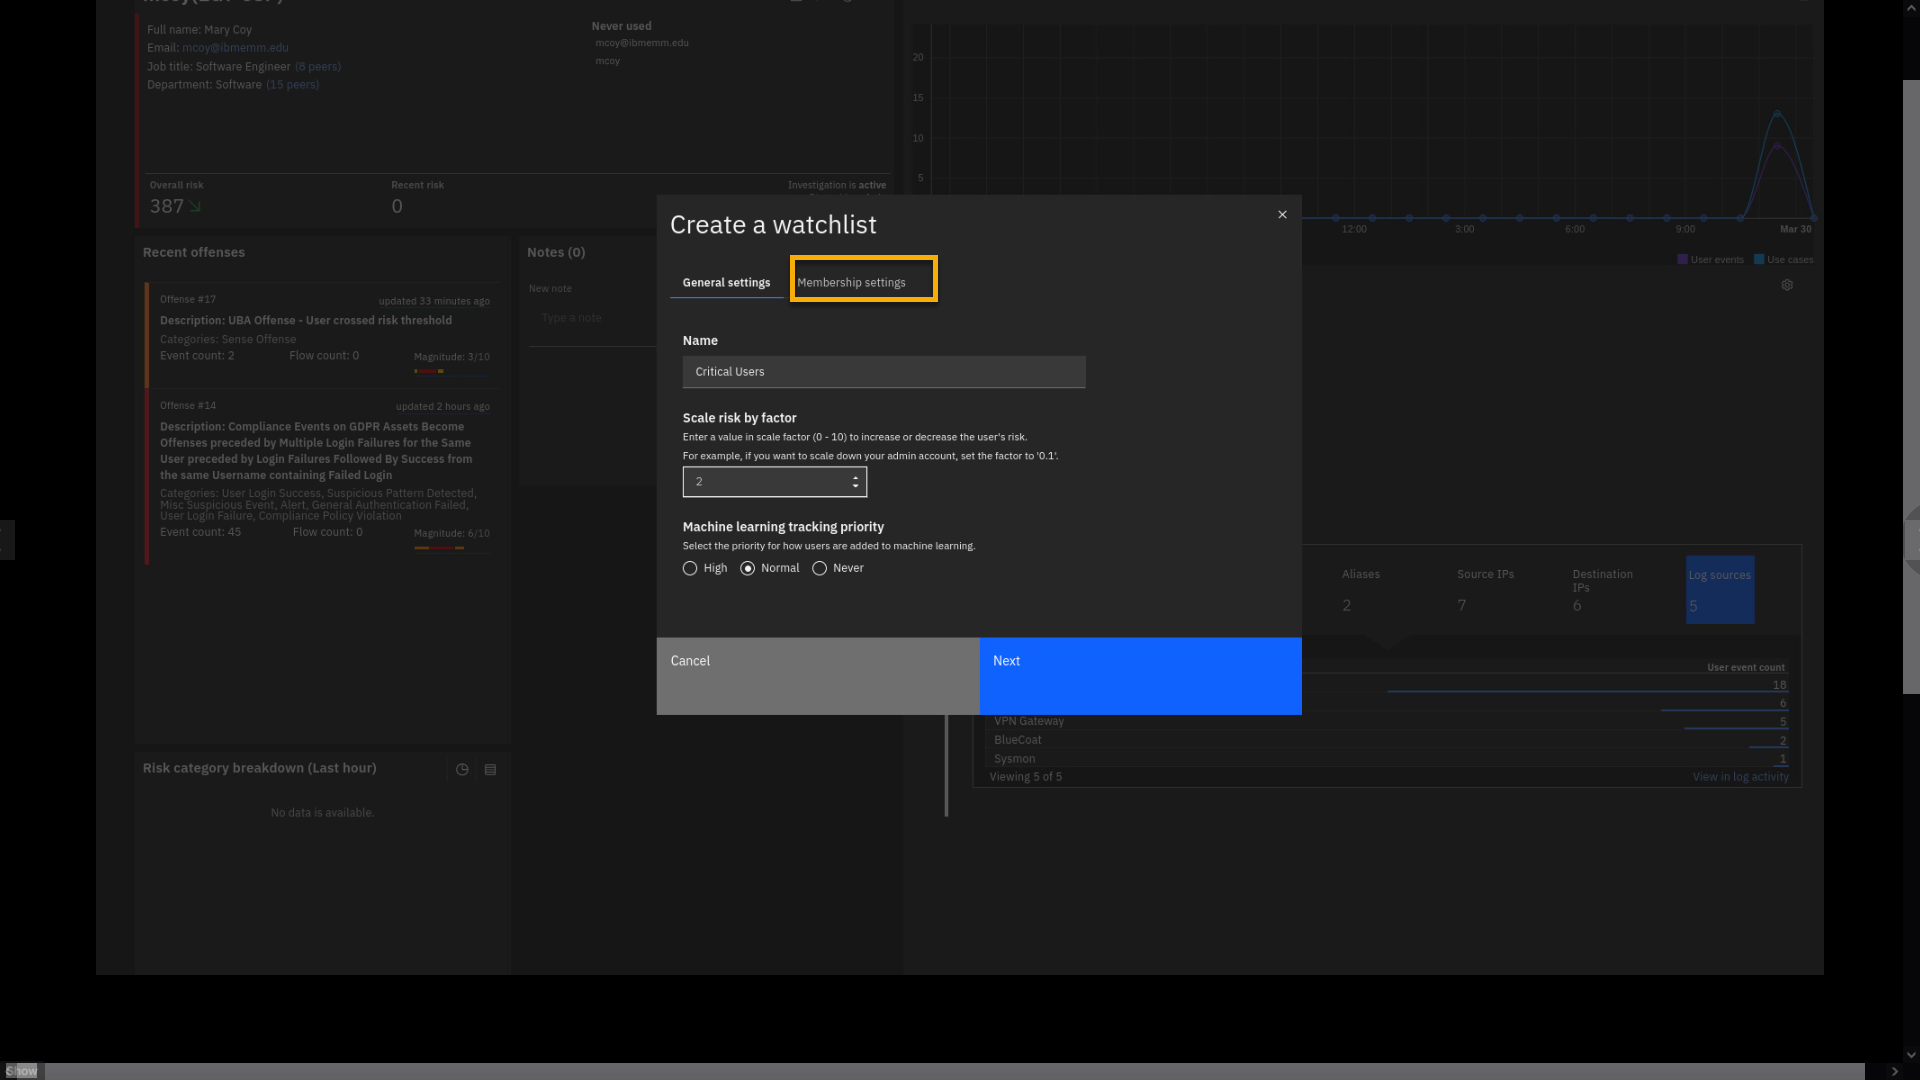
Click Create new watchlist.
-
In the Create a watchlist window, click the Name field and type
Critical Users.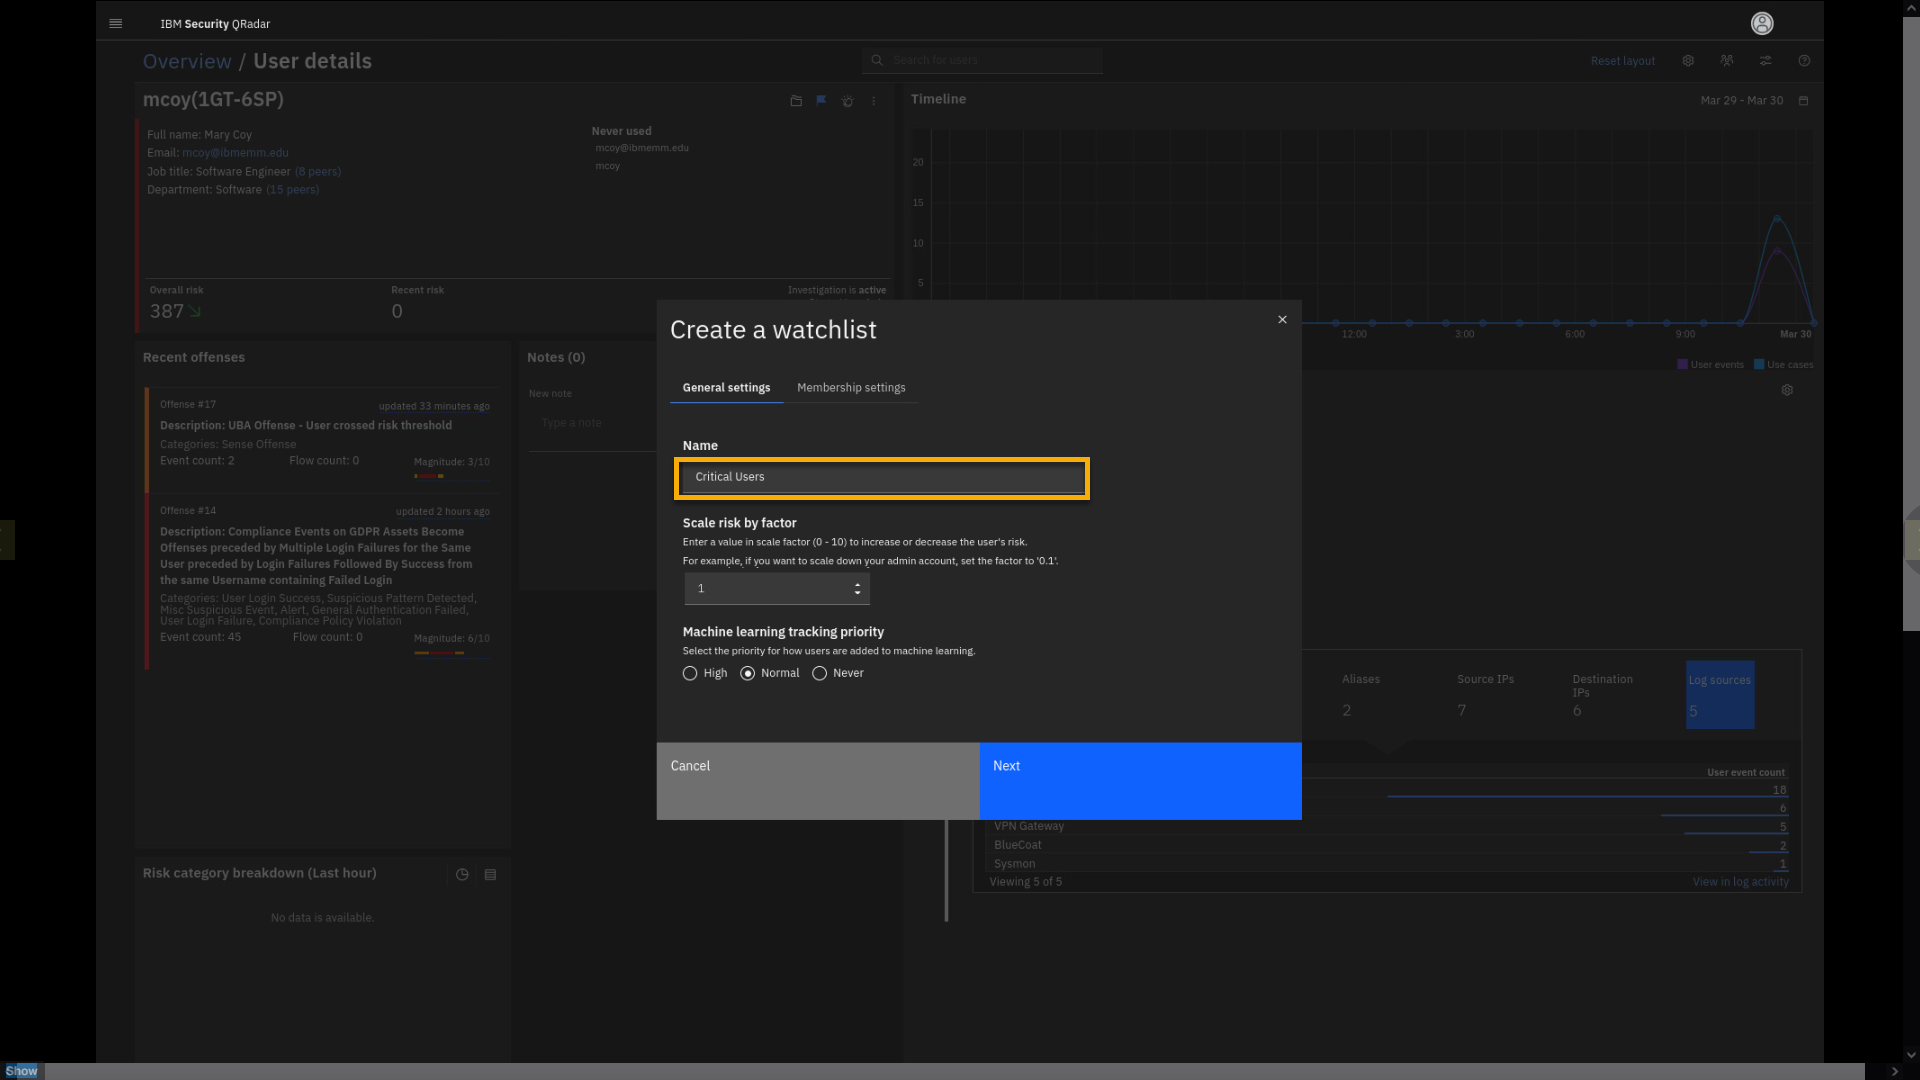
The watchlist helps you to fine-tune the risk score. For example, for
the users on the critical users list the behavior risk scores should be
two times greater than for a regular user. Another example can be admin
privilege accounts or executive accounts that are subject to whaling
(phishing) attacks. -
Click Scale Risk by factor field and type 2.
Note, if the risk score factor is between zero and one, the overall risk
score for the watchlist members will decrease.Let's select the members of this watchlist.
-
Click Membership settings.
-
Review the membership page.
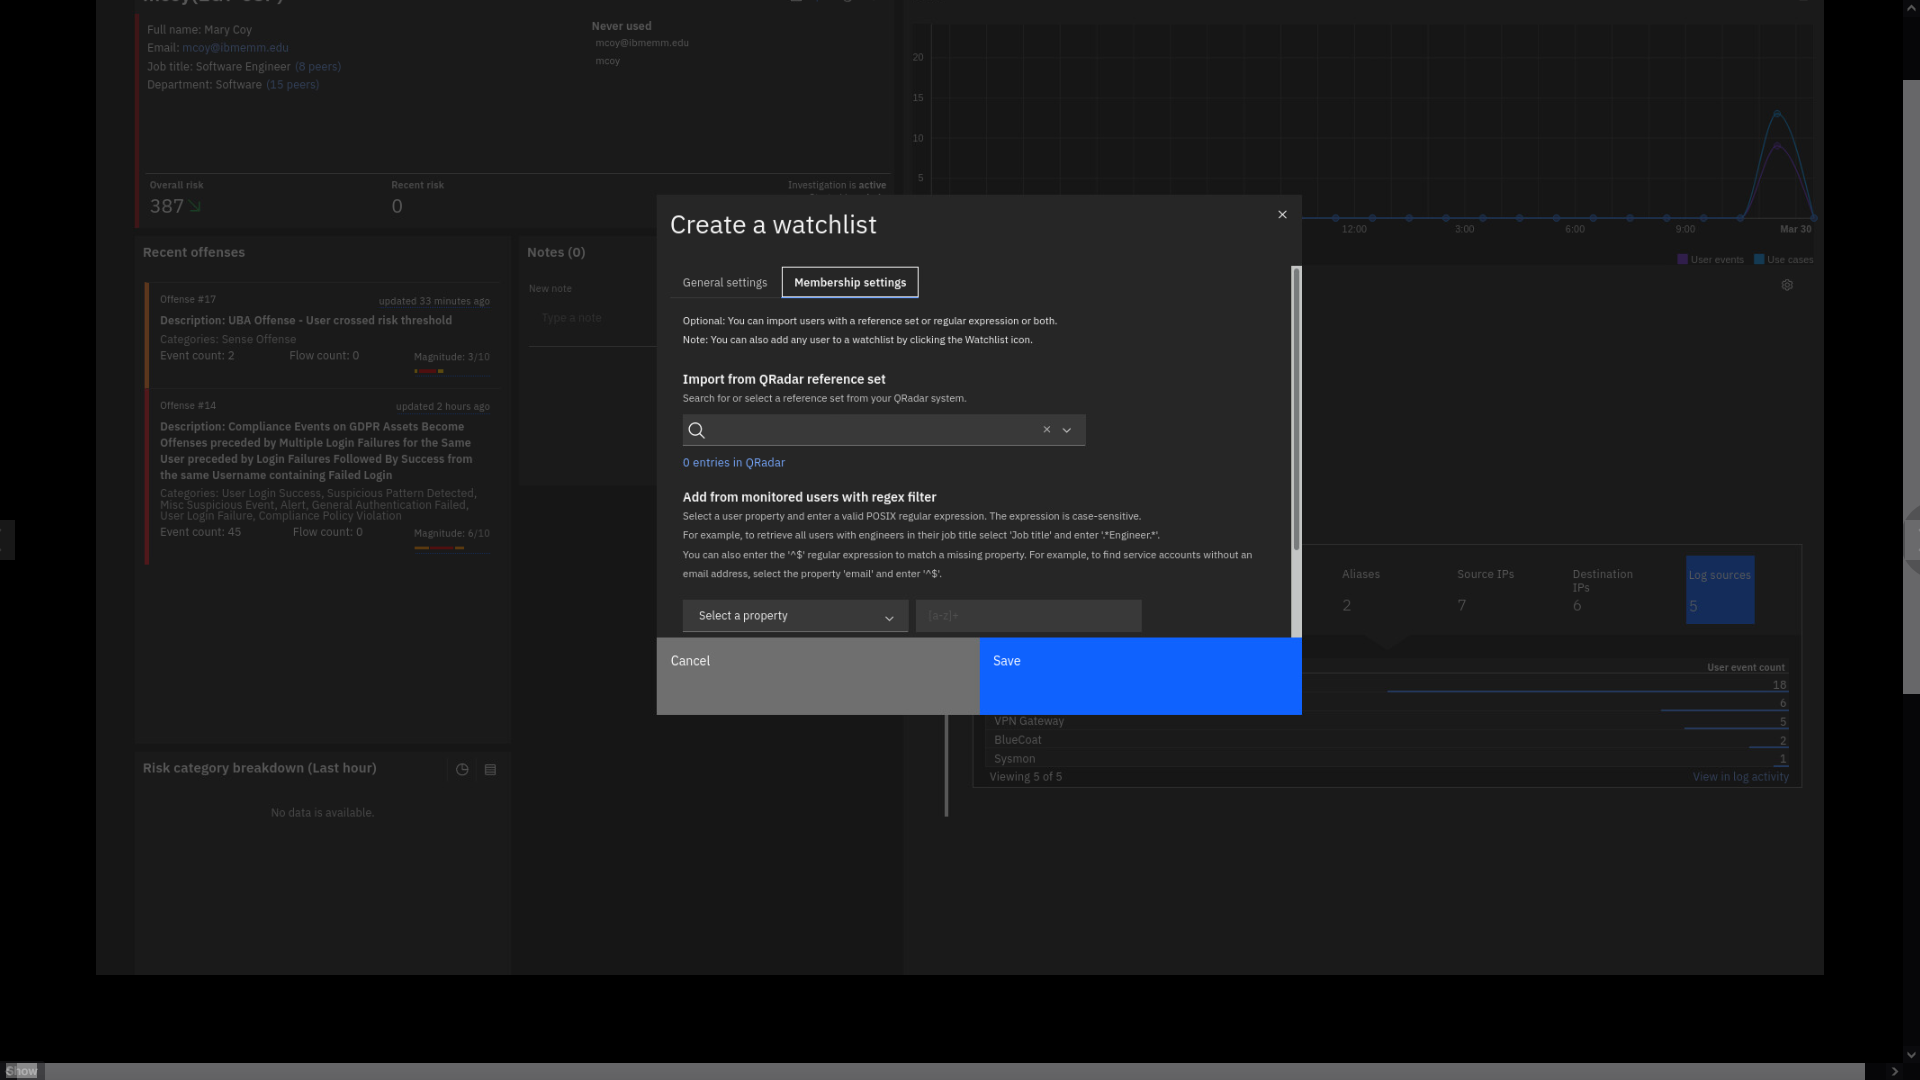
On this page, you can create the rule to define users' membership to the
watchlist by using different properties and regular expressions to match
them. Also, you can pick the reference list containing user accounts
that you are interested in monitoring. -
Click the Reference set field, and type UBA.
Note: If the search does not yield any results, manually scroll down
the list to make your selection. -
Select the UBA : Executive Users reference set.
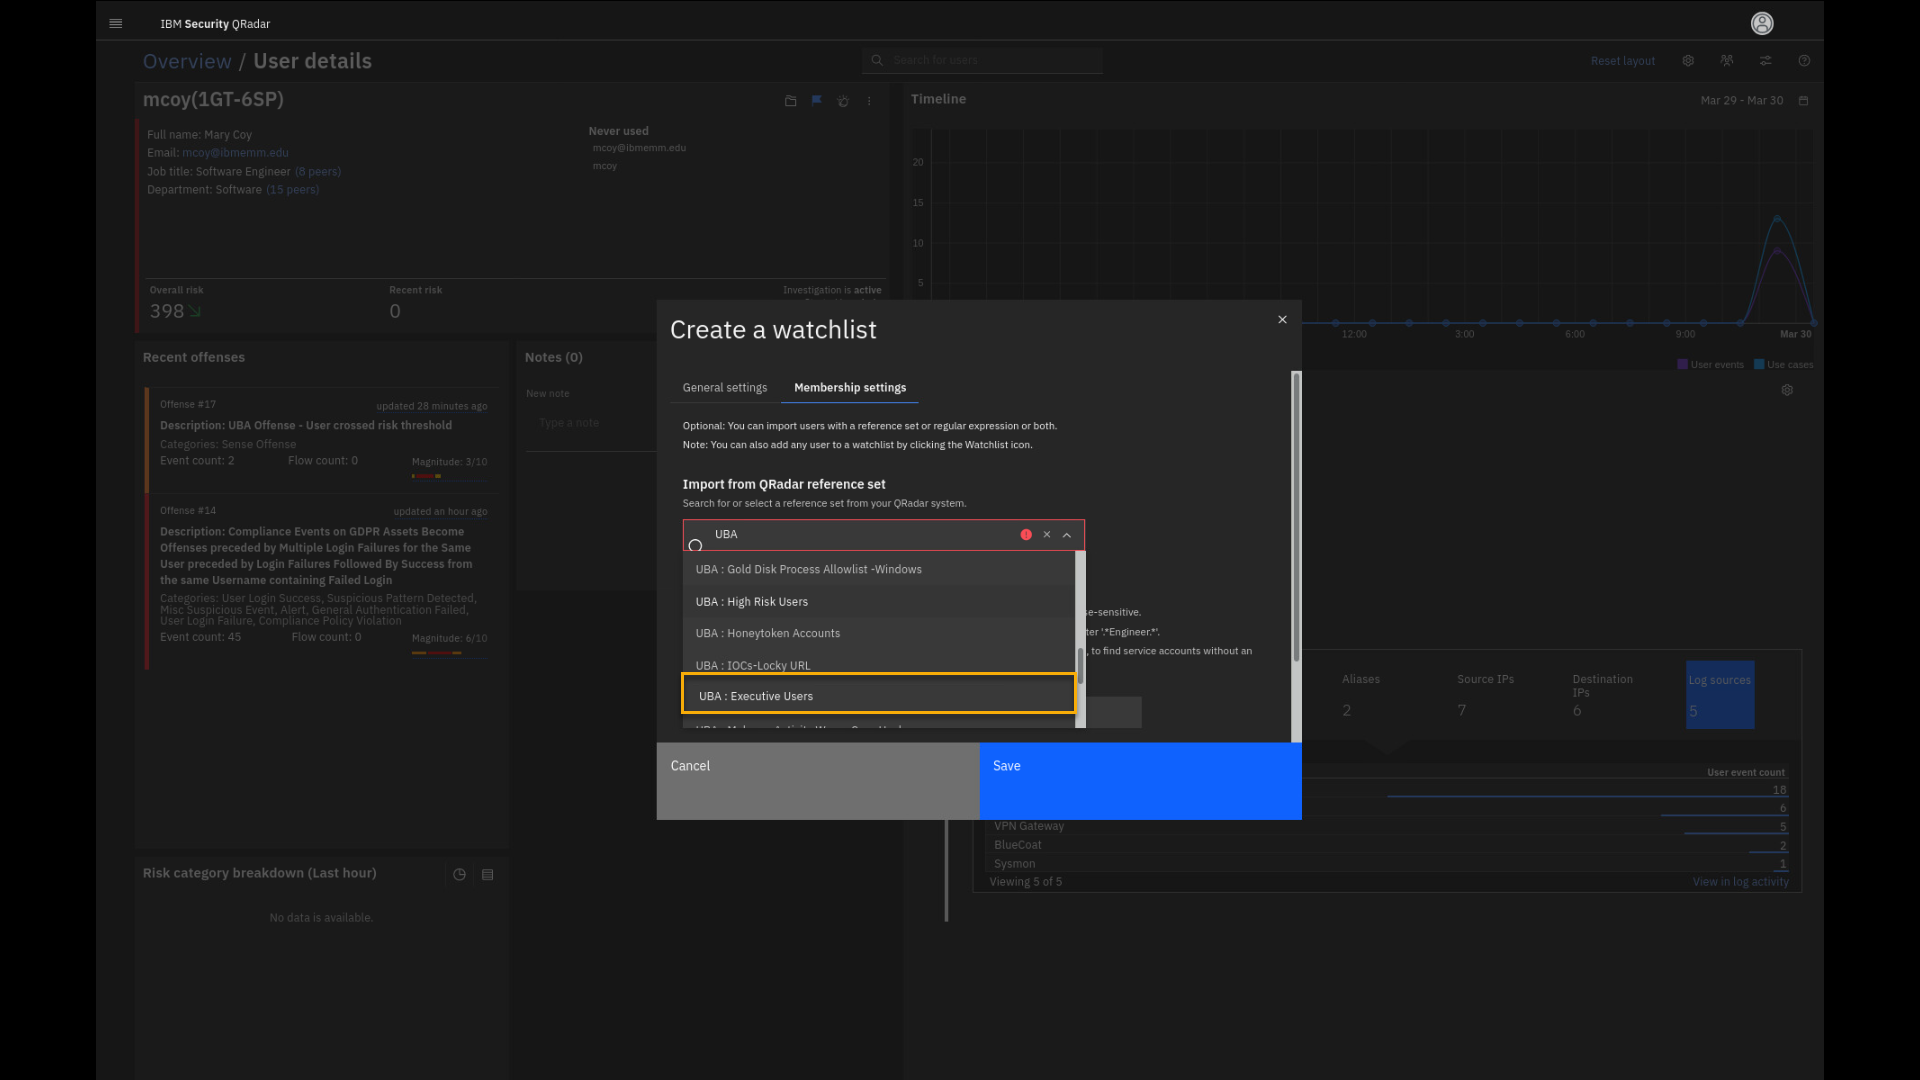
We see that the ref set has zero entries. But, if the account is added
to this reference set, the risk score will accumulate double points for
that user's activity. The action is defining that user as "risky",
elevating the user risk score to the top of the list, and increasing the
attention from the security analyst to prioritize the investigation of
that user activity.
This brings the demo to an end.
Summary
This lab and demonstration reviewed how security analysts using the QRadar
Console and different dashboards can review security-relevant activities
in the organization's network. We used the Analyst Workflow (also called
the New UI) interface to analyze offenses. We looked in depth at one
GDPR-related offense. We reviewed the offense details and insights, and
events related to the offense.
Then you learned how Use Case Manager can help to analyze the impact of
installed and non-installed rules and their relation to the MITRE ATT&CK
framework. We also touched on some points on the Reference Data
Management app and the Assistant app.
Finally, we analyzed the user behavior that was related to a
probable GDPR offense.